

RESEARCH QUESTION
By 2021, London’s mini-Holland programme will have invested £100 million in active travel interventions in three Outer London boroughs. One borough, Waltham Forest, has implemented multiple ‘low traffic neighbourhoods’ (LTNs), i.e. area-based interventions that remove through motor traffic from residential streets. Other mini-Holland areas have implemented other active travel infrastructure, including new pedestrian routes, cycle tracks, and motor traffic calming.
In previous work analysing a longitudinal survey of London residents, we found a statistically significant decrease in car ownership and use between 2016 and 2019 in mini-Holland LTN areas compared to non-mini-Holland boroughs in Outer London (Aldred and Goodman 2020). There was a weaker trend towards lower car ownership and use in areas receiving other active travel interventions, but this was not statistically significant. However, limited statistical power complicated interpretation.
In this study we therefore used comprehensive vehicle registration data to examine how vehicle ownership changed following the implementation of mini-Holland interventions.
METHODS AND DATA
The Driver and Vehicle Licensing Agency (DVLA) maintains the registration and licensing of motor vehicles in Britain, including the address of the person responsible for vehicle taxation. For simplicity we refer to this as ‘ownership’, although it also covers some forms of leasing a vehicle. We used DVLA data for the number of cars, light goods vehicles (‘vans’) and motorcycles in each Lower Super Output Area (LSOA) in Outer London on 31st December for the years 2012-2019. LSOAs are administrative areas containing around 1500 residents.
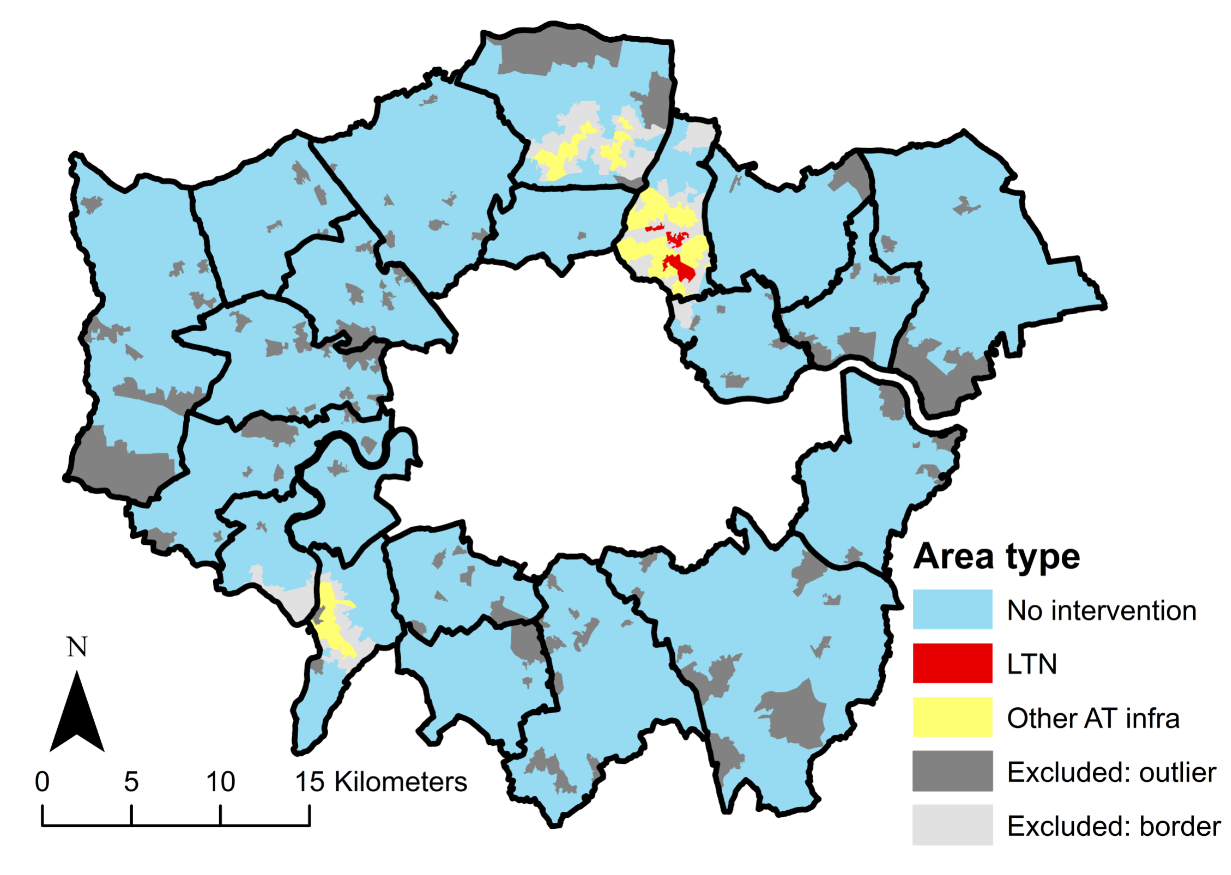
To examine how vehicle ownership changed over time, we identified whether each LSOA in each year was ‘inside’ a) an LTN intervention area, b) an intervention area with other active travel infrastructure, or c) neither (our control group). The two intervention categories were mutually exclusive; areas that ever received an LTN were not included in the other active travel infrastructure group. We defined ‘inside’ as at least 80% of the LSOA’s buildings being inside the intervention area.
Of 3098 LSOAs in Outer London, we excluded 129 that were ever outliers for vehicle ownership (this can reflect e.g. a car dealership).[1] We further excluded 88 border areas that were ever partially inside an intervention area but below our 80% threshold. This allowed cleaner comparisons between areas. The resulting analysis sample of 2881 LSOAs covered 93% of the population of Outer London (see Figure 1).

In linear regression analyses, our primary outcome was number of cars and vans per capita. We also present analyses predicting logged cars/vans per capita, to generate percentage change estimates. The exposure of interest was duration of time inside an intervention area. We included fixed effects for year and random intercepts for LSOA. We also present analyses adjusting for the expected proportion of adults with access to a car based on the age profile (see Supplemental information 1).
We defined duration of time inside an intervention area using the most accurate information available to us. For LTNs this is the month of implementation. For other active travel infrastructure, however, we only know which areas stakeholders identified as having received substantial intervention as of May 2017, May 2018, and May 2019. We conducted sensitivity analyses to confirm that our findings were very similar when we defined LTN implementation using the same snapshot approximation (see Supplemental Information 2).
FINDINGS
In our analysis sample, 2019 vehicle ownership rates were 461 cars per 1000 adults, 34 vans per 1000 and 24 motorcycles per 1000.
Per capita car/van ownership fell following the introduction of mini-Holland interventions, with larger effects observed as the duration since intervention increased (Figure 2, Table 1). These effects were 2 to 3 times larger in the LTN areas than the other active travel infrastructure areas. After two years car/van ownership reduced by 6% (23 cars/vans per 1000) in the LTN area relative to the control area, versus 2% (or 7 cars/vans per 1000) in the other active travel infrastructure area. These effects were larger after additionally adjusting for changes to the age profile, with a 7% reduction after two years in the LTN area and a 4% reduction in the other active travel infrastructure area (Figure 2).
_regression_coefficients_for_association_between_duration_of_interventio.jpeg)
As around 93% of cars in both Outer and Inner London are owned by people living on residential streets,[2] this suggests substantial potential to reduce car ownership through roll-out of LTNs in other residential neighbourhoods.
These declines in car/van ownership in the intervention areas are not continuations of pre-existing downward trends. Instead, the pre-intervention trend in the other active travel infrastructure area was fairly similar to the control area, and the trend was less favourable (more rapidly increasing) in the LTN area (Figure 3).

These declines in ownership were observed for both cars and vans (Supplemental information 2). The changes for vans were smaller in absolute terms and not always statistically significant, however, reflecting lower van ownership rates. There was never evidence of a change in motorcycle ownership.
Across London, 10% of households move home each year (Greater London Authority 2019). The observed changes in vehicle ownership could be partially or wholly driven by residential self-selection, if people who are less likely to own cars move in (e.g. younger renters), and/or people more likely to own cars move out (e.g. older owner-occupiers). As two indirect tests for self-selection, we examined changes in a) rates of residential property sales and b) the age profile of residents (see Supplemental Information 3). We found no evidence of self-selection in intervention areas: property sales did not increase, and changes to the age profile would have been expected to increase car ownership relative to control areas. We further note that reduced car ownership was observed in our previous study that followed the same people longitudinally and was therefore unaffected by residential self-selection (Aldred and Goodman 2020).
In conclusion, numbers of cars and vans are falling in mini-Holland intervention areas, particularly those involving an LTN. This adds to evidence that these interventions lead to traffic evaporation (London Borough of Waltham Forest 2017) and a mode shift away from cars (Aldred and Goodman 2020).
ACKNOWLEDGEMENTS
None
Outliers were defined as ever being any of the following: >1000 cars per 1000 adults; >200 vans per 1000 adults; >75 motorbikes per 1000 adults; or in the top 0.2% for residual size in any of four regression models adjusting only for year and LSOA and predicting in turn to cars/vans, cars, vans, or motorcycles.
Tabulated data from the London Travel Demand Survey, 2017/18 – 2019/20, provided by Transport for London