Loading [Contrib]/a11y/accessibility-menu.js
Skip to main content
null
Findings
  • Menu
  • Articles
    • Energy Findings
    • Resilience Findings
    • Safety Findings
    • Transport Findings
    • Urban Findings
    • All
  • For Authors
  • Editorial Board
  • About
  • Blog
  • covid-19
  • search

RSS Feed

Enter the URL below into your favorite RSS reader.

http://localhost:23905/feed
Transport Findings
December 16, 2020 AEST

The Impact of Introducing a Low Traffic Neighbourhood on Fire Service Emergency Response Times, in Waltham Forest London

Anna Goodman, Anthony A Laverty, Rachel Aldred,
motor traffic reductionlow traffic neighbourhoodtraffic calmingmodal filteremergency serviceemergency response time
Copyright Logoccby-sa-4.0 • https://doi.org/10.32866/001c.18198
Findings
Goodman, Anna, Anthony A Laverty, and Rachel Aldred. 2020. “The Impact of Introducing a Low Traffic Neighbourhood on Fire Service Emergency Response Times, in Waltham Forest London.” Findings, December. https:/​/​doi.org/​10.32866/​001c.18198.
Save article as...▾
Download all (4)
  • Figure 1: The London Borough of Waltham Forest, and its expanding LTN area
    Download
  • Figure 2: Performance of Waltham Forest LTN area relative to the rest of Waltham Forest and the rest of London, 2012-2020
    Download
  • Figure 3: Proportion of first attending engines taking over 6 minutes to attend for different reasons
    Download
  • Supplemental Document
    Download

Sorry, something went wrong. Please try again.

If this problem reoccurs, please contact Scholastica Support

Error message:

undefined

View more stats

Abstract

There is sometimes concern that low traffic neighbourhoods slow emergency vehicles. We test this using London Fire Brigade data (2012-2020) in Waltham Forest, where from 2015 low traffic neighbourhoods have been implemented. We find no evidence that response times were affected inside low traffic neighbourhoods, and some evidence that they improved slightly on boundary roads. However, while the proportion of delays was unchanged, the reasons given for delays initially showed some shift from ‘no specific delay cause identified’ to ‘traffic calming measures’. Our findings indicate that low traffic neighbourhoods do not adversely affect emergency response times, although while LTNs are novel this perception may exist among some crews.

RESEARCH QUESTION

‘Low Traffic Neighbourhoods’ (LTNs) are area-based interventions that remove through motor traffic from the area’s residential streets, for example via modal filters that restrict motor vehicles while allowing pedestrians and cyclists through. In 2020, Covid-related emergency active travel funding has led to LTNs being more widely implemented across the UK (Aldred and Verlinghieri 2020).

Emergency services are statutory consultees consulted before the implementation of any LTN (Transport for London 2020). Nevertheless, concerns are sometimes raised that these measures may slow emergency response times. We have not found any empirical examination of this question. From a theoretical perspective, effects in both directions seem possible: diverting around a modal filter could increase response times, but a reduction in traffic or improved vehicle flow (e.g. because of fewer cars turning out of side roads) could reduce response times.

Since 2015, the London Borough of Waltham Forest has implemented a growing LTN area, mainly using physical barriers and bollards that emergency services can unlock (see Figure 1). In this paper we examine how this LTN introduction affected London Fire Brigade (LFB) emergency response times.

Figure 1
Figure 1:The London Borough of Waltham Forest, and its expanding LTN area

The main map shows the London Borough of Waltham Forest. The inset map shows Waltham Forest within Outer London. In our research we consider LTNs introduced prior to 31st August 2020 (the latest one introduced was in fact in December 2019). We do not consider four additional LTN areas introduced in Waltham Forest during September 2020.

METHODS AND DATA

The LFB responded to 451,195 emergency incidents in Outer London between 1st January 2012 and 31st August 2020[1]. We excluded 27,351 incidents lacking response times (e.g. because firefighters were instructed to return to the station before arriving). This gave an analysis sample of 423,844 incidents, of which 23,343 were in Waltham Forest.

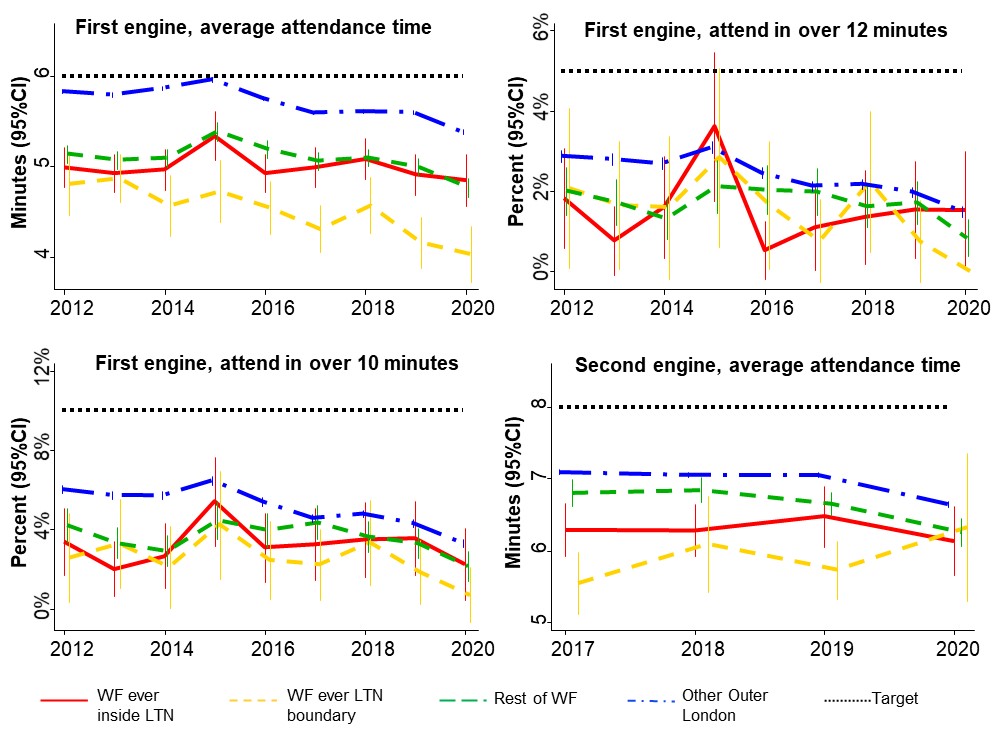
Attendance time of the first attending fire engine was our primary outcome. This covers the period from when the emergency call is answered to when the first fire engine arrives at the scene. As secondary outcomes, we describe performance against the LFB’s 2019 response targets (London Fire Brigade 2019):

  • First fire engine average attendance time under 6 minutes.

  • First fire engine arrives within 12 minutes in ≥95% of incidents.

  • First fire engine arrives within 10 minutes in ≥90% of incidents.

  • Second fire engine average attendance time under 8 minutes. Second engine data was only recorded from 2017 onwards, for the 39% of incidents requiring a second engine.

When attendance time is over 6 minutes, firefighters are asked for the reason for the delay. We examined the proportion of incidents in which the first engine took over 6 minutes to arrive, both overall and for different delay reasons.

Incident coordinate data were available to the nearest meter for 55% of incidents and to the nearest 100 metres for the remainder. We used incident location and date to identify whether each point was a) inside an LTN or b) on an LTN boundary road. Additional analyses examined impacts stratified by duration of implementation (<1 year versus ≥1 year) and tested for differences between early versus later LTNs (implementation in 2015/16 versus 2018/19).

For continuous outcomes we used multilevel random-effects linear regression. We modelled incidents as being nested within Lower Super Output Areas (administrative areas containing around 1500 inhabitants), to allow for geographical clustering in response times. Results were similar using fixed effects, and in sensitivity analyses excluding outliers (first engine response times <30 seconds or >900 seconds). For binary outcomes we used multilevel random-effects Poisson regression with robust standard errors (Zou 2004).

FINDINGS

All parts of Waltham Forest outperformed the rest of Outer London and achieved LFB response targets by a wide margin (Figure 2). Across the period 2012-2020, areas that eventually became LTNs were similar to the rest of Waltham Forest, and areas that eventually became LTN boundary roads (generally A and B class roads) were similar or better.

Figure 2
Figure 2:Performance of Waltham Forest LTN area relative to the rest of Waltham Forest and the rest of London, 2012-2020

CI = confidence interval. LTN = low traffic neighbourhood. WF = Waltham Forest. Inside LTN and LTN boundary areas are those covered as of August 2020.

Inside the LTNs, there was no evidence that LTN introduction affected any response metric (Table 1). On the boundary, LTN introduction was associated with slightly faster response times, with this being statistically significant for two of the four performance metrics (e.g. -16 seconds, 95%CI -26 to -6 seconds, for mean first engine attendance time). The results were similar in analyses subdivided by the duration of LTN implementation (Table 1, Model B).

Table 1:Association between LTN status and fire engine attendance time in Waltham Forest, 2012-2020
First engine Second engine
N incidents Attendance time (seconds: regression coefficient) % take longer than 12 minutes (rate ratio) % take longer than 10 minutes (rate ratio) N incidents Attendance time (seconds: regression coefficient)
LTN impact [Model A] Not in or next LTN 21,104 0 1 1 3098 0
LTN boundary 855 -15.6 (-25.6, -5.6)** 0.57 (0.29, 1.12) 0.61 (0.39, 0.96)* 231 -10.4 (-33.7, 12.9)
Inside LTN 1384 8.0 (-0.7, 16.7) 0.90 (0.58, 1.39) 1.13 (0.80, 1.61) 537 -7.9 (-27.9, 12.0)
LTN impact, by time since implementation [Model B] Not in or next LTN 21,104 0 1 1 3098 0
LTN boundary, <1 year 267 -16.4 (-32.5, -0.2)* 0.69 (0.25, 1.85) 0.68 (0.36, 1.29) 45 -9.3 (-52.9, 34.4)
LTN boundary, ≥1 year 588 -15.3 (-27.0, -3.6)* 0.51 (0.23, 1.12) 0.57 (0.34, 0.96)* 186 -10.6 (-36.1, 14.8)
Inside LTN, <1 year 390 8.8 (-4.8, 22.4) 0.83 (0.36, 1.93) 1.08 (0.63, 1.86) 56 -9.5 (-49.4, 30.3)
Inside LTN, ≥1 year 994 7.7 (-2.3, 17.7) 0.93 (0.54, 1.60) 1.15 (0.80, 1.67) 481 -7.6 (-28.9, 13.6)

*p<0.05, **p<0.01, ***p<0.001, for difference from reference category. Values in brackets are the 95% confidence intervals. LTN = low traffic neighbourhood. Based on incidents covering January 2012-August 2020 for first engine analyses, and incidents covering January 2017-August 2020 for second engine analyses. All analyses adjust for calendar year (nine categories), quarter of year (four categories), time of day (four categories of midnight to 06:59; 07:00 to 10:59; 11:00 to 18:59; 19:00 to 23:59) and road type (A or B road; minor road; local road and smaller) as fixed effects; and for Lower Super Output Area as a random intercept. No interaction reached statistical significance (all p>0.05), when testing in Model A whether LTN impacts differed for those LTNs introduced in 2015/16 versus 2018/19.

There was no evidence of an impact of the introduction of the LTNs on the overall proportion of first engine delays (Table 2). There was, however, a shift in the composition of reasons given for delays inside the LTNs. Specifically, there was an increase in delays coded as ‘traffic calming measures’, and a corresponding decrease in delays coded ‘not held up’ (Table 2). This was particularly marked in the first year (Table 2, Model B) and was only observed for LTNs implemented in 2015 and 2016 (see Figure 3). Delays such as needing to detour around a modal filter may be more visible and salient to firefighters than other causes of delay, particularly soon after a scheme is implemented. This relates to what causes of delays are made visible by the coding system: a delayed trip involving an LTN can be coded ‘traffic calming measures’ whereas a delayed trip involving the everyday motor traffic of the ‘normal’ road environment has no available code except ‘not held up’.

Table 2:Association (adjusted rate ratios) between LTN status and whether first fire engine has a delay (>360 second attendance time) in Waltham Forest, 2012-2020
N incidents % any delay % delay coded due to ‘traffic calming measures’ % delay coded due to ‘traffic, roadworks etc’ % delay coded due to a different specified issue % delay coded ‘not held up’, i.e. no specific reason
LTN impact [Model A] Not in or next LTN 21,104 1 1 1 1 1
LTN boundary 855 0.97 (0.80, 1.16) 0.59 (0.30, 1.14) 1.17 (0.78, 1.76) 1.20 (0.89, 1.62) 0.73 (0.53, 1.00)*
Inside LTN 1384 1.04 (0.89, 1.22) 1.89 (1.32, 2.70)*** 1.26 (0.97, 1.64) 0.88 (0.66, 1.19) 0.82 (0.66, 1.01)
LTN impact, by time since implementation [Model B] Not in or next LTN 21,104 1 1 1 1 1
LTN boundary, <1 year 267 0.96 (0.76, 1.22) 0.44 (0.10, 1.83) 1.58 (0.97, 2.58) 0.96 (0.56, 1.62) 0.66 (0.38, 1.14)
LTN boundary, ≥1 year 588 0.96 (0.77, 1.21) 0.66 (0.35, 1.23) 0.94 (0.51, 1.74) 1.34 (0.91, 1.97) 0.76 (0.54, 1.09)
Inside LTN, <1 year 390 1.10 (0.90, 1.35) 2.24 (1.41, 3.56)** 1.34 (0.95, 1.89) 0.93 (0.57, 1.51) 0.78 (0.54, 1.14)
Inside LTN, ≥1 year 994 1.02 (0.85, 1.22) 1.73 (1.15, 2.60)** 1.21 (0.86, 1.71) 0.87 (0.57, 1.32) 0.83 (0.65, 1.06)

*p<0.05, **p<0.01, ***p<0.001, for difference from reference category. Values in brackets are the 95% confidence intervals. LTN = low traffic neighbourhood. Based on incidents covering January 2012-August 2020. All analyses adjust for calendar year (nine categories), quarter of year (four categories), time of day (four categories of midnight to 06:59; 07:00 to 10:59; 11:00 to 18:59; 19:00 to 23:59) and road type (A or B road; minor road; local road and smaller) as fixed effects; and for Lower Super Output Area as a random intercept. We conducted tests for interaction in Model A, examining whether LTN impacts differed for those LTN is introduced in 2015/16 versus 2018/19. There was some evidence of this in relation to the effect of being inside and LTN traffic calming delays (p=0.05 for interaction), such that an effect was only seen for LTNs implemented in 2015 and 2016 (see Figure 3). No other interactions were statistically significant.

Figure 3
Figure 3:Proportion of first attending engines taking over 6 minutes to attend for different reasons

LTN = low traffic neighbourhood, WF=Waltham Forest. The top graph presents data for LTNs implemented between September 2015 and June 2016, with a ‘pre’ period 1st January 2012 to 30th June 2015, and a post period 1st June 2016 to 31st August 2020. The bottom graph presents data for LTNs implemented between February 2018 and February 2019, with a ‘pre’ period 1st January 2012 to 31st December 2017, and a post period 1st February 2019 to 31st August 2020. See the Supplemental Information for a tabulation of these results and for graphs examining causes of delay across the full period 2012-2020, equivalent to those shown in Figure 2.

These findings demonstrate that traffic calming measures can initially be identified as delaying some trips without any overall effect on response time performance. This echoes the opinion of the LFB Waltham Forest Borough Commander, commenting in 2016 on the initial introduction of LTNs: “I think it would be fair to say that road closures can cause delays to the arrival of LFB appliances… [but] road closures are a frequently occurring feature of London’s infrastructure and, so far, they have never caused a detrimental delay to our emergency response. […It is my view] that the road closures in Waltham Forest have not had a significant impact on our services” (London Fire Brigade 2016). Our findings underline the importance of measuring actual impacts on total emergency response times, as measured using meaningful performance metrics - rather than simply extrapolating from the theoretical speed penalty specifically of navigating a traffic calming measure.

In summary, we find no evidence that the Waltham Forest LTN affected overall fire engine response times inside the LTN area, including in the year after implementation. We also find that response times improved slightly on the LTN boundary roads. Our findings provide reassurance that the area-wide traffic reduction (London Borough of Waltham Forest 2017) and active travel (Aldred and Goodman 2020) benefits of LTNs are not compromised by increased emergency service response times to or around those areas.


ACKNOWLEDGEMENTS

AL is funded by National Institute of Health Research (NIHR) School for Public Health Research.


  1. Data available from https://data.london.gov.uk/dataset/london-fire-brigade-incident-records and https://data.london.gov.uk/dataset/london-fire-brigade-mobilisation-records

Submitted: November 05, 2020 AEST

Accepted: December 04, 2020 AEST

References

Aldred, Rachel, and Anna Goodman. 2020. “Low Traffic Neighbourhoods, Car Use, and Active Travel: Evidence from the People and Places Survey of Outer London Active Travel Interventions.” Findings, September. https:/​/​doi.org/​10.32866/​001c.17128.
Google Scholar
Aldred, Rachel, and Ersilia Verlinghieri. 2020. “LTNs for All? Mapping the Extent of London’s New Low Traffic Neighbourhoods.” Possible and the Active Travel Academy. http:/​/​www.wearepossible.org/​LTN-report.
London Borough of Waltham Forest. 2017. “Walthamstow Village Review - Main Report.” https:/​/​enjoywalthamforest.co.uk/​work-in-your-area/​walthamstow-village/​walthamstow-village-review/​.
London Fire Brigade. 2016. “Freedom of Information Request Reference Number: FOIA2688.2; Date of Response 03/08/2016.” Obtained 13/10/2020 from informationaccess@london-fire.gov.uk.
———. 2019. “Fire Facts: Incident Response Times.” https:/​/​data.london.gov.uk/​dataset/​lfb-fires-in-london-1966-2019---fire-facts.
Transport for London. 2020. “Appendix Six(A): Supplementary Guidance on Low Traffic Neighbourhoods.” http:/​/​content.tfl.gov.uk/​lsp-app-six-a-supplementary-guidance-ltns-v1.pdf.
Zou, G. 2004. “A Modified Poisson Regression Approach to Prospective Studies with Binary Data.” American Journal of Epidemiology 159 (7): 702–6. https:/​/​doi.org/​10.1093/​aje/​kwh090.
Google Scholar

This website uses cookies

We use cookies to enhance your experience and support COUNTER Metrics for transparent reporting of readership statistics. Cookie data is not sold to third parties or used for marketing purposes.

Powered by Scholastica, the modern academic journal management system