1. RESEARCH QUESTION AND HYPOTHESIS
The COVID-19 crisis necessitated the rapid collection of travel behaviour data using methods that did not risk exposing researchers and research subjects to the disease. We report on the utility of Facebook and Transit app for recruiting transit riders into a travel surveys that ran in Toronto and Vancouver in April and May 2020. This study asks two things. First: how demographically and spatially representative are samples drawn from Facebook and Transit app? Second, we ask if our Facebook sample can replicate known travel behaviour relationships established in the literature. Successful replication of known relationships is an approach used to validate samples recruited through social media (Boas, Christenson, and Glick 2020). Researchers may find these recruitment strategies valuable for future research if our findings suggest that our samples are capable of replicating empirically established relationships.
Social and health sciences are embracing social media recruitment, including fields as diverse as psychology (Kosinski et al. 2015), health (Whitaker, Stevelink, and Fear 2017), and education (Forgasz et al. 2018). Identified problems with Facebook recruitment include over-representation of younger women (Whitaker, Stevelink, and Fear 2017), and non-representation of the digitally disconnected (Forgasz et al. 2018). The advantages of Facebook include better access to hard-to-reach populations (Batterham 2014), along with cost-effectiveness (Kosinski et al. 2015). No prior research examines the utility of Facebook recruitment for transportation research. In contrast, research shows that Transit app’s ridership information is not demographically biased by income, age, or ethnicity at a neighbourhood level (Ghahramani and Brakewood 2016)
Our Facebook survey sought to draw from the universe of people who regularly rode transit in Toronto and Vancouver prior to COVID-19, and asked if they still rode transit during the crisis, while Transit app only surveyed active riders. We thus can compare our surveys in two ways. First, we compare our total Facebook sample against the profile of regular transit users in the Transport Tomorrow Survey (TTS), one of the largest household travel surveys in the world (DMG 2014). Second, we compare the demographics of a subsample of our respondents who are still riding transit against results from a Transit app survey of active transit users that ran in the same cities less than a month before our own.
Based on the literature, we hypothesize that:
-
Our Facebook sample will significantly over-represent women and younger people compared to the TTS for all respondents, and compared to Transit App among respondents who still rode transit during COVID-19;
-
Our Facebook sample will successfully replicate known negative relationships between neighborhood population density and transit service levels on vehicle ownership, and positive relationships between income and household head age on vehicle ownership (Ryan and Han 1999; Schimek 1996).
2. METHODS AND DATA
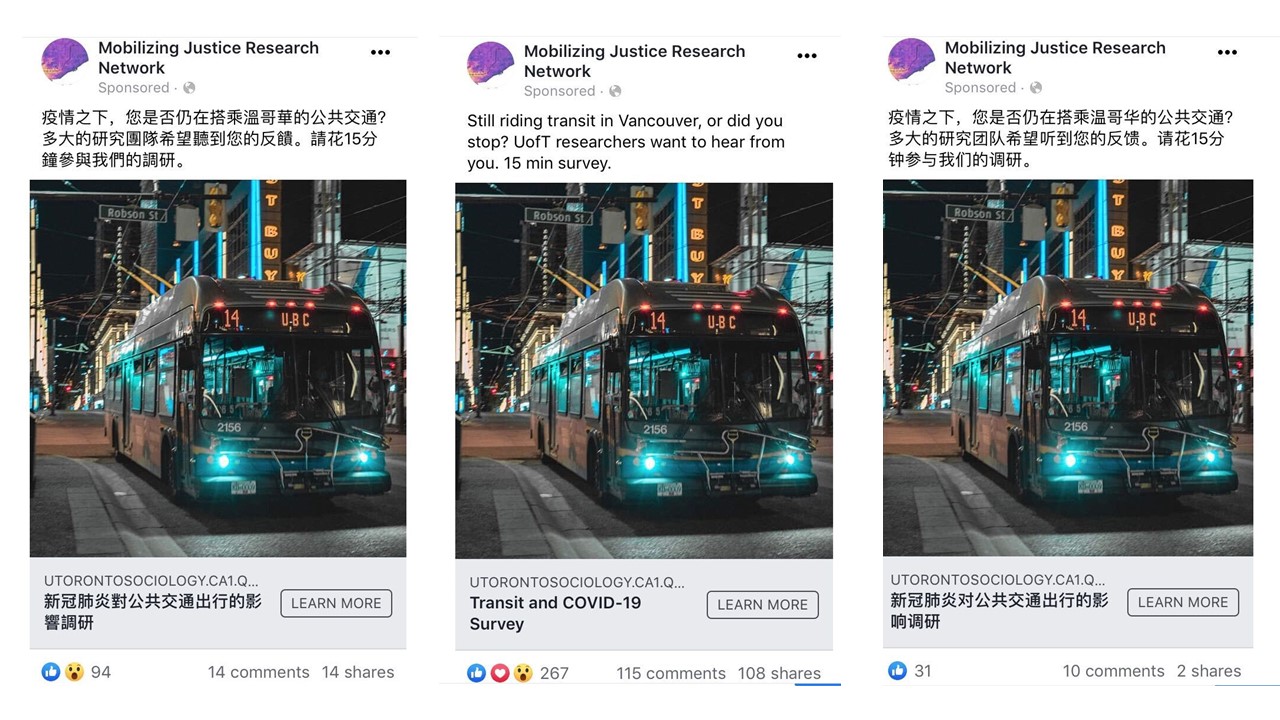
Facebook recruitment took place through advertisements spatially targeted to subject cities. Half of ad spending was tailored towards ‘reach,’ meaning half the spending was designed to show the ads to as broad a range of users as possible. The other half was focused on engagement, with algorithms strategically placing ads to optimise clicks on the survey link. In Toronto, 17% of Facebook users saw at least one ad, 484,352 individuals. In Vancouver, 27% of Facebook users saw at least one ad, 242,816 individuals. Example ads are provided in Figure 1, highlighting the language and images used to recruit transit riders. Transit app recruitment took place in the app itself. When a user opened the app, they were prompted with an invitation to participate in a survey.

We first use the chi-square test to compare demographics of transit riders in each survey by gender, age, income, vehicle ownership, and dwelling type. Categorical bins for age and income in the Transit app survey did not exactly align with the Facebook survey, and some observations were re-categorized based on population distributions to match the other survey’s bins. Next, we use the TTS and Facebook samples to build binomial logistic regression models predicting household vehicle ownership. Models are compared using the classification rate. We recomputed models with half of each dataset and tested them on the other half, generating classification rates. The presented models, however, are based on full datasets.
FINDINGS
Differences are statistically significant across all variables of interest, between all samples as presented in Table 1. The Facebook approach recruited more women compared to the TTS for all transit riders, as anticipated, while Transit app solicited greater participation from younger riders and lower income riders. In contrast, Transit app’s gender breakdown more closely matches the TTS despite Transit only surveying those still riding transit during COVID-19. The Facebook sample also has a slightly larger percentage of low- and middle-income earners relative to the TTS among all riders. Both Facebook and Transit app samples report similar percentages of current riders who do not own vehicles, between 85% and 87%.
Demographic comparisons for Vancouver are shown in Table 2. We were unable to secure household travel survey data to use for comparison in Vancouver. Similarities and differences between the surveys in Vancouver mirror those for Toronto. All differences are significant except on vehicle ownership.
Table 3 presents the results of our binomial logistic regressions. The results demonstrate that higher income households and those in less dense communities with worse transit access are more likely to own a vehicle, in line with the literature and theory (Ryan and Han 1999; Schimek 1996).The directions of the coefficients in models using TTS data and FB data are identical in nearly all cases except for building type and head of household age.
The classification rates reveal that the TTS model does a better job predicting vehicle ownership. However, our Facebook sample successfully replicated known associations between vehicle ownership and several predictors. Evidence from Transit app and our Facebook sample suggest that people still riding transit in early months of the pandemic were mostly car-less and of low incomes. Undoubtedly, public transit remained an important essential service for urban residents with fewer resources to afford alternative means of travel.