1. RESEARCH QUESTIONS AND HYPOTHESES
As an effect of COVID-19, the ridership of bike-share services plummeted with the economic shutdown wave. Teixeira and Lopez (2020) found that bike-sharing in New York, comparative to transit, show higher resiliency and a lower drop in ridership. Analyzing ridership of bike-share in Washington DC, Boston, Pittsburgh, Columbus, and Portland, this exploratory study tries to answer two questions:
1. How has the usage of bike-share services in areas with different distances from CBD varied during the pandemic?
2. Is the weekly bike-share ridership of a city correlated with its overall trip rate, social distancing measures, and COVID cases?
2. METHODS AND DATA
This study analyzed five large cities of the USA (with at least 65,000 workers) that differ in modal dominancy. While Washington, DC and Boston have high transit mode share (34.8% and 31.4% respectively), Pittsburgh and Columbus are mostly car dominant cities with car share of 70.6% and 80.3%. Portland is bike-friendly and has moderate transit and car share (11% and 61.1%, respectively). Although several other cities potentially met the criteria, the most updated bike-share data’s unavailability inhibited their inclusion in this study. The critical dataset here is the system data of bike-share services (Capital Bike-share 2020; Bluebikes 2020; Healthy Ride 2020; CoGo Bike-share 2020; Biketown 2020) with temporal and spatial information of origins and destinations of bike-share trips. For cleaning the data, trips less than 3 minutes long or longer than 3 hours were removed.
First, the bike-share activity of census tracts between February 2020 to August 2020 was calculated with the following formula:
activity=Tg+Td−Ti
Here, are the number of generated, terminated, and intra-tract trips of a tract, respectively (Bai and Jiao 2020). The dependent variable (DV) is the month-to-month change (%) of bike-share activity and calculated with the following simple formula:
Δactivitym=activitym−activitym−1activitym×100
Here, m is month, ranged from March ‘20 to August’ 20. Each tract has a variable (distCBD) with the distance of its nearest CBD. Assessing the spatial extent of bike-share usage, Boston and DC were found to be polycentric while Columbus, Portland, and Pittsburgh were considered monocentric cities. To formalize the association of the month-to-month variation of activity within a tract and its distance from CBD, six General Linear Models (GLM) with random intercepts and random slopes were fitted for the six months. The form of the models is:
Y_{ij} = β_{o} + β_{j}*City + \beta_{ij1} * distCBD + \beta_{ij2}*City*distCBD + \beta_{ij3}*control + ε_{ij}
Here, is DV for the tract i of city j, is the random intercept for the city j, and are the random slopes for distCBD in tract i of city j.
Setting 2019 as a baseline would be a common approach for comparison. However, as the shift of usage from 2019 cannot be solely attributable to Coronavirus for some substantial policy changes in 2020 (i.e. setting first stations and dockless hubs in 263 tracts, launching electric and dockless bikes in three cities), preceding months of 2020, free from policy change effect, served as a baseline offering the ability to capture every turn during the Coronavirus.
Secondly, each study area’s total weekly trips for 26 weeks (March’20-August’20) were calculated. Then an assessment was carried out to find its correlation with seven mobility, social distancing, and COVID related metrics that include work and non-work trips/person (all mode), social distancing index (SDI) (in 0-100 scale where 100 denotes the highest degree of maintaining social distance), % working from home, % staying home, COVID exposure/1000 people and new cases/1000 people (Maryland Transportation Institute 2020). These metrics have daily records for every county in the USA. Here, the weekly average is taken for the counties that intersect the study areas.
3. FINDINGS
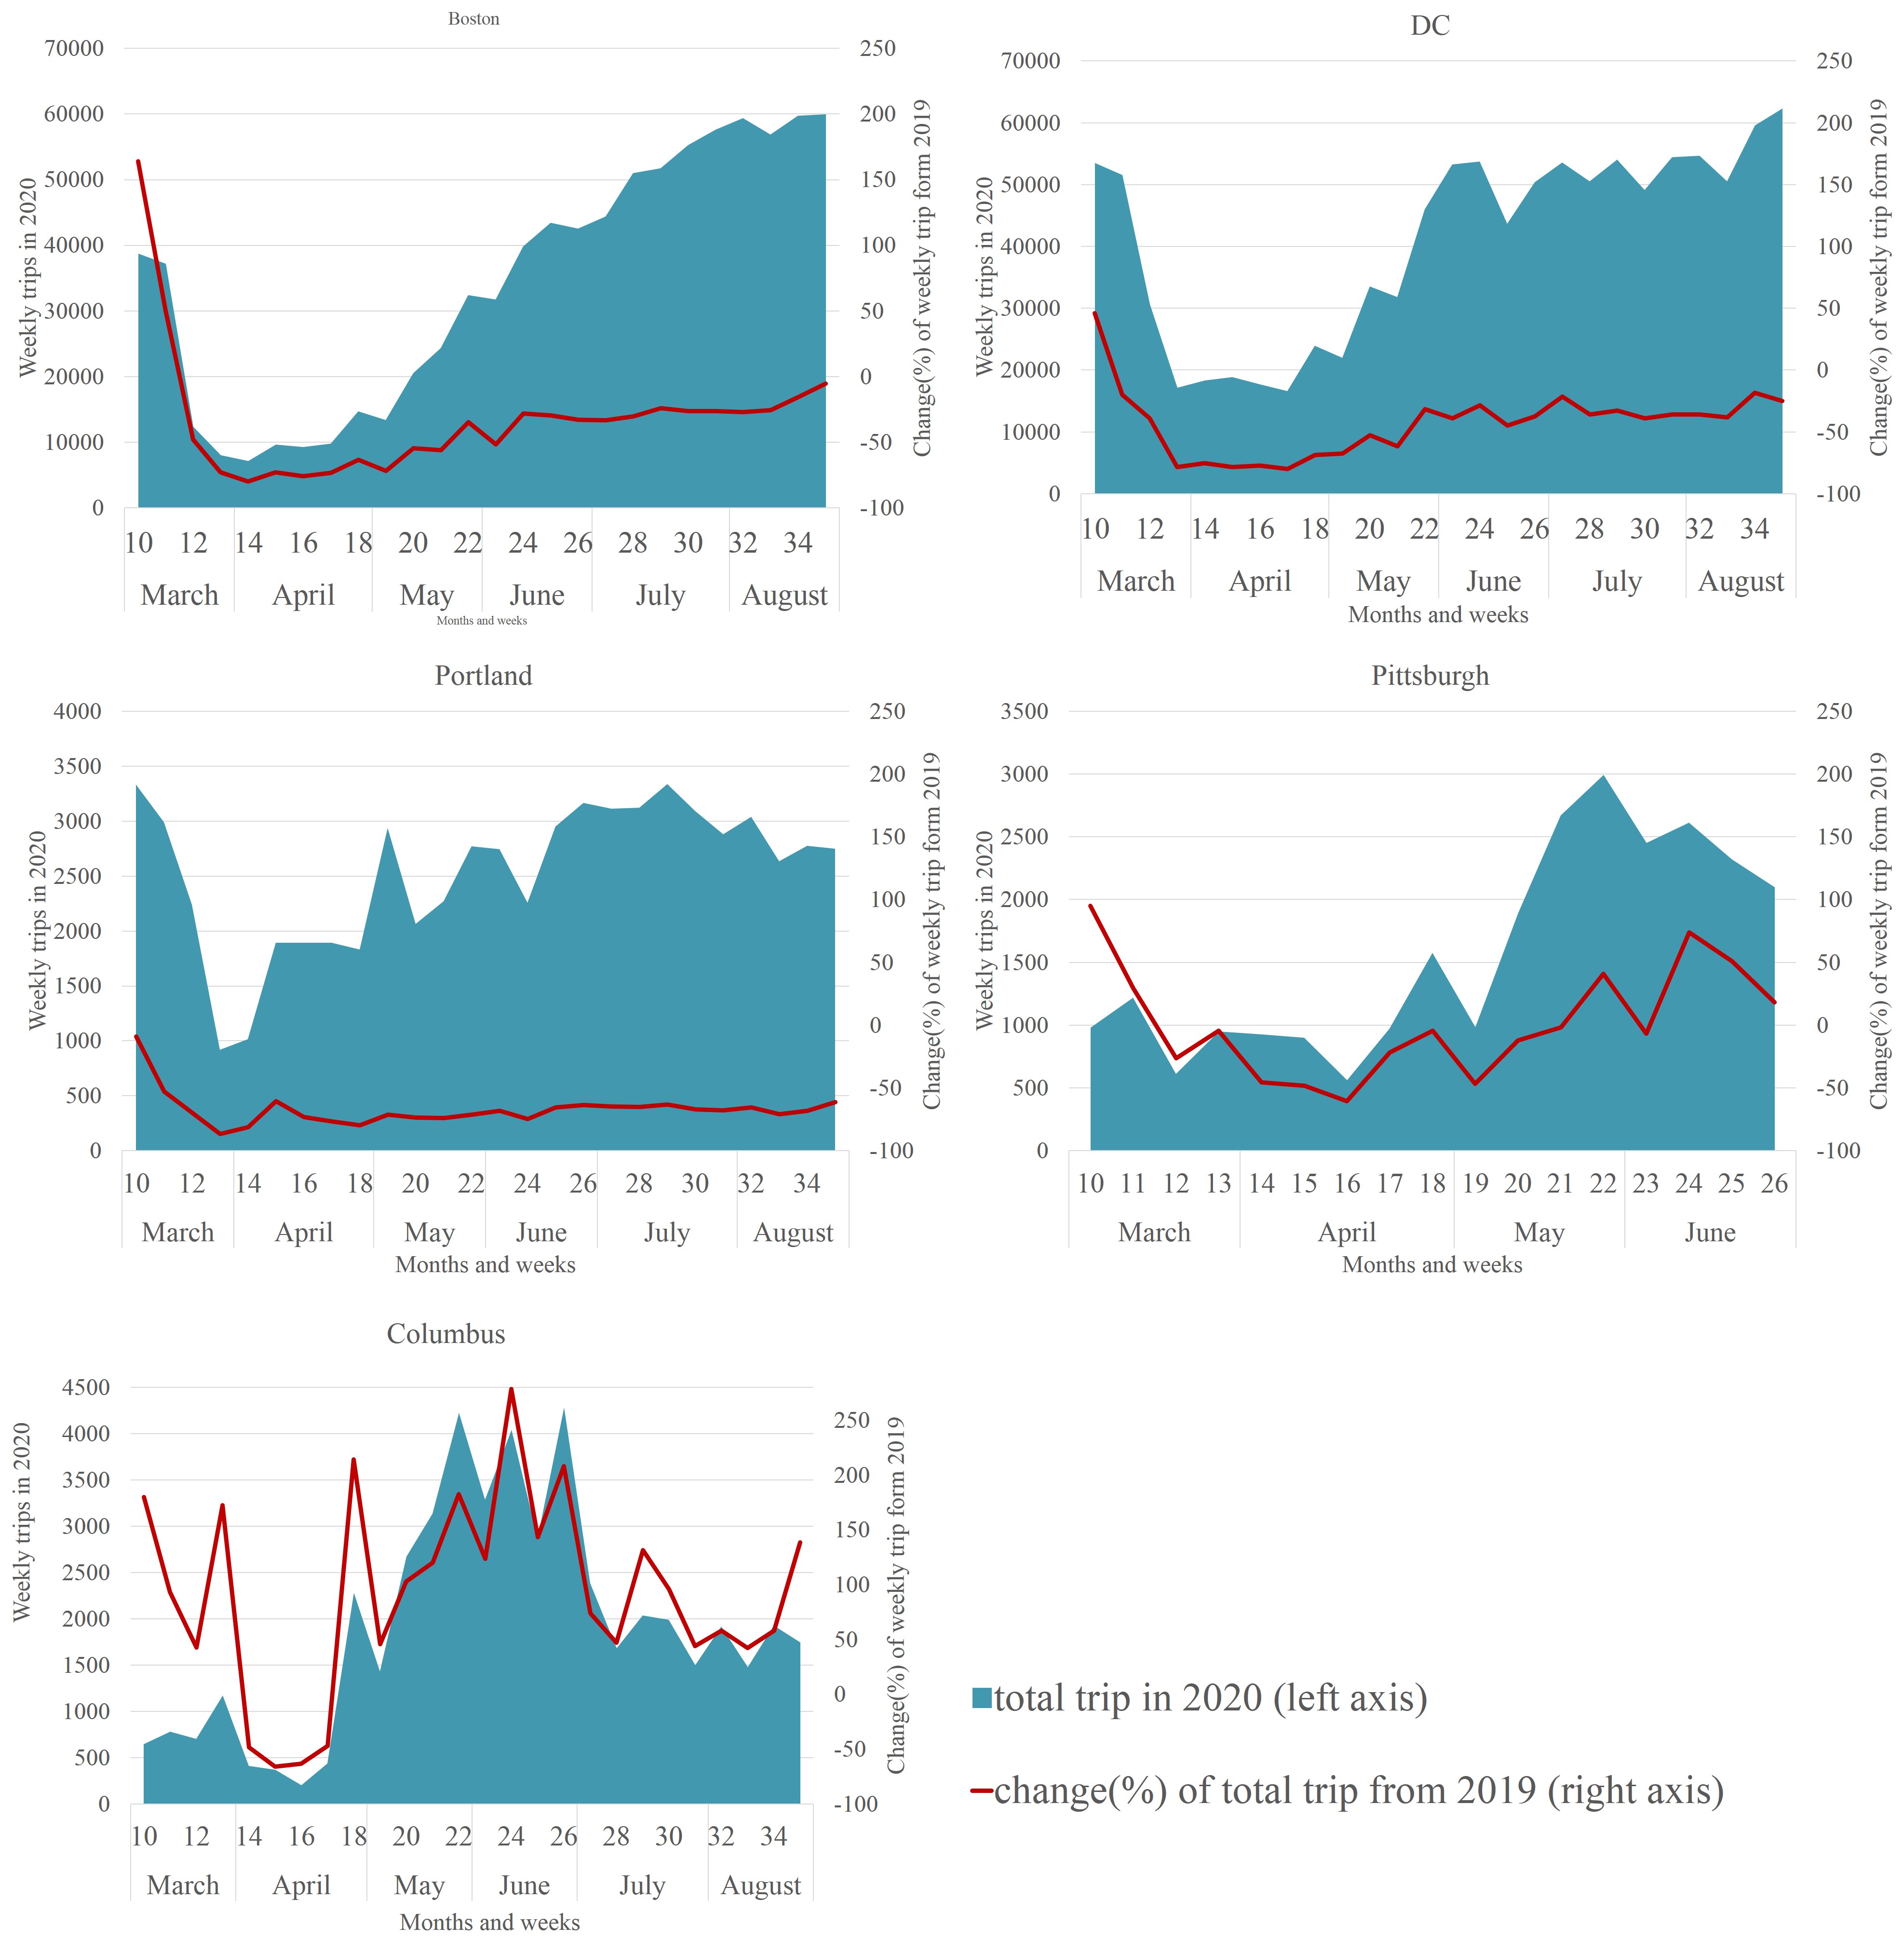
Before looking at the month-to-month changes, it is useful to see the entire bike-share trips over time and compare them with total trips in 2019 from Figure 1. This figure tells us that every city had a drop in bike-share usage during the first wave of COVID-19 in March-April and a subsequent jump in May as cities started to reopen gradually. Bernardes (2020) also found a similar trend for New York. In contrast, other surveys in Australia (Beck and Hensher 2020) and India (Meena 2020) did not suggest a substantial increase in bicycling after lockdowns. In our case, while as of August, cities with popular bike-share services (Boston, DC, and Portland) are struggling to regain the same ridership as 2019, car dominant cities (Columbus, Pittsburgh) had crossed it in May, suggesting an overwhelming modal shift. To this end, Table 1 represents the summary of month-to-month changes in bike-share usage in these cities. The intercept (βo) and city-specific fixed effect (βj) tell the monthly changes in a city which is consistent with the figure 1. In April, bike-usage had decreased in all cities equivocally and DC, Boston and Columbus had significant decreases. In the next month, an increase in ridership was evident in all cities showing significance in DC, Pittsburgh and Columbus. In June and July, with the rise of country’s second wave of Coronavirus, the growth of bike-demand dropped significantly in most of the cities (except for Columbus in June and DC in July) and was even halted in Pittsburgh and Columbus. User’s response towards bikeshare during the fall of the second wave (mid-July to August) was mixed. While in August, Boston and Portland were persistently experiencing the slow growth (20% and 3.7% respectively), DC had 81% more trips than July.

It is well-documented that the usage of bike-share diminishes with distance from CBD (Faghih-Imani et al. 2014; Wang et al. 2016; Noland, Smart, and Guo 2016; Yang et al. 2020) and an exploratory regression on the study areas (not reported here) also confirms this relation for COVID-19 era. Instead of cross-sectional usage, this study’s particular interest is to see the fluctuations of usage in tracts with different distances from CBD. There are two things from Table 1 that should be elucidated. Firstly, a random slope (βij1 + βij2) coupled with an opposite-signed city-specific fixed effect (βo + βj) in Table 1 tells us that in a particular city, the within-tract increase/decrease of ridership is higher for a tract closer to CBD. Secondly, a significant interaction effect with an insignificant main effect tells us that the DV and city-specific dummies’ relation entirely depends on the distCBD. Considering the sign and significance, this study, with few exceptions, explores a consistent pattern in cities popular for biking (DC, Boston, Portland). That is, when biking fell-off, it decreased more remarkably in the areas closer to the CBD. Reversely, when a city was revitalized with cycling, the reinforcement was quicker again in central tracts than the peripheral parts. Chai et al. (2020) found a similar finding in Beijing. The car-oriented cities (Columbus and Pittsburgh), however, lacks the statistical power to reach this consensus in most of the months.
While there is a growing body of literature suggesting that reduced mobility helps block COVID-19 (Jiang and Luo 2020; Badr et al. 2020; Chinazzi et al. 2020; Cartenì, Di Francesco, and Martino 2020), the effect of bike-mobility is not widely explored. Table 2 represents Pearson’s correlation coefficients of weekly bike-share trips and the seven metrics mentioned in the method section. Weekly bike-share trips, revealing no relation with work trip rates, show highly positive associations with a city’s non-work trip rates (except Columbus). This finding suggests the overwhelming use of bike-share for non-commuting trips. It is also intuitive that biking dropped significantly (except Columbus) when more people stayed at home and maintained social distance. Surprisingly, working from home did not show any significant correlation with usage. A higher rate of cycling generally came up with an increase in COVID exposure. While Boston and DC had a significant drop in cycling with the increase of daily new cases, a counterintuitive finding was significant in Portland for biking at the weekend. The distinctive biking pattern in Columbus revealed in every part of this study expresses the need to conduct a separate exclusive study on it.
Some limitations of this study should be noted. Firstly, understanding six models might be cumbersome for readers and a single model handling temporal and spatial heterogeneity would be more graspable. Secondly, aggregating the bikeshare usage by weeks offered us small and statistically weak sample size (n=26) for Pearson correlation test. Despite all, this research’s simplistic design allows readers to gain a comprehensive and general understanding of the issues discussed. Deploying advanced modeling techniques, future studies can look into local factors including land use, closure and reopening of different services, and transit agency policies.
ACKNOWLEDGMENTS
I want to thank the two anonymous reviewers for their constructive comments that substantially helped to shape the manuscript. I am also grateful to Shefa Arabia, Brittany Jones, Rebekka Apardian, and Olivia Zolciak for their helpful suggestions.