Research Question & Hypothesis
Inferences from crash frequency models are crucial to roadway geometric design and depend on crash datasets. We examine the effect of imputing missing data for Average Annual Daily Traffic (AADT) on inferences derived from these models. We choose AADT as there are existing methods used to impute AADT when it is not available (Mohamad et al. 1998). Collection of AADT is dependent on traffic counts, which might not always be collected, while geometric features of a road need only be collected once (as these tend not to change much). Most engineering studies aim to correlate crash outcomes with geometric measures and the Highway Safety Manual (2010) specifies this as a way to determine Crash Modification Factors (CMFs) used in cost/benefit analysis of road safety measures. We show that imputation of AADT may lead to incorrect inferences. Our hypothesis is that missing data and analyst decisions on how to process and estimate models can lead to results that may be incorrect.
We focus on missing AADT data since traffic volumes tend to be highly correlated with crashes. While other estimation and measurement problems are abundant in road safety research, our aim is to focus on just this one variable. Another frequent problem is omitted variable bias which can also distort estimates and has been examined in detail (Noland and Adediji 2018; Mitra and Washington 2012). Omitted variable bias occurs when unmeasured variables that affect crashes are not available or are excluded due to analyst decisions. These decisions, including imputation of missing values, all have the potential to change modeling results substantially.
Methods and Data
Data from the Highway Safety Information System (HSIS) was used for the state of North Carolina. This database is administered by the University of North Carolina Highway Safety Research Center (HSRC) and the Federal Highway Administration (FHWA). The HSIS data is considered to be of better quality than most state crash datasets, since it is re-processed centrally at HSIS labs after collection by police departments and subsequent processing by state Departments of Transportation (Fitzgerald 2014, FHWA 2016). This is important because our goal was to isolate the effect of missing data without worrying about issues of data quality.
We focused on interstate highways because data for this category was the most complete and the least skewed. There were 1944 km (1208 miles) and 8071 segments with AADT data and the geometric variables available included pavement width, lane count, median width and shoulder width. We calculated sinuosity, a measure of curvature for each segment by dividing the straight line distance by the actual segment length. Values close to zero are curvy while values close to one represent straighter road segments. The dependent variables in our models were total crashes and fatal and incapacitating injury crashes and were summed for each segment, for the years 2009 to 2013. Summary statistics are in Table 1.
Models were estimated with negative binomial conditional autoregressive models using CrimeStat software (Levine, Lord, and Park 2010) to control for spatial correlation (Lord and Mannering 2010). These models are estimated using Markov Chain Monte Carlo estimation (MCMC), a Bayesian technique. They produce credible intervals that show the probability that a coefficient is within a given range, as distinct from a confidence interval that represents the percent of times that a sample drawn from a population will be within a given confidence interval.
We first estimated standard CMF models for all crashes and then fatal and incapacitating injury crashes with road segments as the unit of analysis. The first models used actual reported AADT data. We then randomly removed 10%, 30%, 50%, and 70% of the AADT values, imputed them and re-estimated the models, using an approach suggested by Mohamad et al. (1998). This imputation approach used an ordinary least squares regression to predict AADT for the missing values. Vehicle Kilometers Traveled (VKT) is used in all the models and derived by multiplying AADT by the segment length.
Findings
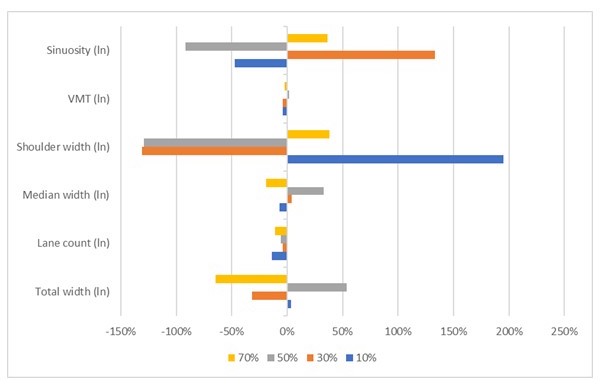
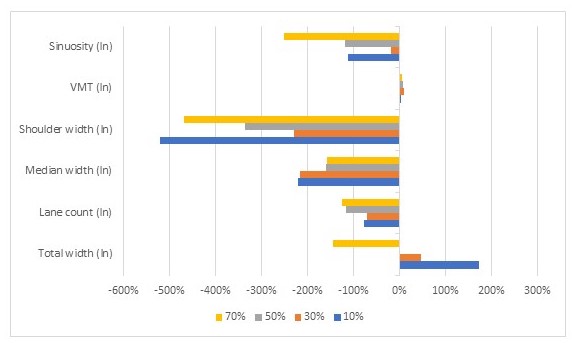
Full model estimates are shown in the supplemental material. We present differences in coefficient estimates compared to the base model with the full dataset and no imputation. Table 2 displays the percent difference in median coefficient estimates from the base model for total crashes with each imputed estimate. This is displayed graphically in Figure 1. For fatal and incapacitating crashes, results are in Table 3 and Figure 2.

Figure 1 shows that the largest differences from the base model occur when AADT is imputed for 10% and 30% of the dataset. The smallest variation occurs when AADT is imputed at 70%. This is contrary to expectations since the 10% and 30% datasets are more similar to the base dataset than the 50% and 70% datasets. The coefficient for VKT, based on imputed values, has the smallest difference, thus the main impact of imputation is on other coefficients.

Figure 2 shows that the largest differences from the base model occur when AADT is imputed for 10% and 70% of the dataset. The smallest variation occurs when AADT is imputed for 30% and 50%. This is contrary to expectations since the 10% dataset is most similar to the base dataset. In this case, the change in other coefficients is generally in the same direction (except for the coefficient on total width); again VKT shows the least variation between models.
These results highlight the problem of imputing missing data and indicate that analyst decisions to work around the problem may lead to large variation in the coefficient values.
The mixed results raise questions about basing road safety treatments on inferences from models potentially affected by missing data. Missing and erroneous data points are common features of crash datasets and measurement error is easily introduced when analysts address these issues using various discretionary measures (Schlögl and Stütz 2017). Some of our credible intervals are also quite large (see supplemental material).
These results differ from those of an FHWA study estimating measurement error by comparing AADT estimates with no missing days, to estimates with 1 to 60 missing days. The maximum bias found was 0.30% with a dataset with 60 days of missing data (Krile et al. 2016). The simulated missing data for the FHWA study was only 16% of their dataset. We find large variations even for 10% imputation of the data.
Our research shows that imputation decisions are likely to substantially influence results. While we present no solutions to this problem, awareness can encourage better data collection practices, and urge caution in using imputed data.