This website uses cookies

We use cookies to enhance your experience and support COUNTER Metrics for transparent reporting of readership statistics. Cookie data is not sold to third parties or used for marketing purposes.

Skip to main content
null
Findings
  • Menu
  • Articles
    • Energy Findings
    • Resilience Findings
    • Safety Findings
    • Transport Findings
    • Urban Findings
    • All
  • For Authors
  • Editorial Board
  • About
  • Blog
  • search
  • X (formerly Twitter) (opens in a new tab)
  • LinkedIn (opens in a new tab)
  • RSS feed (opens a modal with a link to feed)

RSS Feed

Enter the URL below into your favorite RSS reader.

https://findingspress.org/feed
ISSN 2652-8800
Transport Findings
November 18, 2026 AEST

Assessing Bicycle Parking Infrastructure: A Townwide Study in Lexington, Massachusetts

Maxwell Mandell,
bicycle parkingcycle parkingparking inventoryrack conditionmunicipal infrastructureactive transportation
Copyright Logoccby-sa-4.0 • https://doi.org/10.32866/001c.173513
Findings
Mandell, Maxwell. 2026. “Assessing Bicycle Parking Infrastructure: A Townwide Study in Lexington, Massachusetts.” Findings, November 17. https://doi.org/10.32866/001c.173513.
Save article as...▾
Download all (5)
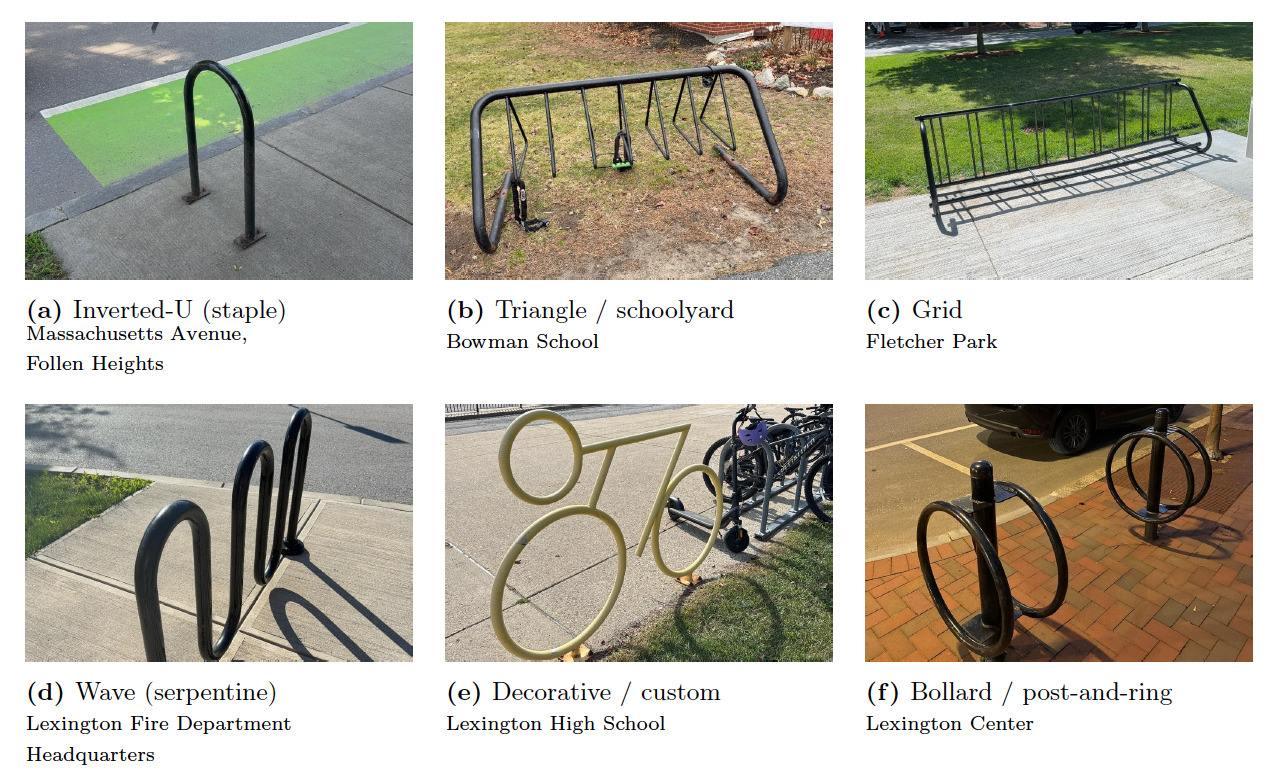
  • Fig. 1. The six rack types recorded in the survey, each shown with an example from Town of Lexington property. Photographs by the author.
    Download
  • Fig. 2. Bicycle rack capacity in Lexington, Massachusetts. Circle area is proportional to the number of spaces at each rack. Sources: road network and water, © OpenStreetMap contributors, Open Database License (OpenStreetMap contributors 2026); town boundary, MassGIS Census 2020 Towns (MassGIS 2020); bicycle network, MassDOT Bicycle Facility Inventory (Massachusetts Department of Transportation, n.d.).
    Download
  • Fig. 3. Bicycle parking in Lexington, Massachusetts, by setting. Sources: road network and water, © OpenStreetMap contributors, Open Database License (OpenStreetMap contributors 2026); town boundary, MassGIS Census 2020 Towns (MassGIS 2020); bicycle network, MassDOT Bicycle Facility Inventory (Massachusetts Department of Transportation, n.d.).
    Download
  • Supplemental files
    Download
  • Supplemental CSV
    Download

Error

Sorry, something went wrong. Please try again.

If this problem reoccurs, please contact Scholastica Support

Error message:

undefined

View more stats

Abstract

Bicycle parking has been added to municipal property in Lexington, Massachusetts, over many years, but no inventory existed. We located every bicycle rack on town property and recorded its rack type, capacity, and condition. The survey found 99 racks holding 1,134 spaces across 41 sites. Capacity was concentrated at a few sites, with the ten largest holding 71 percent of all spaces and schools alone holding 65 percent. At the nine K-12 public schools, parking ranged from 7.6 to 25.1 spaces per 100 students. Inverted-U racks were the most common type, but grid and schoolyard racks held more spaces.

1. Questions

Bicycle parking is a key component of effective cycling systems and urban planning (Egan et al. 2023; Honey-Rosés et al. 2023). However, many studies focus only on whether bicycle parking was present or absent without accounting for the quality of parking (Heinen and Buehler 2019). Inadequate parking can leave bicycles exposed to theft and damage, and can deter people from cycling (Chen et al. 2018; Cohen et al. 2024). To address this, we recorded rack type, capacity, and condition of bicycle parking in addition to location. Studies also commonly focus on transit stations or workplaces, while fewer studies cover bicycle parking across entire municipalities (Ito et al. 2023; Honey-Rosés et al. 2023; Heinen and Buehler 2019). This study examines bicycle parking across all town-owned property in Lexington, Massachusetts. Lexington contains established bicycle infrastructure including the Minuteman Bikeway that connects to Alewife station in Cambridge, and the town supports bike travel through the Safe Routes to School Program (Minuteman Bikeway, n.d.; Town of Lexington, n.d.). Bicycle parking has been added to town property over many years, but no inventory existed of what was installed, where, or in what condition.

We ask: How do the capacity, condition, rack type, and location of bicycle parking vary across town-owned sites in Lexington, Massachusetts?

2. Methods

A field survey of bicycle parking on Town of Lexington property was conducted from September 8, 2025, to July 2, 2026. Every bicycle rack was located and recorded using ArcGIS Survey123, a mobile application that logged the position of each rack. Survey data was compiled and analyzed in Excel, and maps were created in ArcGIS Pro.

The survey covered schools, parks, conservation land, civic buildings, the Minuteman Bikeway, town trails, and the public right-of-way along streets. Racks on private property, including businesses, apartment buildings, and private schools, were not surveyed. Town-owned parcels were identified from the Massachusetts Property Tax Parcels data layer (MassGIS 2025). Every parcel was visited, and those with no rack were recorded as such.

For each rack, the rack type, capacity, and condition were recorded. A rack was defined as one freestanding unit, or a group of units of the same type in the same spot. Where two rack types existed in the same spot, each was recorded separately.

As shown in Figure 1, rack type was divided into six categories: inverted-U, triangle/schoolyard, grid, wave, decorative/custom, and bollard/post-and-ring. Capacity was counted as two bikes for each element of a rack and one bike per slot on grid racks. Note S3 describes the rule for each type. Total capacity, rounded mean capacity, and number of racks were reported by type.
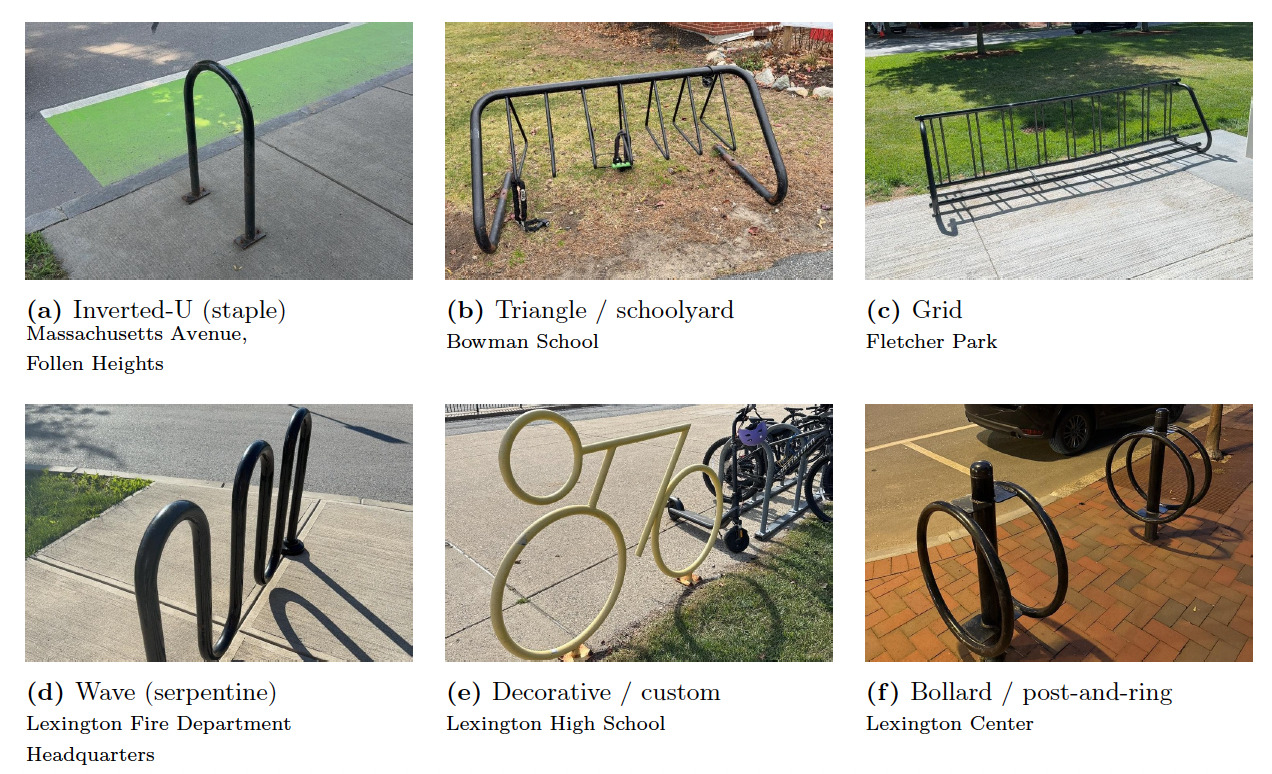
Fig. 1
Fig. 1.The six rack types recorded in the survey, each shown with an example from Town of Lexington property. Photographs by the author.

Racks were rated on four criteria: whether the rack was bent, whether the metal was sound, whether it could be reached without obstruction, and whether a bike could be locked to it. Each criterion was rated as good, fair, or poor. The overall condition of the rack was the lowest of the four ratings. Note S4 describes how the ratings were determined. The number of racks in each condition was reported.

The racks were grouped by the nearest place they served. Racks that did not serve a specific place were assigned to the street or trail where they were located. Racks at multi-rack sites were numbered north to south. Racks and capacity at multi-rack sites are reported in Table S1.

Each site was assigned one of five settings: schools, parks and open space, civic buildings, streets, and bikeway and trails. The number of sites, racks, and total spaces were reported by setting.

Capacity per 100 students was calculated for each of the nine K-12 public schools in Lexington, Massachusetts. Enrollment data for 2025–26 was obtained from the Massachusetts Department of Elementary and Secondary Education (2025).

The inventory is provided in Table S2 and a supplementary CSV, and mapped on the town website (Town of Lexington 2026).

3. Findings

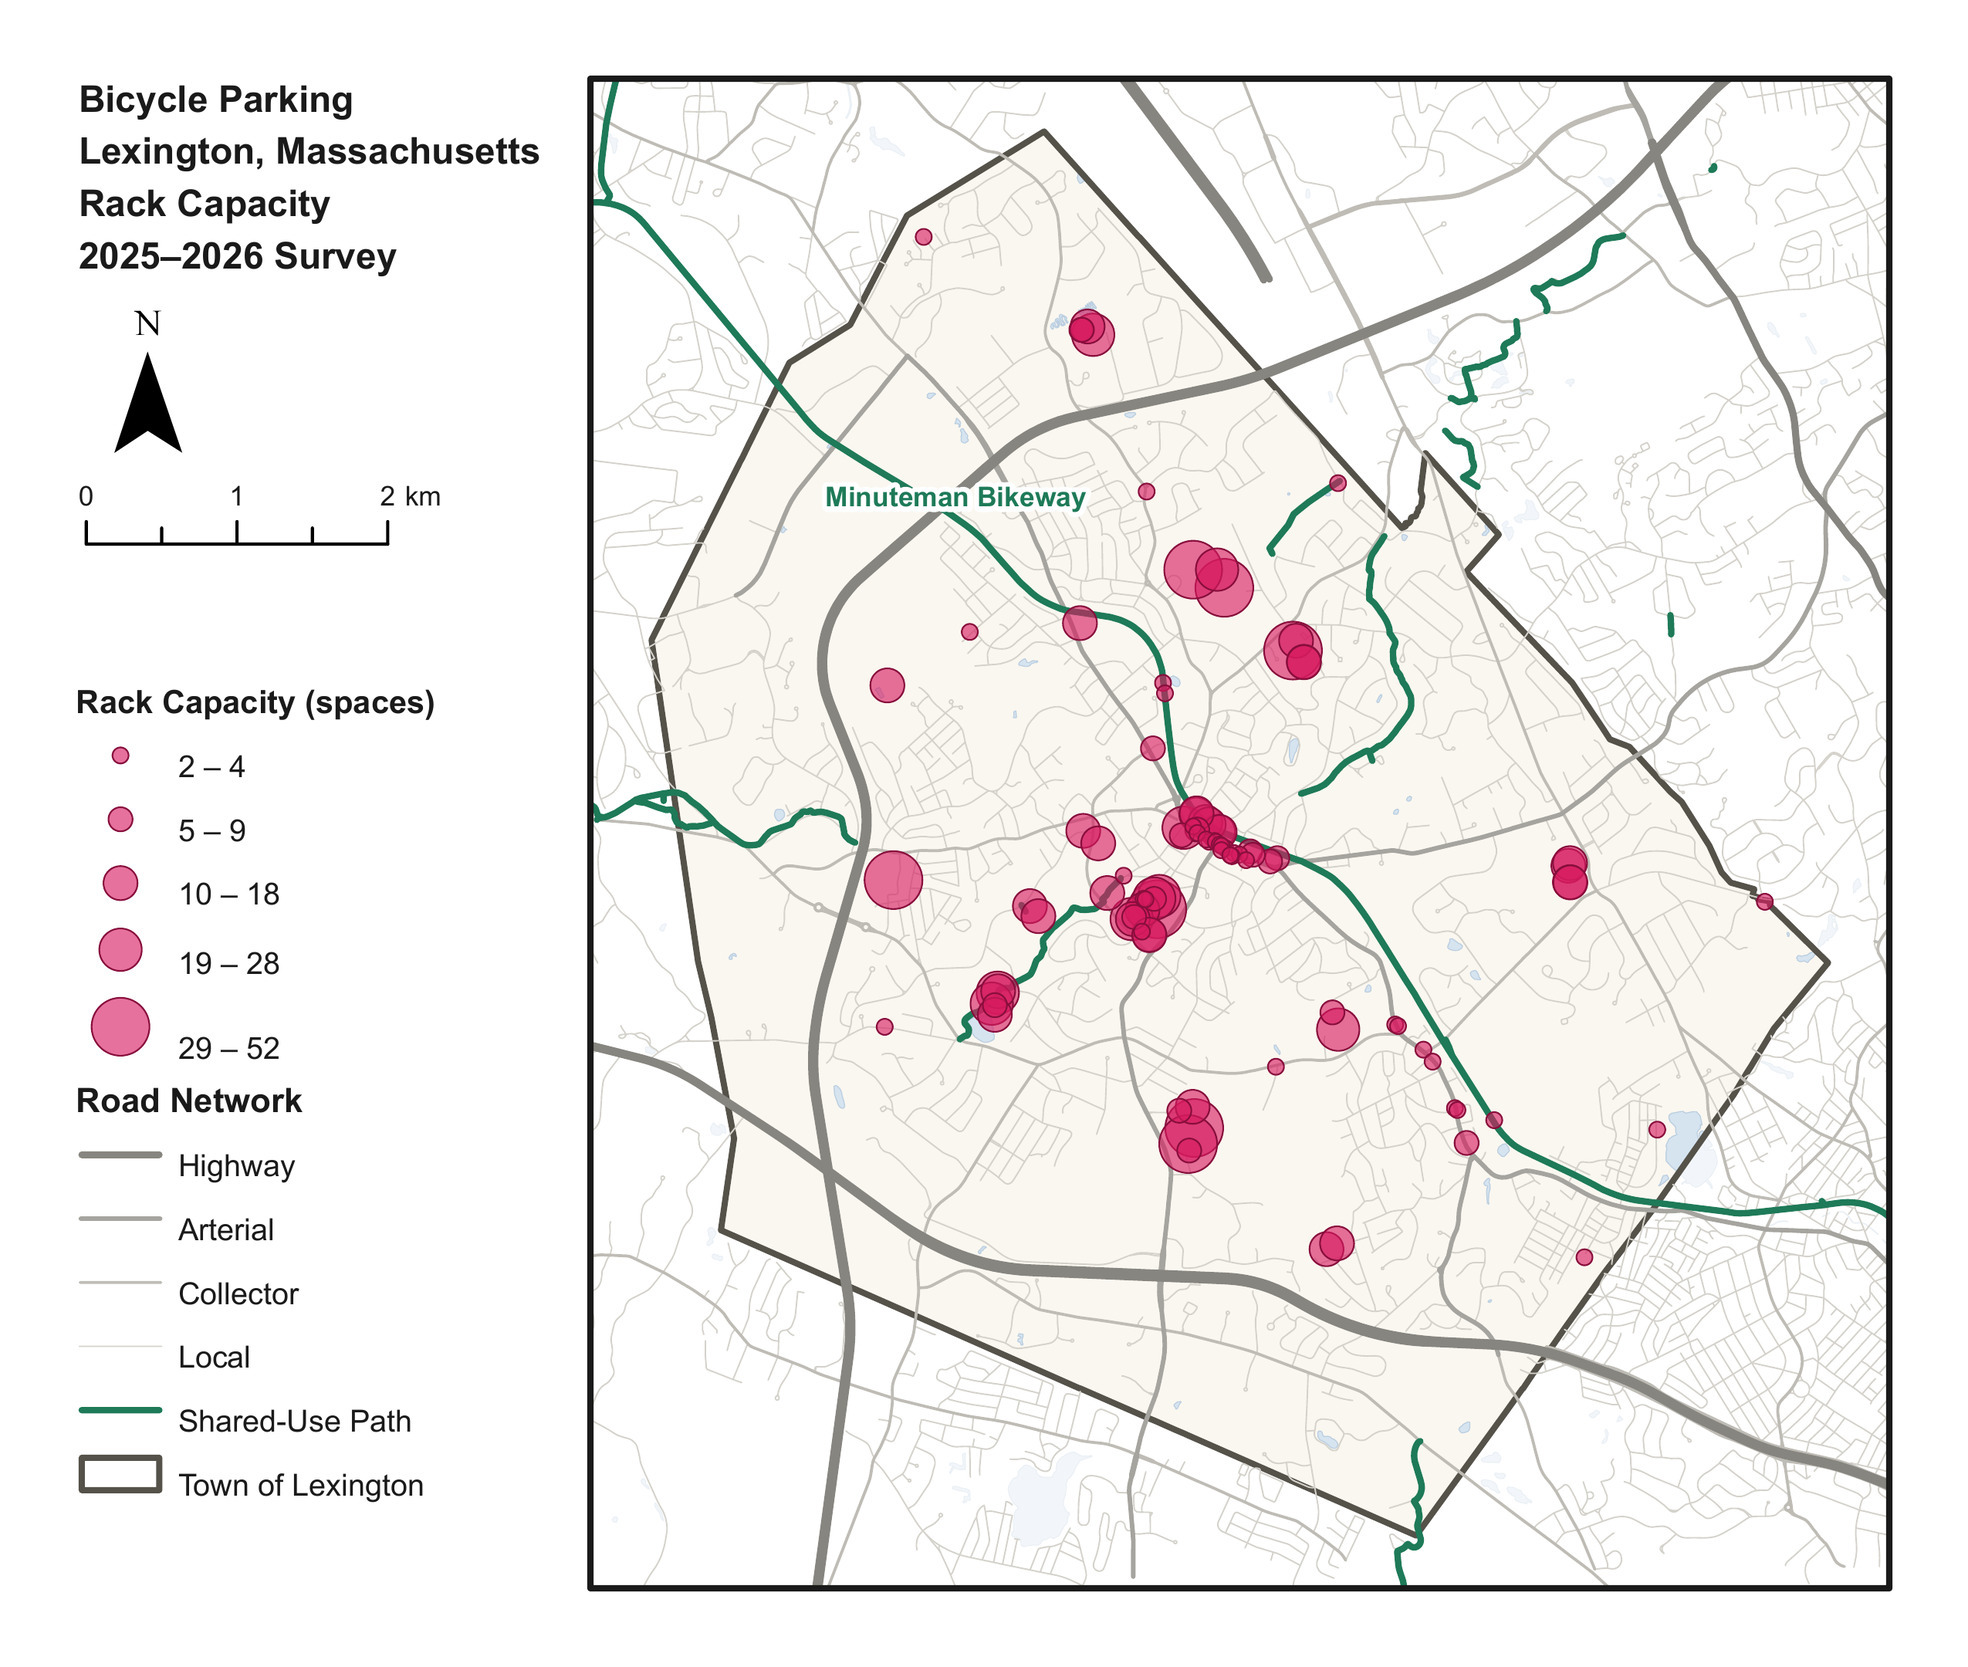
Figure 2 displays the location of bike racks and their capacity.
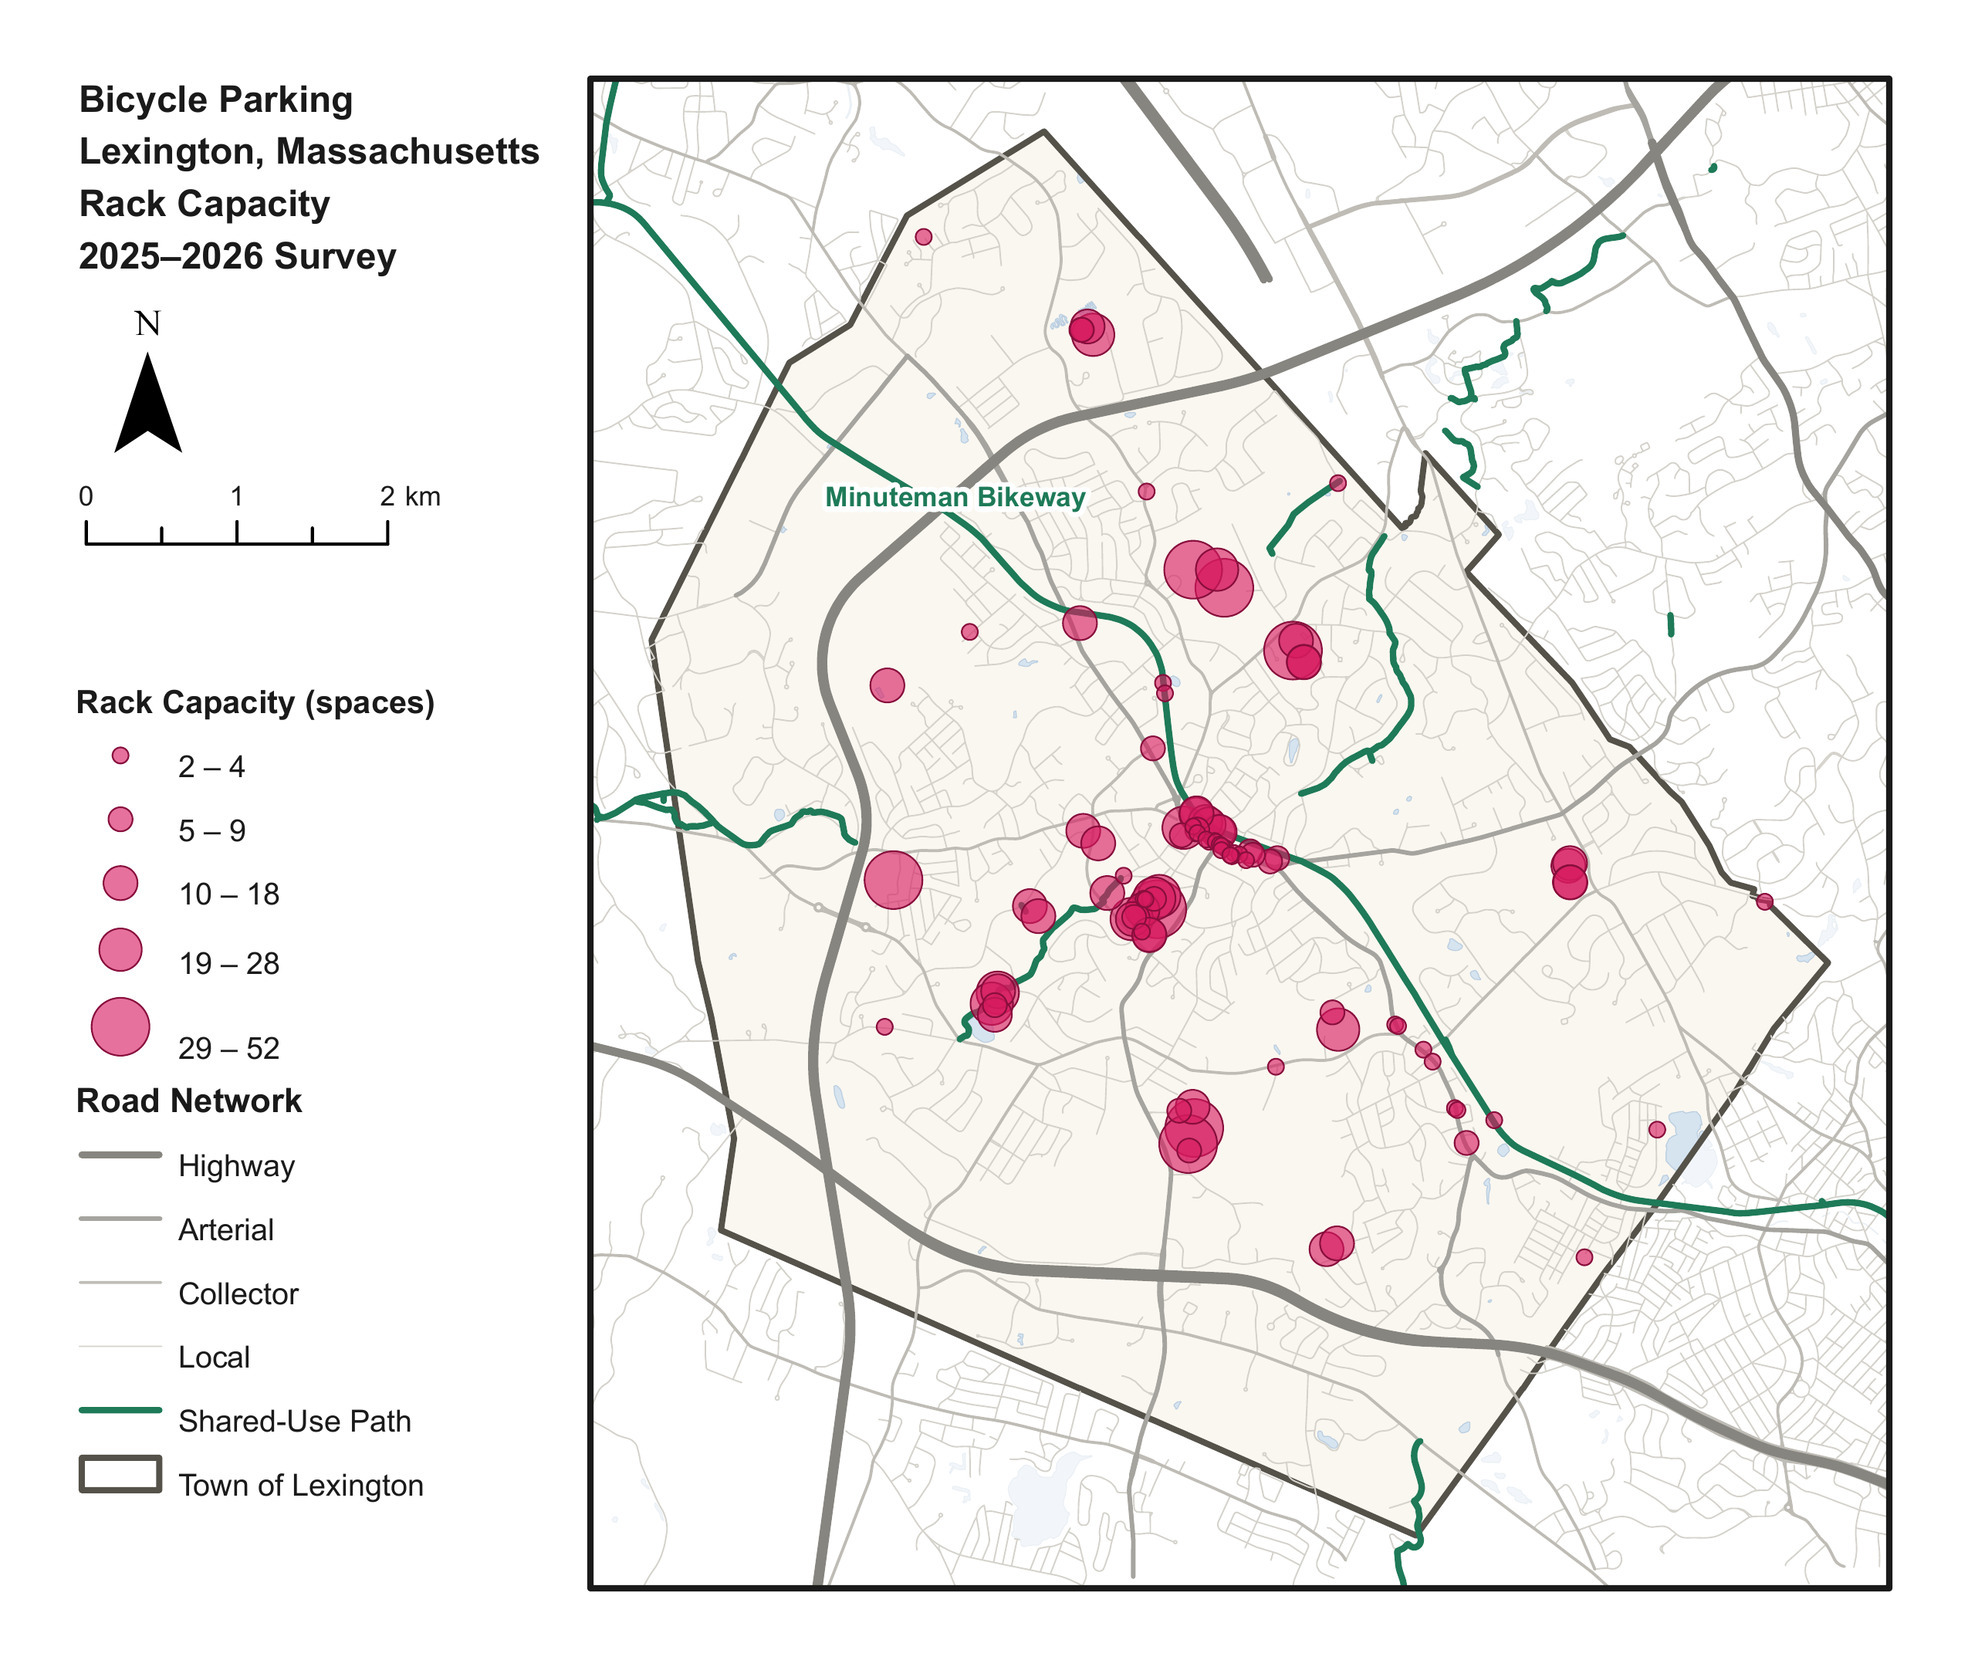
Fig. 2
Fig. 2.Bicycle rack capacity in Lexington, Massachusetts. Circle area is proportional to the number of spaces at each rack. Sources: road network and water, © OpenStreetMap contributors, Open Database License (OpenStreetMap contributors 2026); town boundary, MassGIS Census 2020 Towns (MassGIS 2020); bicycle network, MassDOT Bicycle Facility Inventory (Massachusetts Department of Transportation, n.d.).

Capacity was concentrated within the area bounded by Route 128 and Route 2, and clustered around Lexington Center. Most bike racks were close to shared-use paths or the Minuteman Bikeway. However, several high-capacity racks were in the town periphery at schools without nearby shared-use paths.

Table 1 shows the number of racks and total spaces by type.

Table 1.Bicycle rack counts, capacity, and counting rules by rack type.
Rack type Capacity rule (spaces) Racks Spaces Share of spaces Mean spaces per rack
Inverted-U (staple) 2 per hoop 45 432 38% 10
Triangle / schoolyard 2 per triangle element 23 300 26% 13
Grid 1 per slot 15 256 23% 17
Wave 2 per bend 5 86 8% 17
Decorative / custom 2 per lockable loop 3 32 3% 11
Bollard / post-and-ring 2 per ring 8 28 2% 4
Total — 99 1,134 100% 11

Inverted-U racks made up nearly half of the 99 racks but held only 38 percent of the spaces. Grid and schoolyard racks were 38 of the 99 but held 49 percent of the spaces.

Table 2 shows bike parking by setting.

Table 2.Bike parking by setting.
Setting Sites Racks Spaces Share of spaces Mean spaces per site
Schools 10 41 739 65% 74
Parks and open space 19 24 150 13% 8
Civic buildings 7 9 106 9% 15
Bikeway and trails 1 7 76 7% 76
Streets 4 18 63 6% 16
Total 41 99 1,134 100% 28

Capacity was concentrated at a few sites. The ten largest of the 41 sites held 71 percent of spaces, while the 24 sites with a single rack held 233 spaces, or 21 percent. More sites in a setting did not correspond to more parking. Parks and open space was the most common setting, with 19 of the 41 sites, but most had only one or two racks, and together they held 13 percent of spaces. There were fewer school sites, yet each usually had several large racks. Schools averaged 74 spaces per site, while parks and open space averaged 8. Most of the highest-capacity racks were on school grounds.

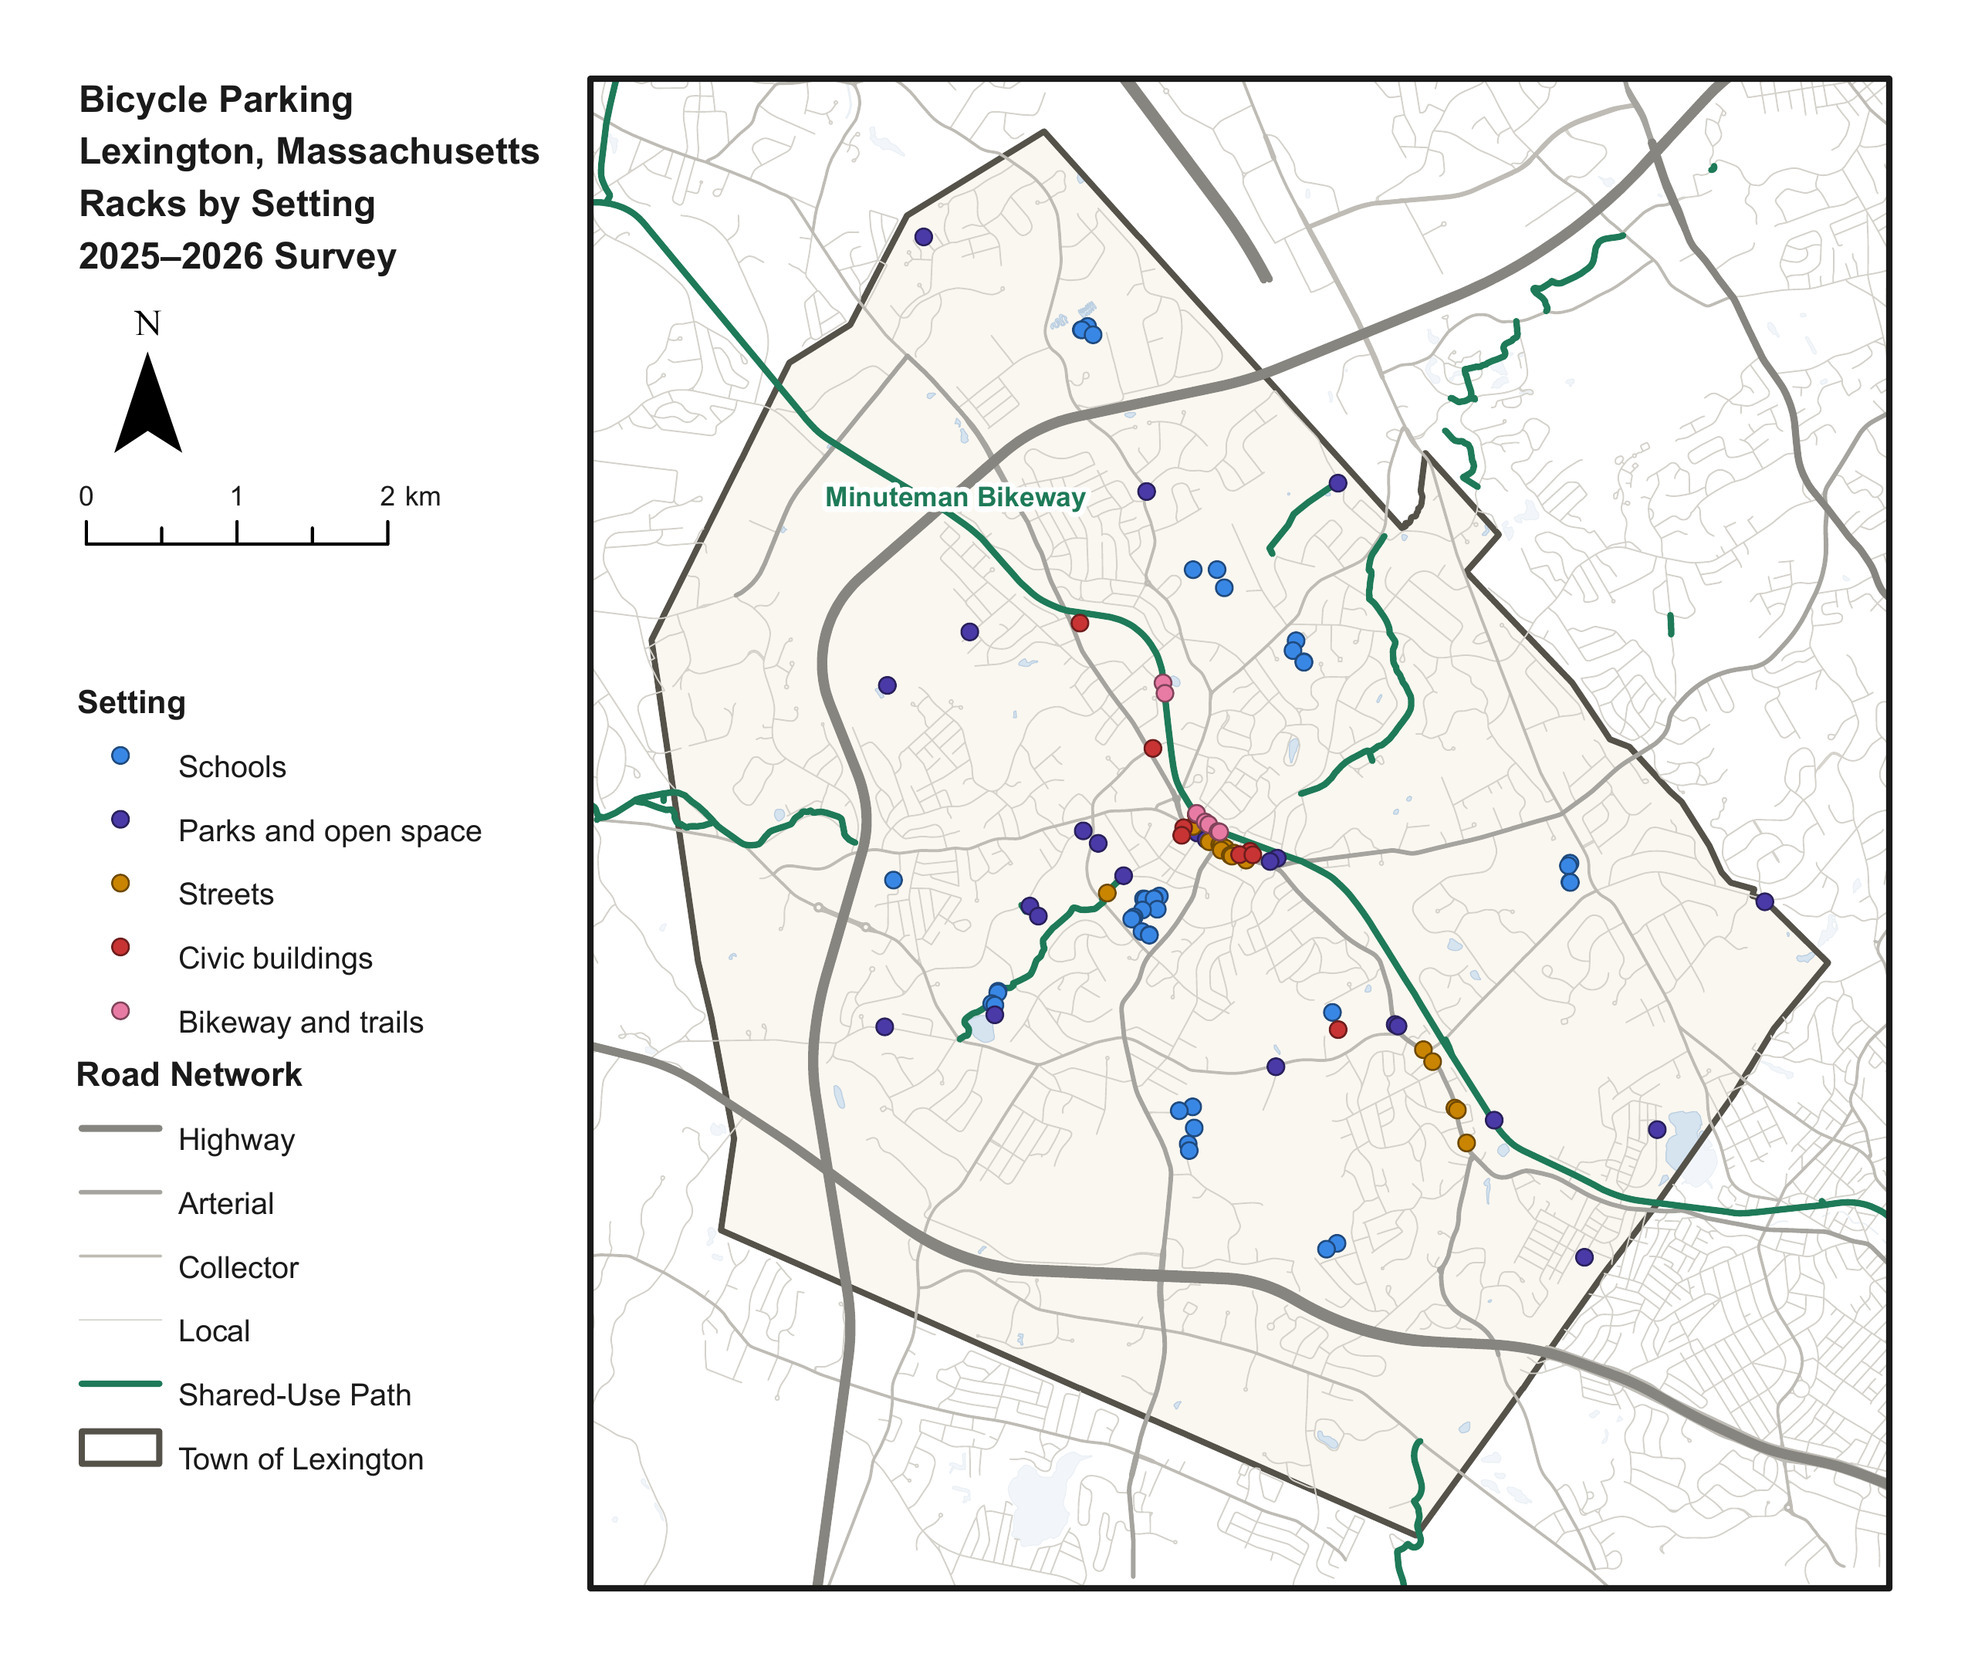
Figure 3 maps bicycle parking by setting.
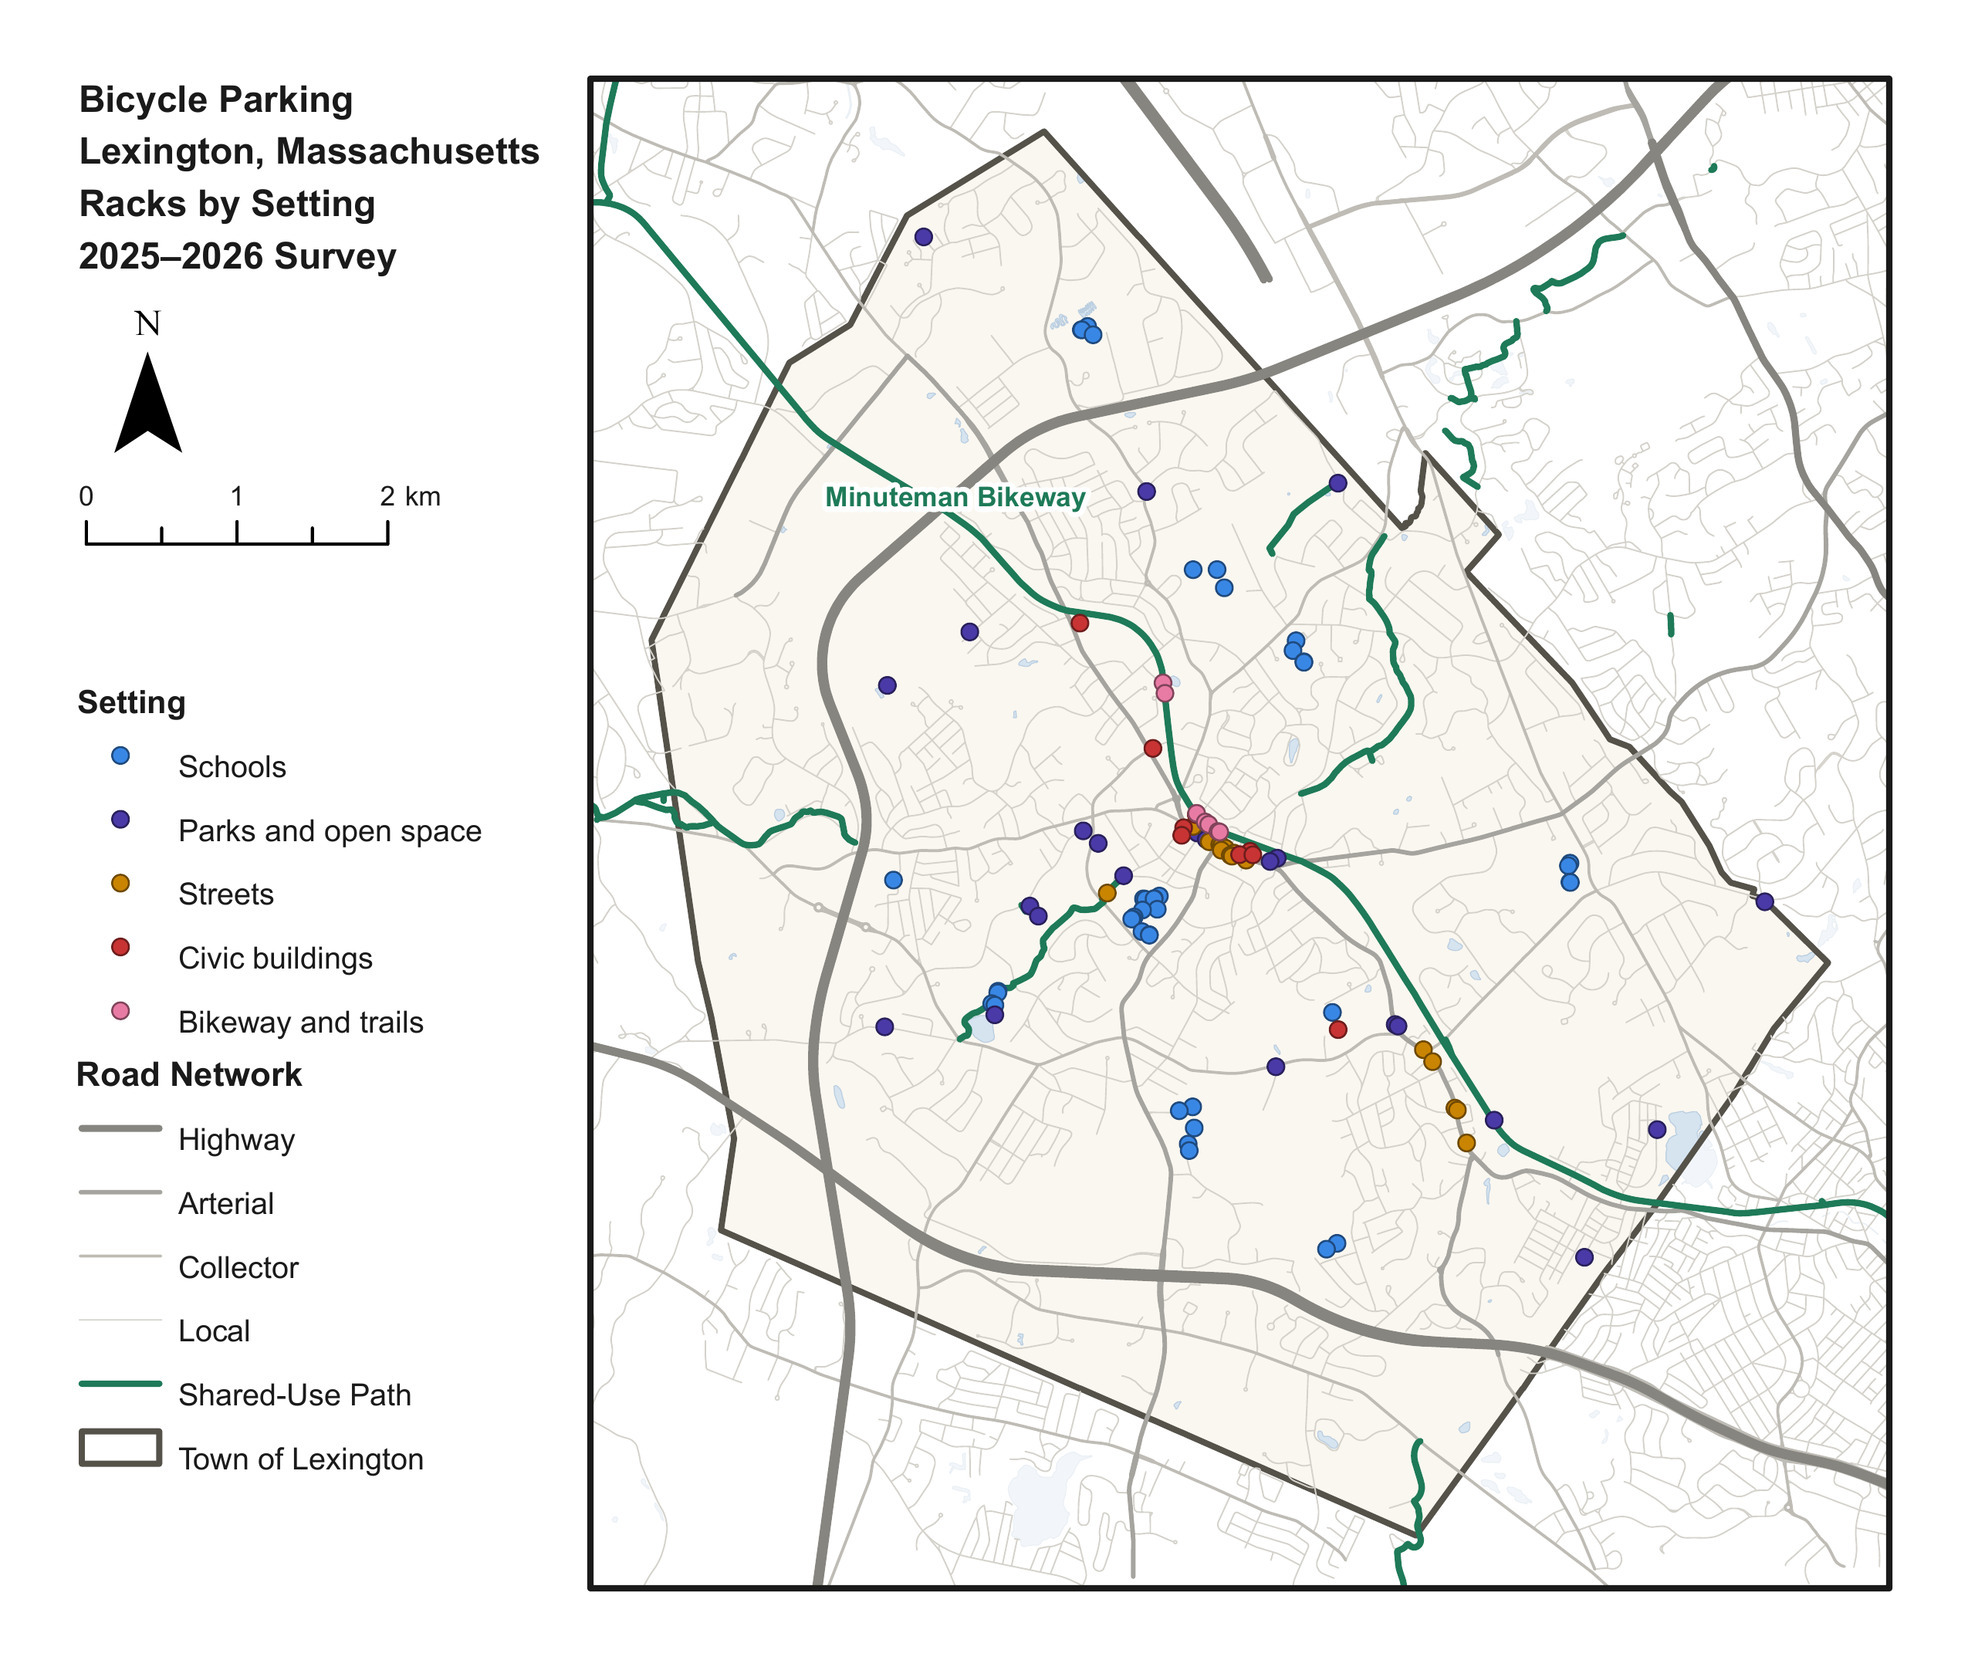
Fig. 3
Fig. 3.Bicycle parking in Lexington, Massachusetts, by setting. Sources: road network and water, © OpenStreetMap contributors, Open Database License (OpenStreetMap contributors 2026); town boundary, MassGIS Census 2020 Towns (MassGIS 2020); bicycle network, MassDOT Bicycle Facility Inventory (Massachusetts Department of Transportation, n.d.).

Schools held nearly two-thirds of bike parking. Table 3 compares each school’s capacity with its enrollment.

Table 3.Bike parking at each school compared to enrollment. Lexington Children’s Place, a public preschool with 8 spaces, is not included.
School Spaces Students Per 100 students
Fiske School 70 279 25.1
Bridge School 67 348 19.3
Harrington School 52 363 14.3
Jonas Clarke Middle School 111 785 14.1
Joseph Estabrook School 56 467 12.0
William Diamond Middle School 105 907 11.6
Maria Hastings School 48 538 8.9
Lexington High School 190 2,348 8.1
Bowman School 32 421 7.6
All nine schools 731 6,456 11.3

Lexington High School had more bike parking spaces than any other site and the second fewest per 100 students. The three schools with the most parking per 100 students were all elementary schools.

Of the 99 racks, 88 were in good condition, 7 were fair, and 4 were poor. The four poor racks were all grid or schoolyard racks, and they held 72 of the 1,134 spaces.

There is now a record of the location, type, capacity, and condition of bicycle parking on municipal property. However, the survey did not measure how much of the parking supply is used. The approach could serve as a framework for other towns and future surveys and analysis of bicycle parking.


Acknowledgments

Thank you to Ben Alperovich, Rhys Behling, Jayant Krishnan, and Molly Eriksson for helping collect the survey data and to Joshua King for his support and advice throughout the research. Anthropic’s Claude was used to edit the manuscript for grammar and clarity. The author takes full responsibility for the content of the publication. This research received no funding, and the author declares no conflict of interest.

Submitted: September 23, 2026 AEST

Accepted: November 03, 2026 AEST

References

Chen, Peng, Qian Liu, and Feiyang Sun. 2018. “Bicycle Parking Security and Built Environments.” Transportation Research Part D: Transport and Environment 62: 169–78. https:/​/​doi.org/​10.1016/​j.trd.2018.02.020.
Google Scholar
Cohen, Achituv, Trisalyn Nelson, Moreno Zanotto, et al. 2024. “The Impact of Bicycle Theft on Ridership Behavior.” International Journal of Sustainable Transportation 18 (5): 453–63. https:/​/​doi.org/​10.1080/​15568318.2024.2350946.
Google Scholar
Egan, Robert, Conor Mark Dowling, and Brian Caulfield. 2023. “Exploring the Elements of Effective Public Cycle Parking: A Literature Review.” Journal of Urban Mobility 3: 100046. https:/​/​doi.org/​10.1016/​j.urbmob.2023.100046.
Google Scholar
Heinen, Eva, and Ralph Buehler. 2019. “Bicycle Parking: A Systematic Review of Scientific Literature on Parking Behaviour, Parking Preferences, and Their Influence on Cycling and Travel Behaviour.” Transport Reviews 39 (5): 630–56. https:/​/​doi.org/​10.1080/​01441647.2019.1590477.
Google Scholar
Honey-Rosés, Jordi, Vanesa Ortega, Simon Dejaegher, and Esteve Corbera. 2023. “Bicycle Parking Use Patterns, Occupancy and Rotation Rates in the Streets of Barcelona.” Active Travel Studies 3 (2): 1392. https:/​/​doi.org/​10.16997/​ats.1392.
Google Scholar
Ito, Yuhei, Malcolm Morgan, and Robin Lovelace. 2023. “Where to Invest in Cycle Parking: A Portfolio Management Approach to Spatial Transport Planning.” Environment and Planning B: Urban Analytics and City Science 50 (6): 1438–54. https:/​/​doi.org/​10.1177/​23998083221138575.
Google Scholar
Massachusetts Department of Elementary and Secondary Education. 2025. “2025–26 Enrollment by Grade Report (District).” https:/​/​profiles.doe.mass.edu/​statereport/​enrollmentbygrade.aspx.
Massachusetts Department of Transportation. n.d. “Bicycle Facility Inventory.” Layer 0. Office of Transportation Planning. Accessed September 20, 2026. https:/​/​gis.massdot.state.ma.us/​arcgis/​rest/​services/​Multimodal/​BikeInventory/​MapServer/​0.
MassGIS. 2020. “Census 2020 Towns.” Bureau of Geographic Information, Executive Office of Technology Services and Security, Commonwealth of Massachusetts; derived from US Census Bureau TIGER/Line 2020 county subdivisions. https://arcgisserver.digital.mass.gov/arcgisserver/rest/services/AGOL/Census2020_Towns/MapServer/2.
MassGIS. 2025. “MassGIS Data: Property Tax Parcels.” Bureau of Geographic Information, Executive Office of Technology Services and Security, Commonwealth of Massachusetts. https:/​/​www.mass.gov/​info-details/​massgis-data-property-tax-parcels.
Minuteman Bikeway. n.d. “Minuteman Bikeway: America’s Revolutionary Rail-Trail.” https:/​/​minutemanbikeway.org.
OpenStreetMap contributors. 2026. “OpenStreetMap.” Open Database License (ODbL). https:/​/​www.openstreetmap.org/​copyright.
Town of Lexington. 2026. Lexington Bike Racks. Google My Maps. https:/​/​www.google.com/​maps/​d/​viewer?mid=1VWTN9c1PFftr_JxpCDi1ORWjcU4W4q4.
Town of Lexington. n.d. “Safe Routes to School.” Transportation Services. Accessed September 20, 2026. https:/​/​lexingtonma.gov/​707/​Safe-Routes-to-School.

Attachments

Powered by Scholastica, the modern academic journal management system