This website uses cookies

We use cookies to enhance your experience and support COUNTER Metrics for transparent reporting of readership statistics. Cookie data is not sold to third parties or used for marketing purposes.

Skip to main content
null
Findings
  • Menu
  • Articles
    • Energy Findings
    • Resilience Findings
    • Safety Findings
    • Transport Findings
    • Urban Findings
    • All
  • For Authors
  • Editorial Board
  • About
  • Blog
  • search
  • X (formerly Twitter) (opens in a new tab)
  • LinkedIn (opens in a new tab)
  • RSS feed (opens a modal with a link to feed)

RSS Feed

Enter the URL below into your favorite RSS reader.

https://findingspress.org/feed
ISSN 2652-8800
Transport Findings
November 10, 2026 AEST

How do Municipal Employees Travel for Work Errands? Evidence from Athens, Greece

Alexandros Bartzokas-Tsiompras, Ph.D., M.Sc., M.Eng.,
work-related travelbusiness travelwalking distancemode choicepublic sector employeesworkplace mobility managementpublic transportGreece
Copyright Logoccby-sa-4.0 • https://doi.org/10.32866/001c.173014
Findings
Bartzokas-Tsiompras, Alexandros. 2026. “How Do Municipal Employees Travel for Work Errands? Evidence from Athens, Greece.” Findings, November 9. https://doi.org/10.32866/001c.173014.
Save article as...▾
Download all (7)
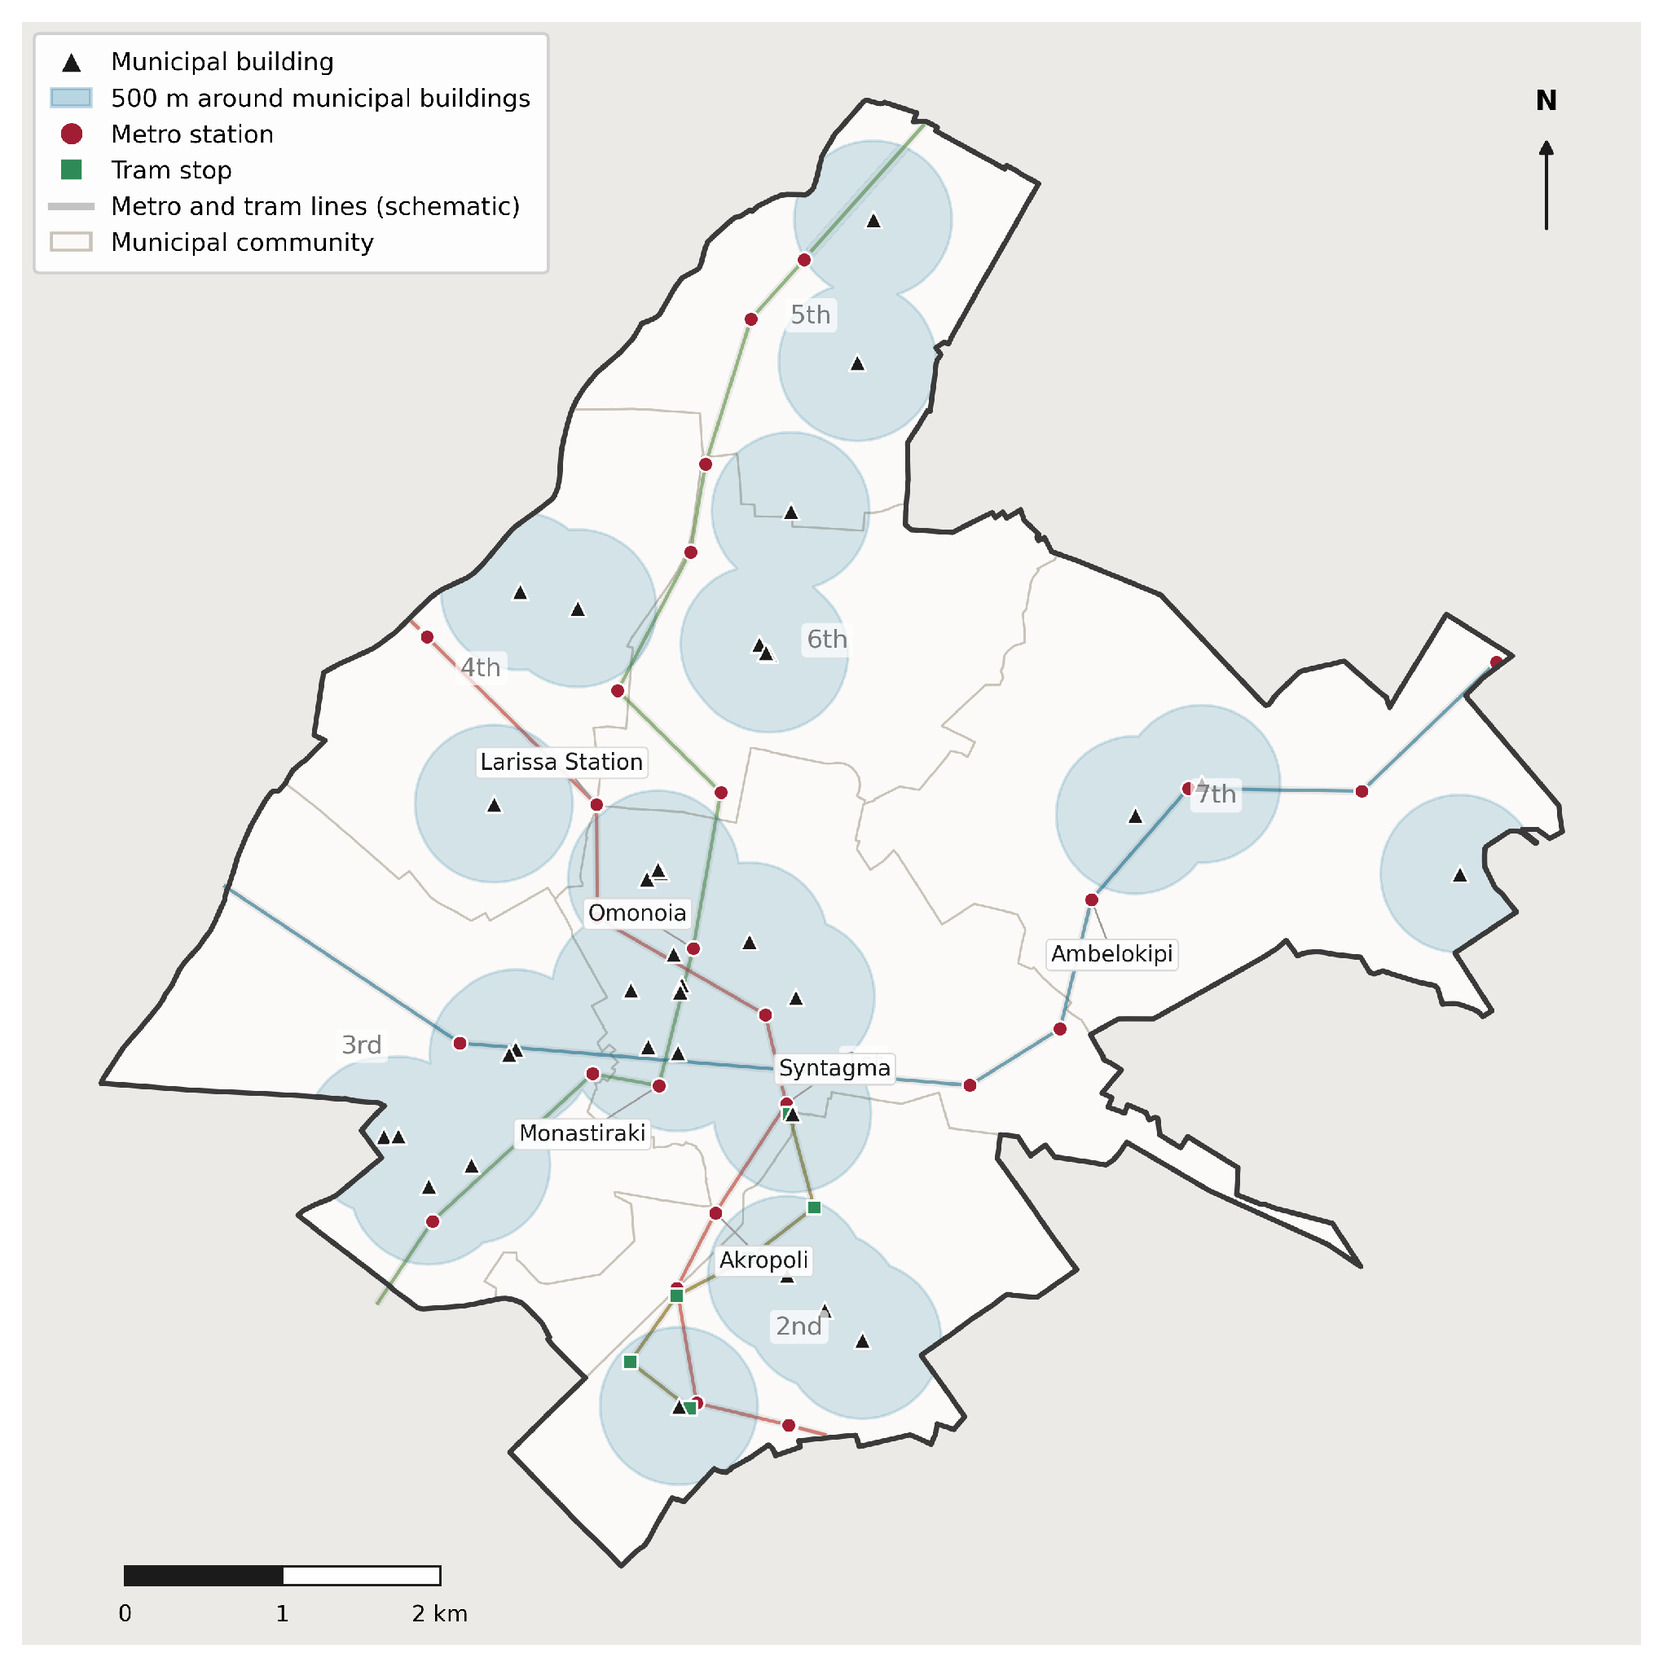
  • Figure 1. The Municipality of Athens, its seven municipal communities, its main municipal buildings and the metro and tram network, with lines drawn schematically between stations.
    Download
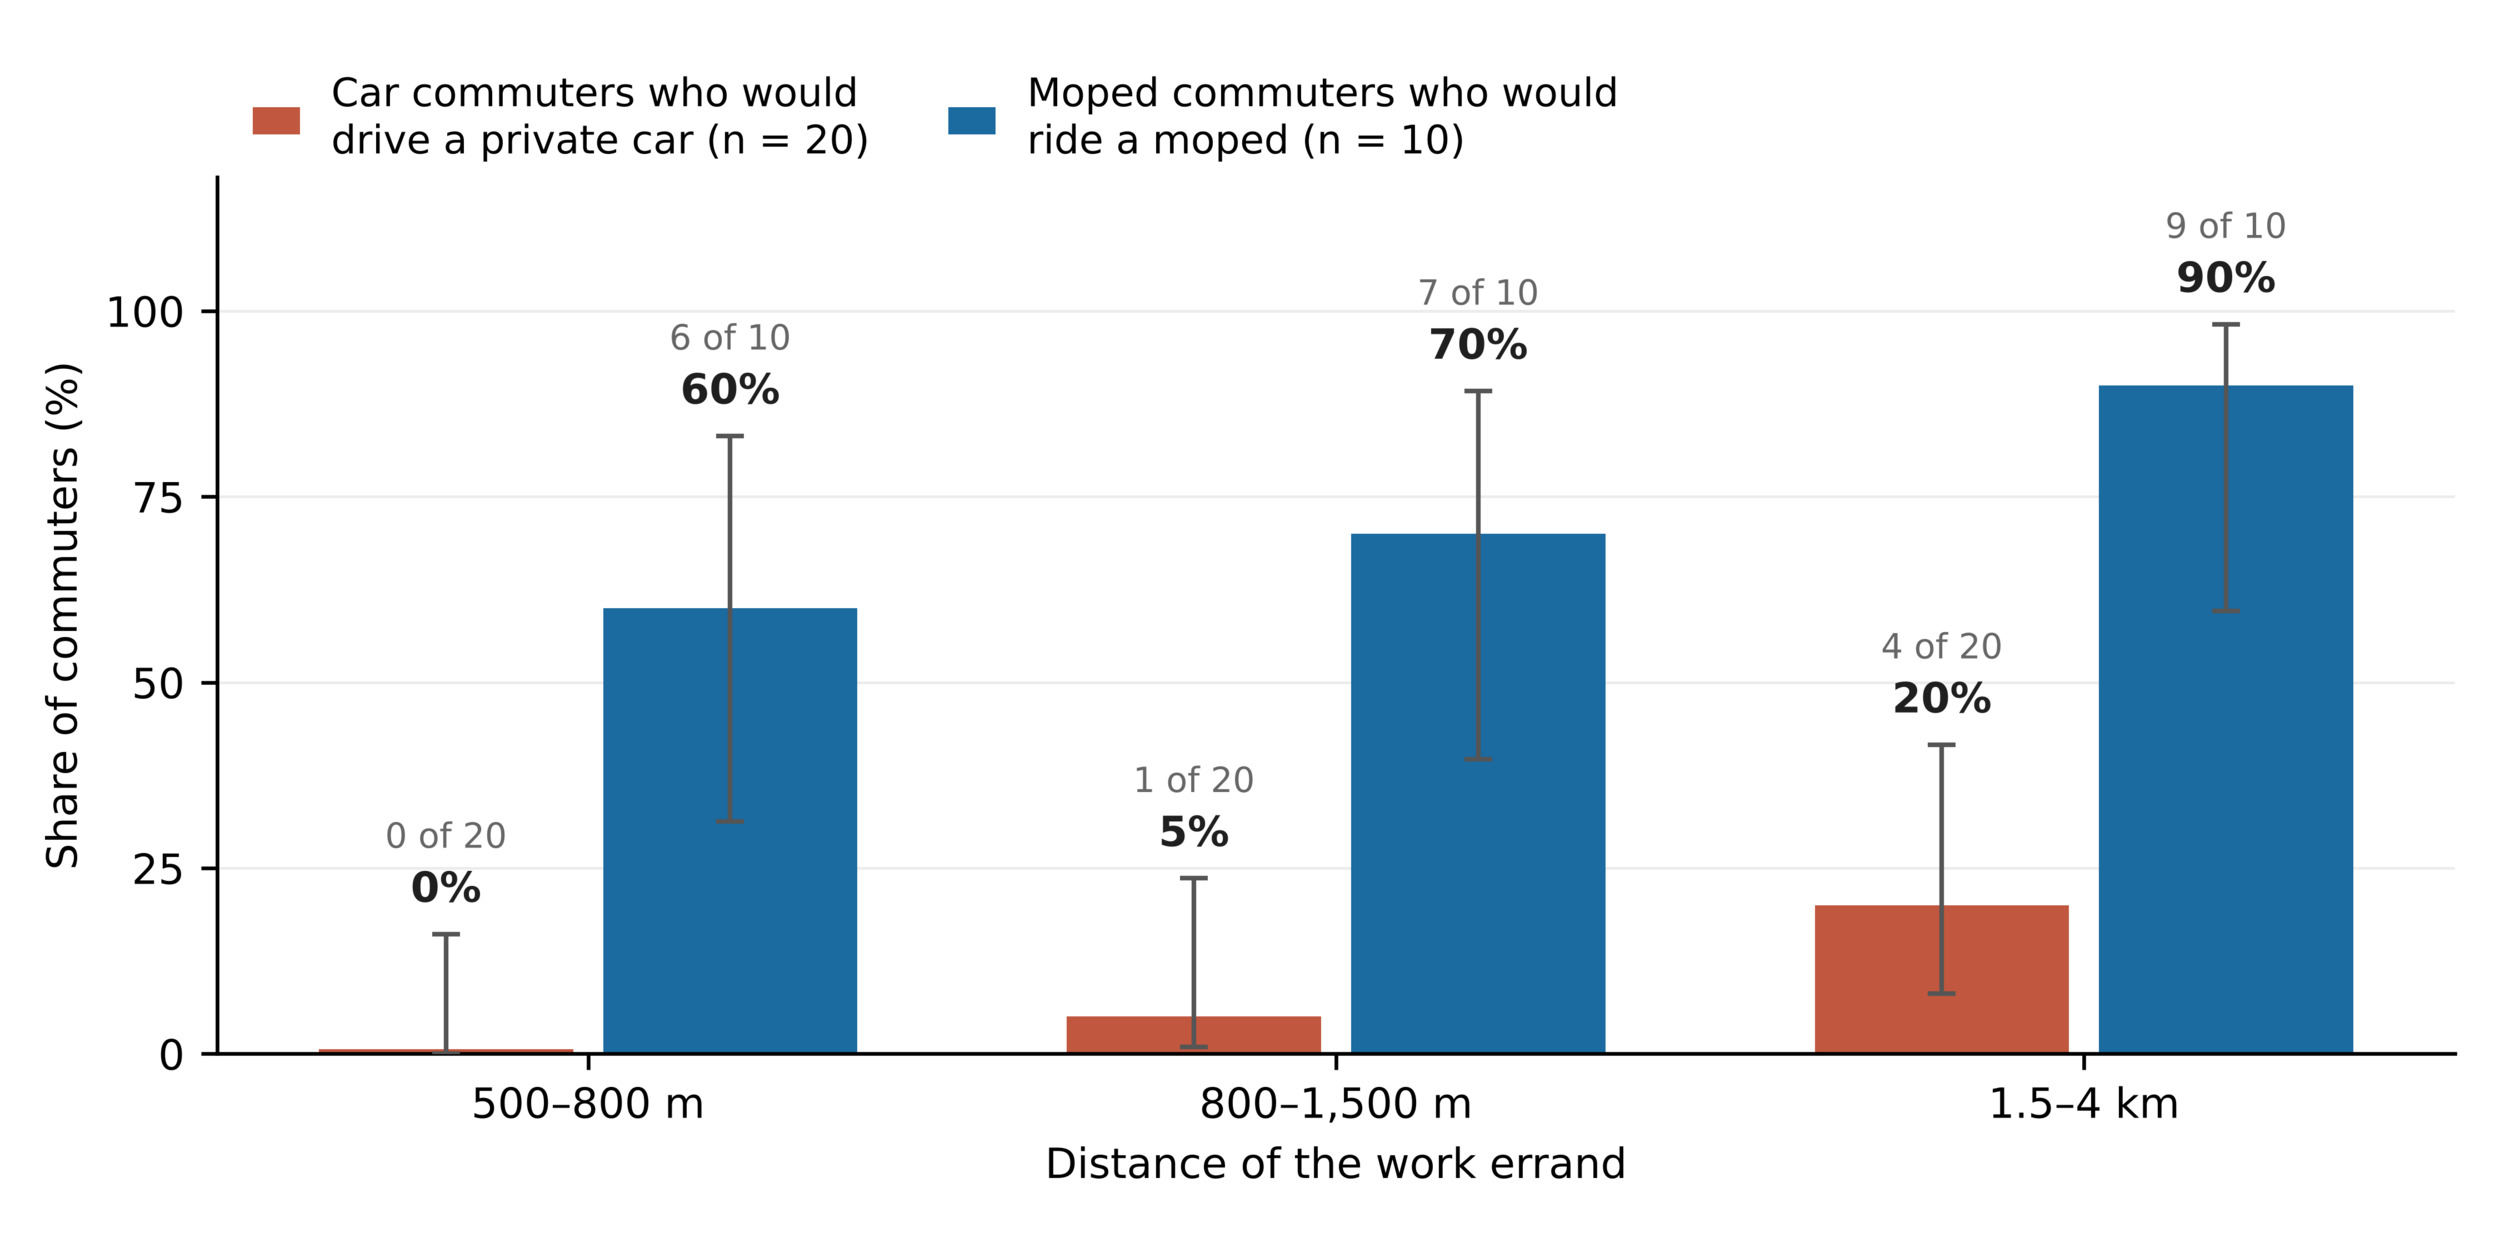
  • Figure 2. Car and moped commuters who would use the same mode for work errands at three distances. Bars give the percentage, whiskers the 95% Wilson interval, and labels the number of respondents.
    Download
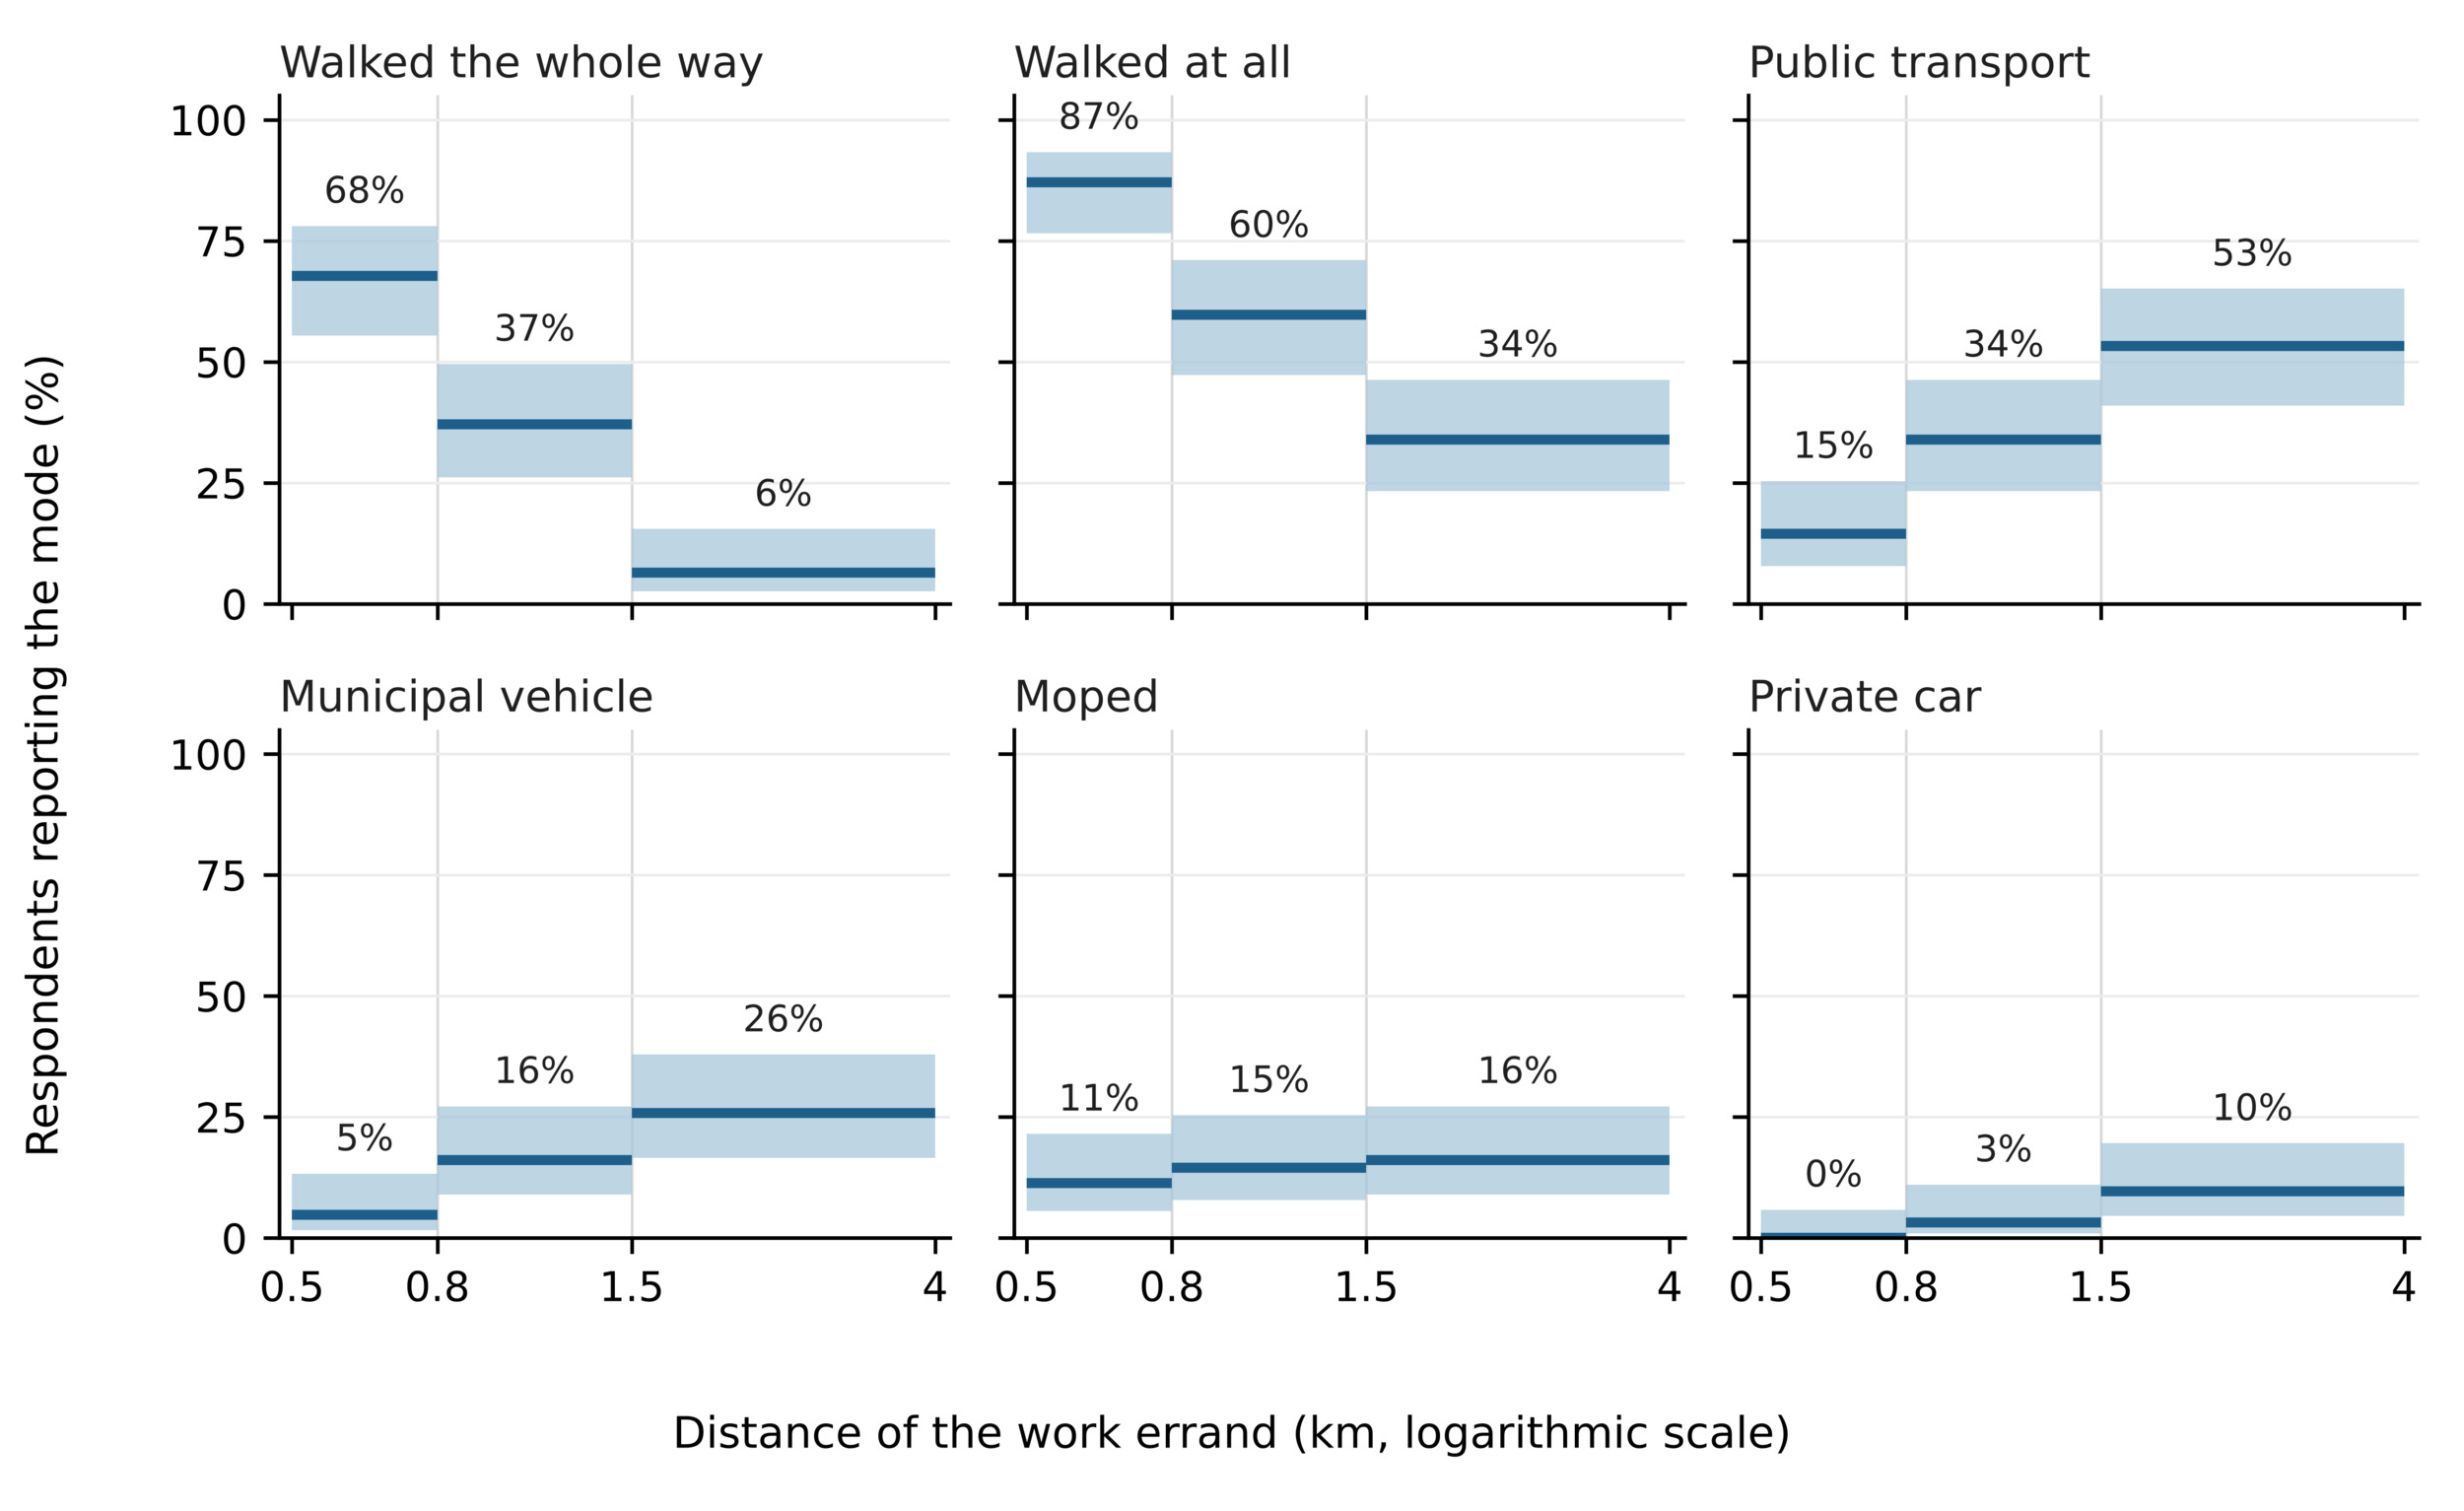
  • Figure 3. Modes reported for work errands at three distances (n = 62). Each bar spans its distance band on a logarithmic scale and gives the percentage of respondents, and the shaded box shows the 95% Wilson interval. Respondents could report more than one mode, so the shares do not sum to 100%, and walking at all covers walking alone or together with another mode.
    Download
  • README
    Download
  • QUESTIONNAIRE
    Download
  • DATA
    Download
  • CODEBOOK
    Download

Error

Sorry, something went wrong. Please try again.

If this problem reoccurs, please contact Scholastica Support

Error message:

undefined

View more stats

Abstract

Employer-led mobility research says little about trips public bodies assign to staff during working hours. We asked Municipality of Athens employees how they would travel for work errands at three distances. None would drive for the shortest errand and 10% for the longest, although a third drive or are driven to work. Walking and public transport carry these work errands, and the moped is the only commuting mode still used on them. Among private vehicle commuters, a shorter working day and a subsidised transport pass were the favoured incentives, and combining them would extend the benefit beyond work travel.

1. Questions

Employer-led mobility management research and practice focuses almost entirely on the commute, and its instruments are designed to move employees out of the private vehicles they use daily (Chen and Yang 2023; Roaf et al. 2024). Work-related trips undertaken for a public authority within the city differ in kind, since the employer sets the destination but rarely the mode. Such trips remain poorly documented. Research on work-related travel concentrates on long-distance business journeys (Jittrapirom et al. 2025), and studies that classify such travel by spatial scale find local trips within a city the least examined (Hislop 2016). National travel surveys that do record professional travel separately still pool it with commuting in analysis (Hogeweij et al. 2026).

Athens, a compact and heterogeneous historic European city, is well suited to studying such trips. The municipality covers 38 sq. km, served by three metro lines, a tram and a dense bus network. Its municipal buildings stand close together, a median of about 300 m apart, with 78% of all pairs under 4 km and six in ten within 500 m of a metro or tram stop (Figure 1). Not every directorate has a vehicle.
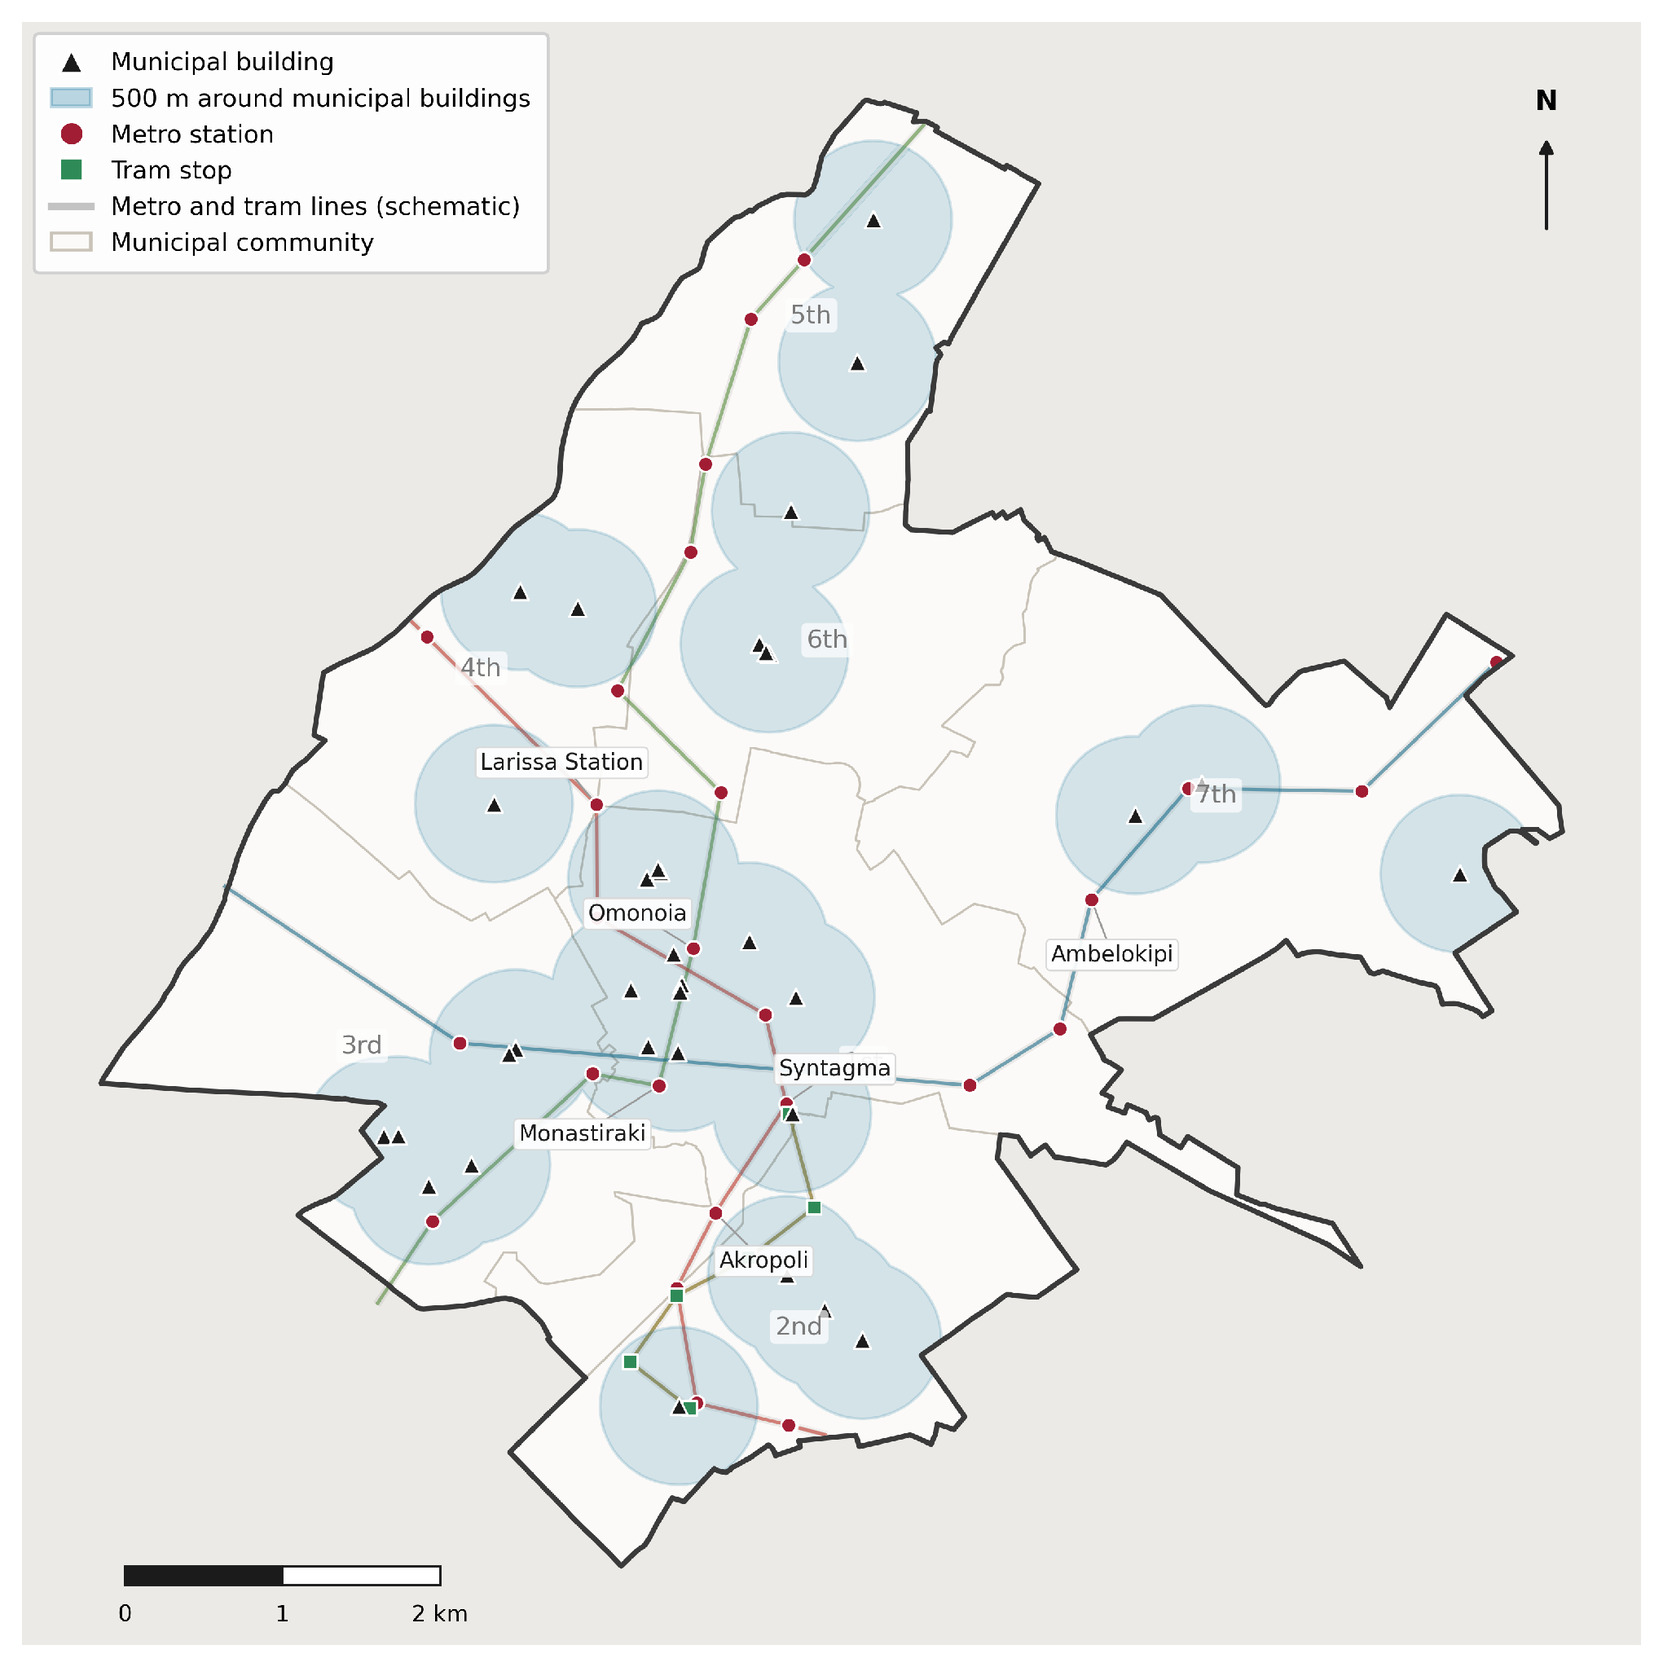
Figure 1
Figure 1.The Municipality of Athens, its seven municipal communities, its main municipal buildings and the metro and tram network, with lines drawn schematically between stations.

The survey asked how far employees will walk before changing mode, and whether conventional workplace mobility management has anything left to act upon. Earlier research places the acceptable walking distance between 400 and 800 metres, although recent evidence indicates that people walk further (Merlin et al. 2021; Taylor and Somenahalli 2024; Yang and Diez-Roux 2012).

2. Methods

An anonymous questionnaire ran from 23 November to 28 December 2023 within the Walkable Athens programme (https://walkable.cityofathens.gr). It was sent to 34 service mailboxes in five directorates whose staff work in the field, each reaching five to ten people, so roughly 170 to 340 employees were addressed directly. Sixty-five replied, and the 62 who answered all three distance items form the analytic sample. Thirty-six belong to the directorates addressed directly, an indicative response rate of 11% to 21%. The remaining 26, from other departments, received the link from colleagues, so their response rate is unknown.

Respondents reported how often they are sent out, whether they carry heavy objects and how they would travel at 500 to 800 metres, 800 to 1,500 metres and 1.5 to 4 kilometres, giving their two main reasons from a list including time, load, terrain, weather and health. The bands start within the usual 400 to 800 metre walking threshold, since the survey asked how far employees will walk before changing mode. The three mode items (Q12, Q14, Q16) listed all modes and allowed multiple answers, but only the commuting item (Q6) added that several modes may be ticked “where they are of roughly equal weight in the trip”. A short walk to the metro may therefore have gone unticked, and the shares walking at all are a lower bound. Only one respondent chose cycling for errands, as Athens has no continuous cycle network or public bicycle scheme. Cochran’s Q tests whether the share of a mode changes across the three distances, McNemar’s test compares commuting with errand modes, and Fisher’s exact test compares two groups of respondents. Shares carry 95% Wilson confidence intervals, which remain reliable for small samples and near-zero shares.

3. Findings

No respondent would use a private car at 500 to 800 metres, 3% would at 800 to 1,500 metres and 10% beyond 1.5 kilometres (95% interval 5% to 20%), although 20 of the same respondents (32%) drive or are driven to work. Of these 20, none would take the car for the shortest errand and four for the longest (Figure 2, McNemar’s test, p < 0.01 in every band). Instead, most would walk or take public transport. Moped commuters behave differently. Of the ten who ride a moped to work, six, seven and nine would also use a moped for errands at the three distances, and none would use public transport.
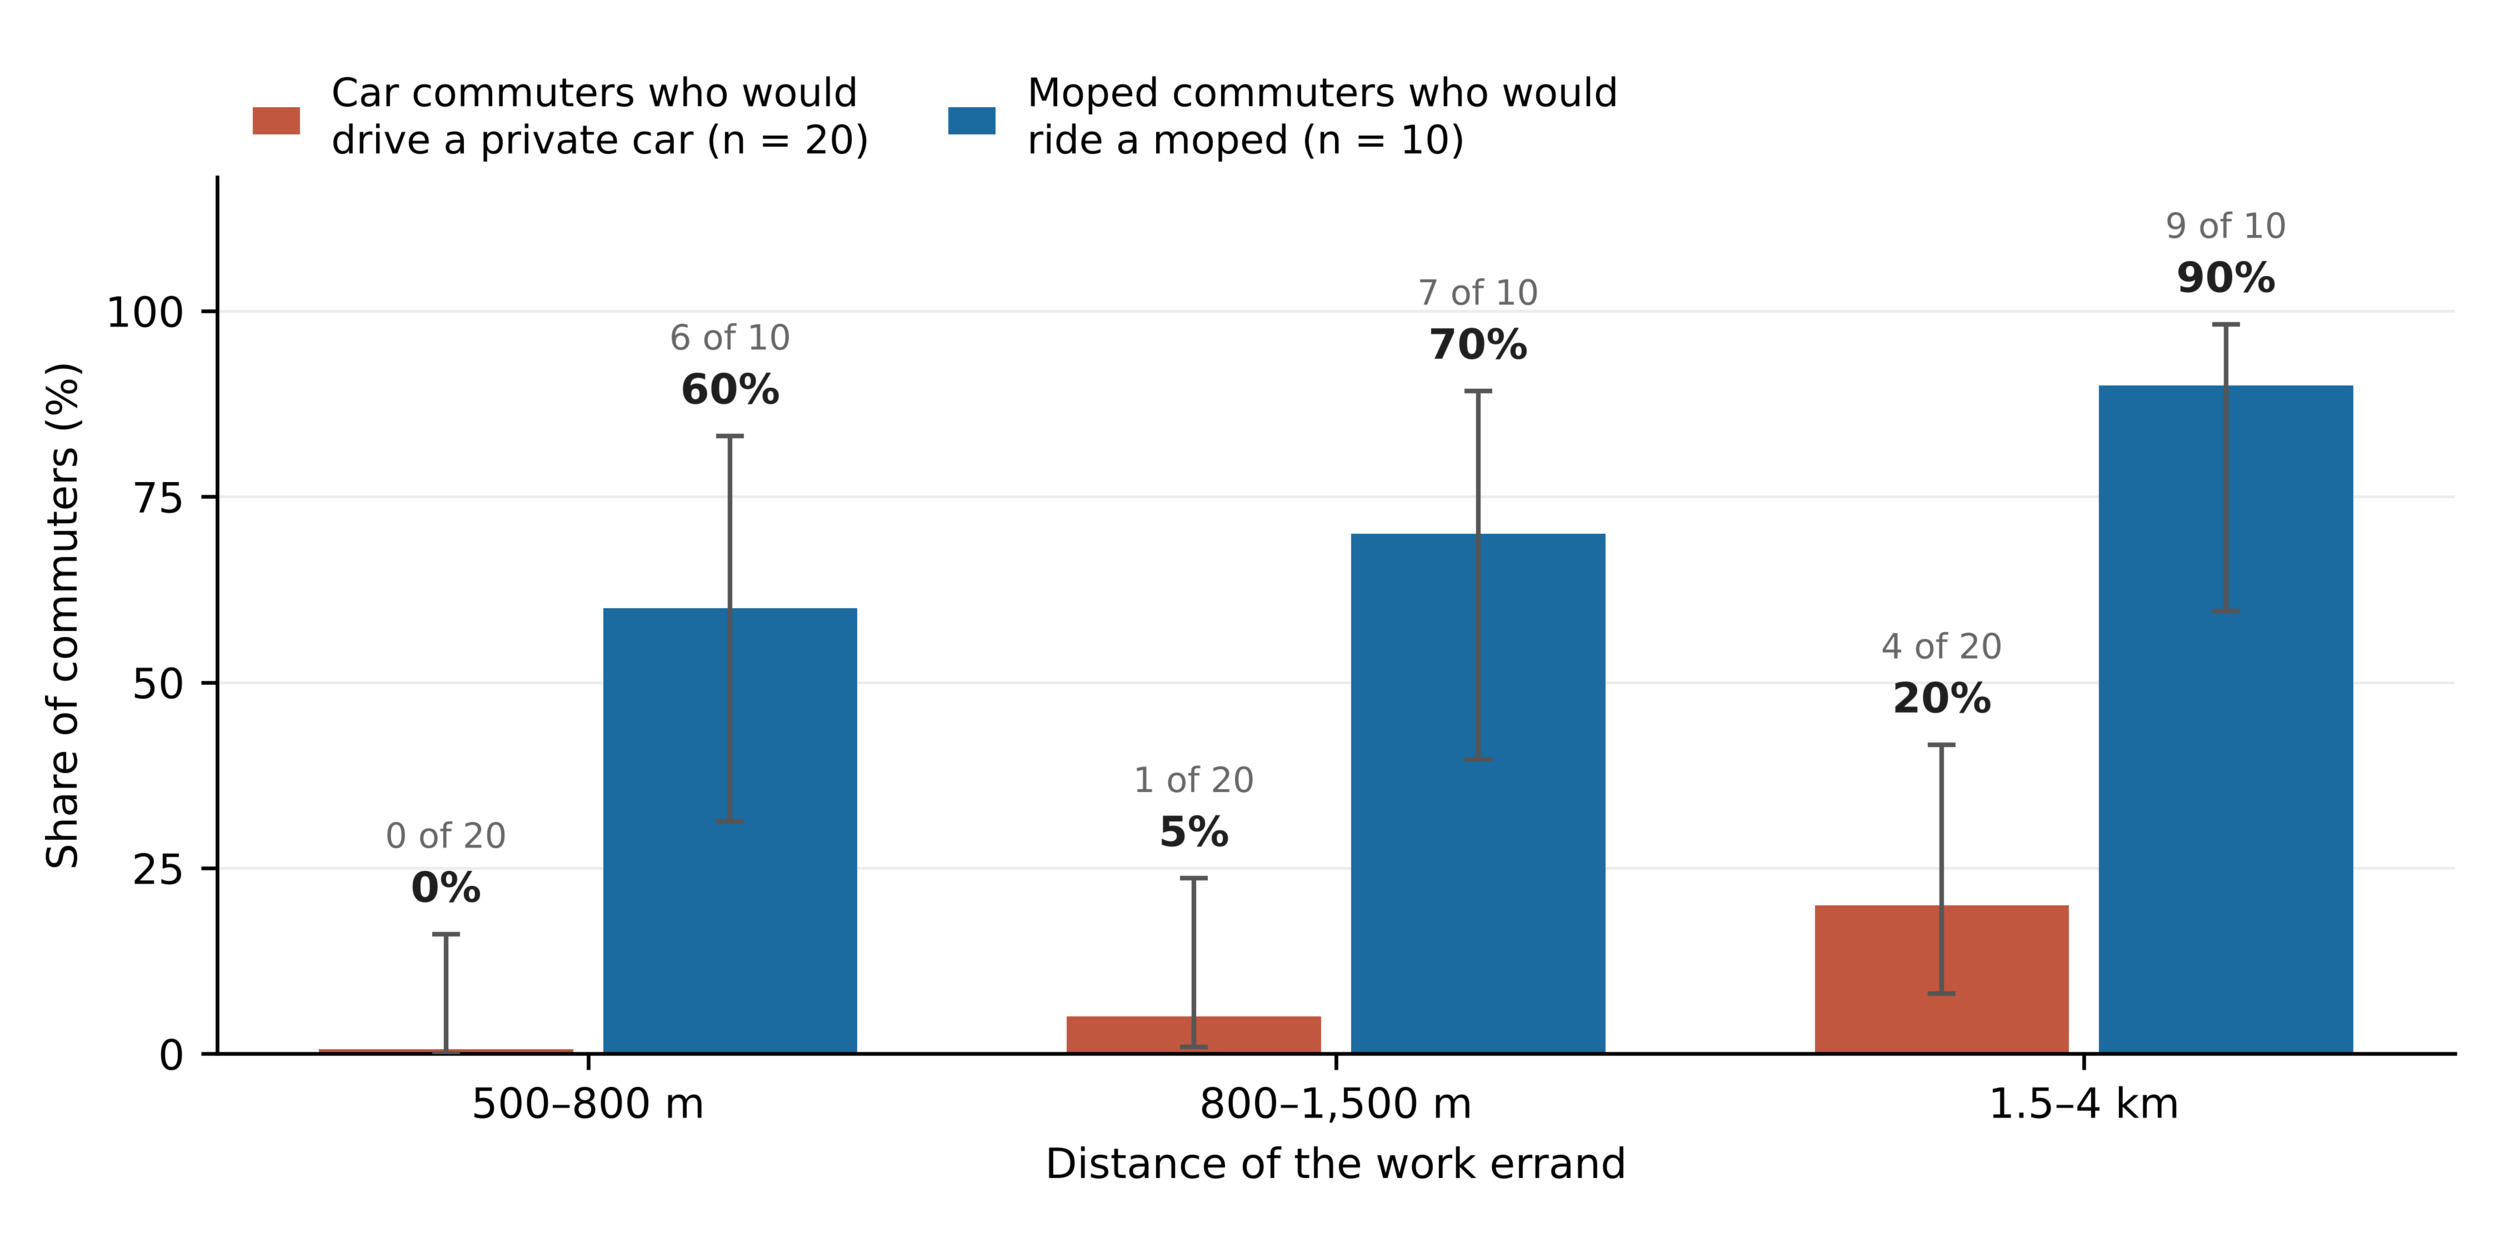
Figure 2
Figure 2.Car and moped commuters who would use the same mode for work errands at three distances. Bars give the percentage, whiskers the 95% Wilson interval, and labels the number of respondents.

Walking and public transport carry these errands (Figure 3). Walking the whole way falls from 68% in the shortest band to 37% and then 6% (Cochran’s Q = 55.5, p < 0.001). Walking at all declines more gently, from 87% to 60% and 34%, while public transport rises from 15% to 34% and 53%, so walking partly becomes the way to reach public transport rather than disappearing.
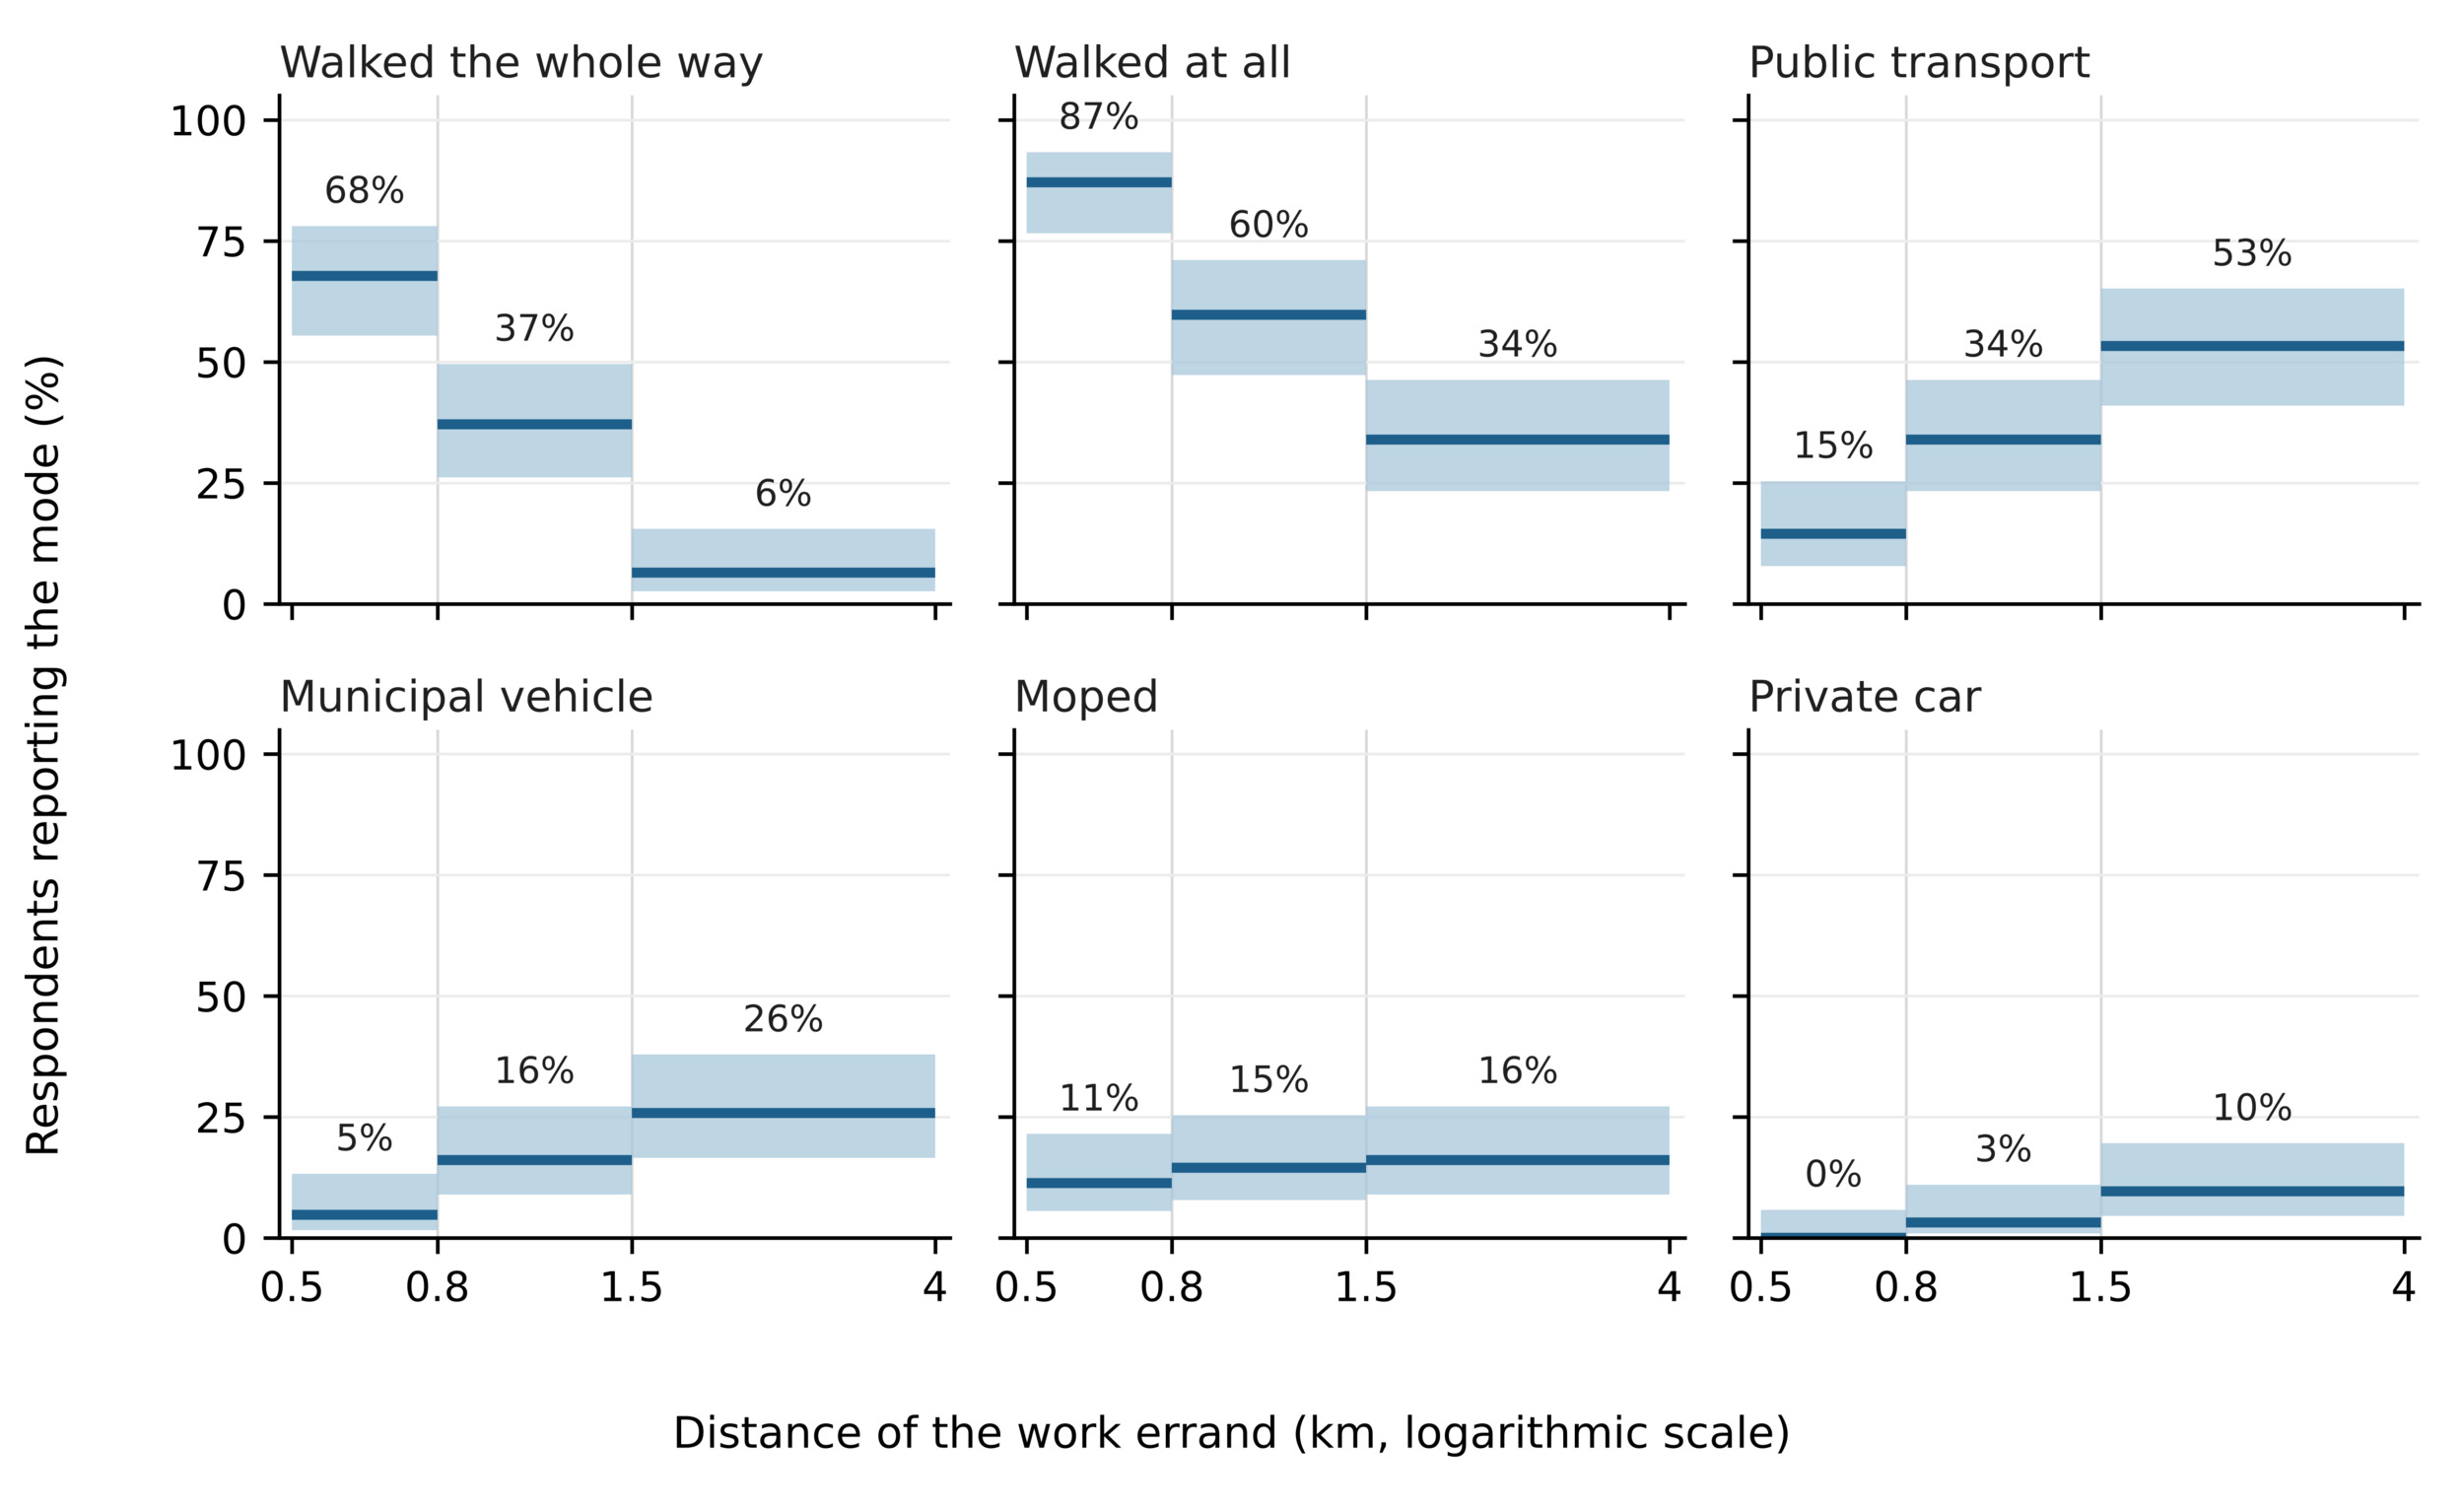
Figure 3
Figure 3.Modes reported for work errands at three distances (n = 62). Each bar spans its distance band on a logarithmic scale and gives the percentage of respondents, and the shaded box shows the 95% Wilson interval. Respondents could report more than one mode, so the shares do not sum to 100%, and walking at all covers walking alone or together with another mode.

This decline holds in every subgroup of at least eight respondents (Table 1). Walkers cite time saving no more often than others, 66% against 75% in the shortest band and 57% against 69% in the middle one (Fisher’s exact test, p = 0.563 and 0.411). At short range, a municipal vehicle was chosen only by employees who carry heavy objects, three of 15 against none of the other 46 (p = 0.013), while terrain and weather were rarely cited (3% and 7%).

Table 1.Walking the whole way falls with distance in every subgroup. Cells give the percentage of each subgroup who reported walking as their only mode, and the last column gives the p value of Cochran’s Q test comparing the three distances within the same people. Subgroups of fewer than eight respondents are not reported. Invited directly denotes respondents belonging to the five directorates that received the invitation, and reached by forwarding all remaining respondents. The two values of 0.050 come from subgroups of eight and should be read as borderline.
Subgroup n Walked the whole way (% of subgroup)
500–800 m 800–1,500 m 1.5–4 km p
All respondents 62 68 37 6 <0.001
Municipal police 15 67 33 7 0.002
Revenue 9 89 67 11 0.004
Building control 8 50 25 0 0.050
Technical services 8 62 38 12 0.050
Invited directly 36 61 36 6 <0.001
Reached by forwarding 26 77 38 8 <0.001
Goes out weekly or more 22 59 27 9 <0.001
Goes out less often 40 72 42 5 <0.001

Car-reduction policy therefore has little to act upon, and the better measures support the walking and public transport already carrying these errands. Rewarding those who walk or use public transport draws broad support (median 10 out of 10, Table 2). The incentive item, addressed to the 29 employees who reach work by car or moped, was answered by 25. A shorter working day (36%) and a subsidised annual transport pass (32%) were chosen about equally often, ahead of a municipal shuttle bus and extra annual leave (16% each). Combining a one-hour shorter working day with such a subsidy would offset both the time and cost of commuting by public transport and act as a commuting benefit (Roaf et al. 2024).

Table 2.Questionnaire items used in this paper and the full distribution of responses. Percentages are of the respondents answering each item, with the base n given beside the item number. For Q12 to Q17 the three figures correspond to the three distance bands in the order shown. Multiple answers were allowed for Q6, for the mode items and for the reason items, so these do not sum to 100%. Q20 was conditional on reaching work by a private motorised vehicle and is therefore reported for the 25 of those 29 employees who answered it, while the answers returned by respondents outside that group are retained in the deposited dataset and excluded here.
Item Questionnaire item Response option % (n)
Q1 (n = 62) Directorate (grouped) Municipal police 24% (15)
Revenue 15% (9)
Building control 13% (8)
Technical services 13% (8)
Green spaces 8% (5)
Cleansing 6% (4)
Urban planning 6% (4)
Administration 2% (1)
Other or unspecified 13% (8)
Q2 (n = 62) Sex Man 52% (32)
Woman 48% (30)
Q3 (n = 62) Age band Under 40 11% (7)
40–49 44% (27)
50–59 32% (20)
60 and over 13% (8)
Q6 (n = 62) Main mode(s) from home to work (multiple allowed) Public transport 55% (34)
Walking 31% (19)
Private car, driver 29% (18)
Moped 16% (10)
Bicycle 6% (4)
Private car, passenger 3% (2)
Q10 (n = 62) How often are you sent out on a work errand? Rarely 35% (22)
A few times a month 29% (18)
Almost daily 21% (13)
2–3 times a week 15% (9)
Q11 (n = 61) Do you carry heavy objects on a work errand? Never or rarely 75% (46)
Sometimes 20% (12)
Almost always 5% (3)
Q12, Q14, Q16 (n = 62) Mode(s) used for an errand at 500–800 m / 800–1,500 m / 1.5–4 km (multiple allowed) Walking, as the only mode 68% (42) / 37% (23) / 6% (4)
Walking, alone or combined 87% (54) / 60% (37) / 34% (21)
Public transport 15% (9) / 34% (21) / 53% (33)
Municipal vehicle 5% (3) / 16% (10) / 26% (16)
Moped 11% (7) / 15% (9) / 16% (10)
Private car 0% (0) / 3% (2) / 10% (6)
Taxi 0% (0) / 0% (0) / 3% (2)
Bicycle 2% (1) / 2% (1) / 2% (1)
Q13, Q15, Q17 (n = 61–62) Two main reasons for the mode chosen, at 500–800 m / 800–1,500 m / 1.5–4 km Time saving 69% (42) / 65% (40) / 73% (45)
Personal health or fitness 34% (21) / 31% (19) / 21% (13)
Long distance 2% (1) / 21% (13) / 39% (24)
Unattractive walking route 13% (8) / 21% (13) / 10% (6)
Inadequate transit infrastructure or frequency 20% (12) / 8% (5) / 8% (5)
Protection from adverse weather 7% (4) / 6% (4) / 16% (10)
Steep terrain 3% (2) / 3% (2) / 3% (2)
Carrying equipment 2% (1) / 2% (1) / 2% (1)
No other mode available 2% (1) / 2% (1) / 2% (1)
Difficult to book a municipal vehicle 2% (1) / 2% (1) / 2% (1)
Cheapest option for the service 2% (1) / 2% (1) / 2% (1)
Q19 (n = 61) Support for rewarding employees who walk or use public transport on a work errand (1–10) 8–10, high support 74% (45)
4–7, moderate 15% (9)
1–3, low 11% (7)
Median=10, Mean=8.0
Q20 (n = 25) Incentive that would encourage a shift away from a motorised vehicle for commuting, addressed to employees who reach work by private car or moped Shorter working hours 36% (9)
Annual public transport pass subsidy 32% (8)
Municipal shuttle bus 16% (4)
Extra days of annual leave 16% (4)

Four limitations apply. The sample is small and not random. Comparing each respondent with their own answers rules out differences between people as the source of the decline in walking with distance, but not bias in who replied. If employees who already walk or use public transport were more willing to reply, car use for errands would be understated. Respondents described single errands at fixed distances in ascending order, without origin, destination, extra stops or personal tasks, and none under 500 metres, so these thresholds are perceived rather than observed. The fieldwork ran in late autumn, and although work-related travel resists heat better than other purposes (Hogeweij et al. 2026), Athenian summers are far hotter. Future work should follow actual errands with GPS or travel diaries across seasons, including short trips, extra stops and the vehicles municipalities provide.


Acknowledgments

The author declares no conflict of interest. The questionnaire formed part of the Walkable Athens research programme (project code 91/0051), carried out by the Sustainable Mobility Unit of the National Technical University of Athens, Greece, and funded by the Municipality of Athens (2020–2024). The programme received ethical approval under protocol 50736/27.10.2020, and participation was voluntary and anonymous, with no personal identifiers collected. Generative AI was used to check language and improve clarity of expression. All analysis, interpretation and conclusions are the work of the author, who reviewed and takes responsibility for the entire text.

Submitted: August 25, 2026 AEST

Accepted: October 19, 2026 AEST

References

Chen, P., and X. Yang. 2023. “Revisit Employer-Based Travel Demand Management: A Longitudinal Analysis.” Transport Policy 131: 22–31. https:/​/​doi.org/​10.1016/​j.tranpol.2022.11.014.
Google Scholar
Hislop, D. 2016. “The Diverse Patterns of Work-Related Business Travel: Accounting for Spatial Scale.” Applied Mobilities 1 (2): 219–33. https:/​/​doi.org/​10.1080/​23800127.2016.1245091.
Google Scholar
Hogeweij, M., C. Bongers, K. Raaphorst, and H. Ploegmakers. 2026. “Heat Stress and Active Travel, an Eight-Year National Analysis in The Netherlands.” Environmental Research 305: 124968. https:/​/​doi.org/​10.1016/​j.envres.2026.124968.
Google Scholar
Jittrapirom, P., V. Marchau, H. Meurs, R. van der Heijden, and J. van der Waerden. 2025. “Mobility as a Service for Business Travel: Exploring Feasibility and Travelers’ Preferences.” Transportation Research Interdisciplinary Perspectives 34: 101745. https:/​/​doi.org/​10.1016/​j.trip.2025.101745.
Google Scholar
Merlin, L. A., D. Teoman, M. Viola, H. Vaughn, and R. Buehler. 2021. “Redrawing the Planners’ Circle: Analyzing Trip-Level Walk Distances Across Two National Surveys.” Journal of the American Planning Association 87 (4): 470–83. https:/​/​doi.org/​10.1080/​01944363.2021.1877181.
Google Scholar
Roaf, E., H. Larrington-Spencer, and E. R. Lawlor. 2024. “Interventions to Increase Active Travel: A Systematic Review.” Journal of Transport & Health 38: 101860. https:/​/​doi.org/​10.1016/​j.jth.2024.101860.
Google Scholar
Taylor, M. A. P., and S. Somenahalli. 2024. “Distributions of Walking Access to Public Transport in Melbourne, Australia – Evidence on Acceptable and Tolerable Walking Distances.” International Journal of Sustainable Transportation 18 (7): 576–88. https:/​/​doi.org/​10.1080/​15568318.2024.2385641.
Google Scholar
Yang, Y., and A. V. Diez-Roux. 2012. “Walking Distance by Trip Purpose and Population Subgroups.” American Journal of Preventive Medicine 43 (1): 11–19. https:/​/​doi.org/​10.1016/​j.amepre.2012.03.015.
Google Scholar

Attachments

Powered by Scholastica, the modern academic journal management system