Loading [MathJax]/jax/output/SVG/jax.js
Skip to main content
null
Findings
  • Menu
  • Articles
    • Energy Findings
    • Resilience Findings
    • Safety Findings
    • Transport Findings
    • Urban Findings
    • All
  • For Authors
  • Editorial Board
  • About
  • Blog
  • covid-19
  • search

RSS Feed

Enter the URL below into your favorite RSS reader.

https://findingspress.org/feed
Transport Findings
September 22, 2020 AEST

Long-Distance Person Travel: A Cluster-Based Approach

Mina Hassanvand,
cluster analysisfuzzy c-meansk-meansagglomerative hierarchical clusteringtravel behaviourtravel modellinglong-distance person travel
Copyright Logoccby-sa-4.0 • https://doi.org/10.32866/001c.17291
Photo by frank mckenna on Unsplash
Findings
Hassanvand, Mina. 2020. “Long-Distance Person Travel: A Cluster-Based Approach.” Findings, September. https:/​/​doi.org/​10.32866/​001c.17291.
Save article as...▾
Download all (6)
  • Table 1: Clustering Steps
    Download
  • Figure 1: Count of Trips by Distance and Canadian Nights Away for 2017 (TSRC) 4167 (AB) to (AB) Trips
    Download
  • Table 2: List of Variables
    Download
  • Table 3: Clusters Found in the 2017 (TSRC) (AB) to (AB) Trips at 68% Confidence Level
    Download
  • Figure 2: 3D Representation of 10 Clusters Across a few Key Dimensions: Household (HH) Members on the Trip, Travelling Group Size, Total Nights Away from home while on Trip, One-way Distance from Home in km, Trips Frequency, Total Amount of Spending while on Trip in 2017 $CAD
    Download
  • Figure 3: 2017 (TSRC) (AB) to (AB) Trips (AHC) Ward’s Dendrogram
    Download

Sorry, something went wrong. Please try again.

If this problem reoccurs, please contact Scholastica Support

Error message:

undefined

View more stats

Abstract

Many long-distance person trips (LDPT) modelling efforts fail to accurately represent trips using traditional segmentation approaches. Thus, a clustering approach was used herein to segment an intra-provincial trips data set. The trips’ segments found were short economical getaways (36%), same-day shopping (16%), personal business (14%), visiting friends/relatives (10%), business/casino trips (10%), young adults playing team sports (6%), same-day trips of snow/festival loving young families with kids (3%), costly cottage/camping trips (3%), seniors with medical appointments (2%), and multiple city visitors (1%). The existence of clusters and associated activities shows what segmentation approaches modern models should follow.

The analysis of travel demand often includes the partitioning of the demand into “market segments” seeking to separate these influences into groups. As demonstrated in (Travel Demand Modelling 2016; Ben-Akiva and Lerman 1987; Limtanakool, Dijst, and Schwanen 2006; Bhat 1997b; Koppelman and Sethi 2000; Mandel, Gaudry, and Rothengatter 1997; Larse 2010; Wardman, Toner, and Whelan 1997; LaMondia, Bhat, and Hensher 2008; Carlsson 1999; Hensher 1991; Morrison and Winston 1985; Hassanvand 2020), the development of such models includes substantial effort that encompasses enormous revalidation work, which has been reduced with the aid of advanced computer technology. However, there still exists a gap in model design that arise from failure to segment markets.

This paper defines travel alternatives made by market segments with the aim of optimizing the selection of descriptive variables and strengthening the explanatory power of the model. Nearly all long-distance person trips (LDPT) models (Federal Highway Administration 2015; Golob 2001; Kizielewicz et al. 2017; Bhat 1997a; Golob and Hensher 1998; Badoe and Miller 1998; Lieberman et al. 2001) developed in various countries are based not on empirical procedures but rather by educated guesses to describe the travel market variables. This research transforms the approach to traditional segmentations using computer science approaches for network-based data that stem from fuzzy logic (Zadeh 1965). Such approaches are based on grouping of data points by examining their proximity (e.g. Euclidean distance) to one another. This is essential as LDPT is not merely the longer version of short-distance daily trips. While fuzzy-neuro models have been used in transit and some short-distance models (Kumar, Sarkar, and Madhu 2013; Sarkar 2012; Tharwat 2014; Roxas 2016; Yaldi et al, n.d.; Gite 2013), they have not been used in LDPT – excluding goods movement, trucking, or air travel.

METHODS AND DATA

Clustering is a statistical tool used in pattern recognition and machine learning to find similar groups in seemingly dissimilar network-based datasets (e.g. transport data). Objects in a cluster/class share many characteristics but are very dissimilar to objects not belonging to that particular cluster (Punj and Stewart 1983). In most of the classification works (Milligan 1996; Posse 1998; Everitt, Landau, and Leese 2001), considerable number of algorithms belong to two major types of clustering used here namely Hierarchical and Partitional. The former is based on finding clusters hierarchy using a criterion and producing a dendrogram. The latter is partitioning the data based on minimization of an objective function such as the squared error function (Kaufman and Rousseeuw 1990; Bezdek 1974):

J=∑kj=1 ∑ni=1‖x(j)i−cj‖2(1)

Where ‖x(j)i−cj‖2 is the distance between a data item x(j)i and a centre point cj.

One type of partitional clustering, with steps shown in Table 1, is called the k-means approach as a specific form of the more general fuzzy c-means clustering that minimizes a similar objective function [34]:

Table 1
Table 1:Clustering Steps

The uniqueness of this work lies partly in the essential three-step cluster validity checks which are often ignored in many clustering themed studies (Dunn 1974; Zaki and Meira, Jr 2014):

  1. Cluster tendency checks: which is a measure of clusterability of a data set considering that algorithms such as k-mean unquestioningly find some clusters in a data set regardless. Thus, to ensure the data is actually clusterable, one must examine it for its clustering tendency using indices such as the Hopkins statistics prior to any clustering practices.

  2. Cluster stability checks: is the practice of clustering randomly generated data sets out of the original data and data belonging to other years/locations in order to examine if the resulting clusters are persistent and show up each time. Also, clustering the data set using fuzzy c-means provides an additional check on the existence/lack of potential outliers and acts as a precautionary measure against model-dependency of results.

  3. Cluster validity: consists of three tests namely External (one-way ANOVA, Post-hoc Bonferroni, and Logistic Regression), Internal (Beta-CV index), and Relative (Elbow method). Other tests include variables’ correlation checks, F-tests, Grubb’s test of outliers, Ward’s (AHC) dendrogram analyses and stopping rules comparison of a large Duda-Hart Je(2)/Je(1) index with a small Pseudo T-tests and a large Calinski-Harabasz Pseudo-F indices for detection of number of clusters (Everitt, Landau, and Leese 2001).

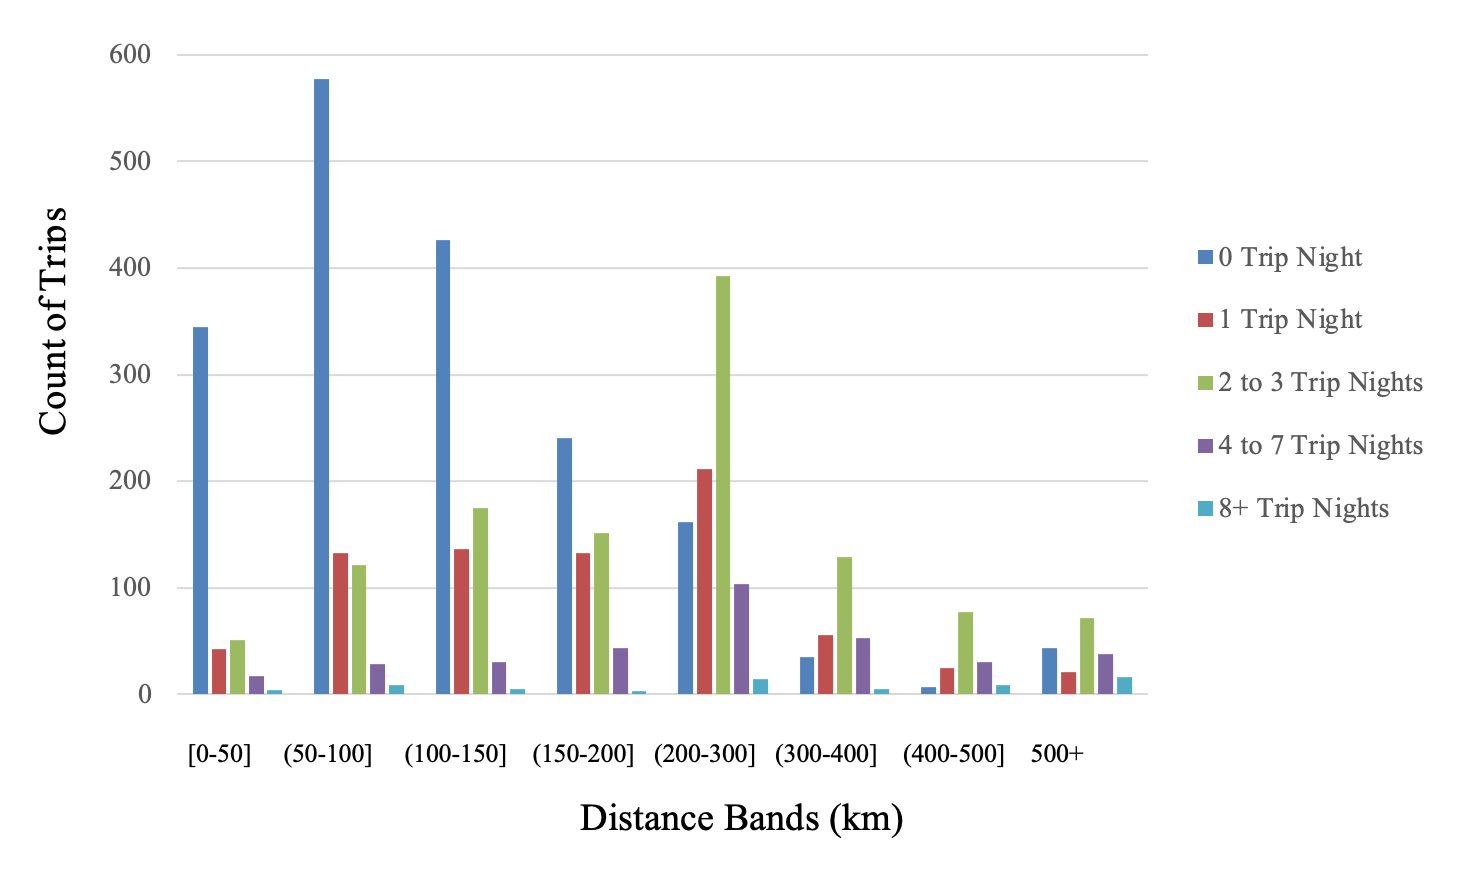
The publicly available standardized and weighted 2017 Travel Survey of Residents of Canada (TSRC) data set – including 14064 Province of Alberta (AB) residents, 4167 AB to AB trips, and 6128 nights travelled – is examined and compared with 2016 and 2015 data. TSRC is a supplement of the Canadian Labour Force Survey (LFS) (Statistics Canada 2017b, 2017a) after which TSRC questions are asked of a random 18+ household (HH) member regarding any one-way 40+ km trips from home finished in the previous month (same-day/overnight) plus any overnight trips ended two months before regardless of distance. Figure 1 shows trip counts by distance/purpose followed by variables’ list in Table 2. Analysis is based on 100 variables with minimal correlations from socio-demographic factors to places visited and 37 different activities divided into same-day/overnight.

Figure 1
Figure 1:Count of Trips by Distance and Canadian Nights Away for 2017 (TSRC) 4167 (AB) to (AB) Trips
Table 2
Table 2:List of Variables

FINDINGS

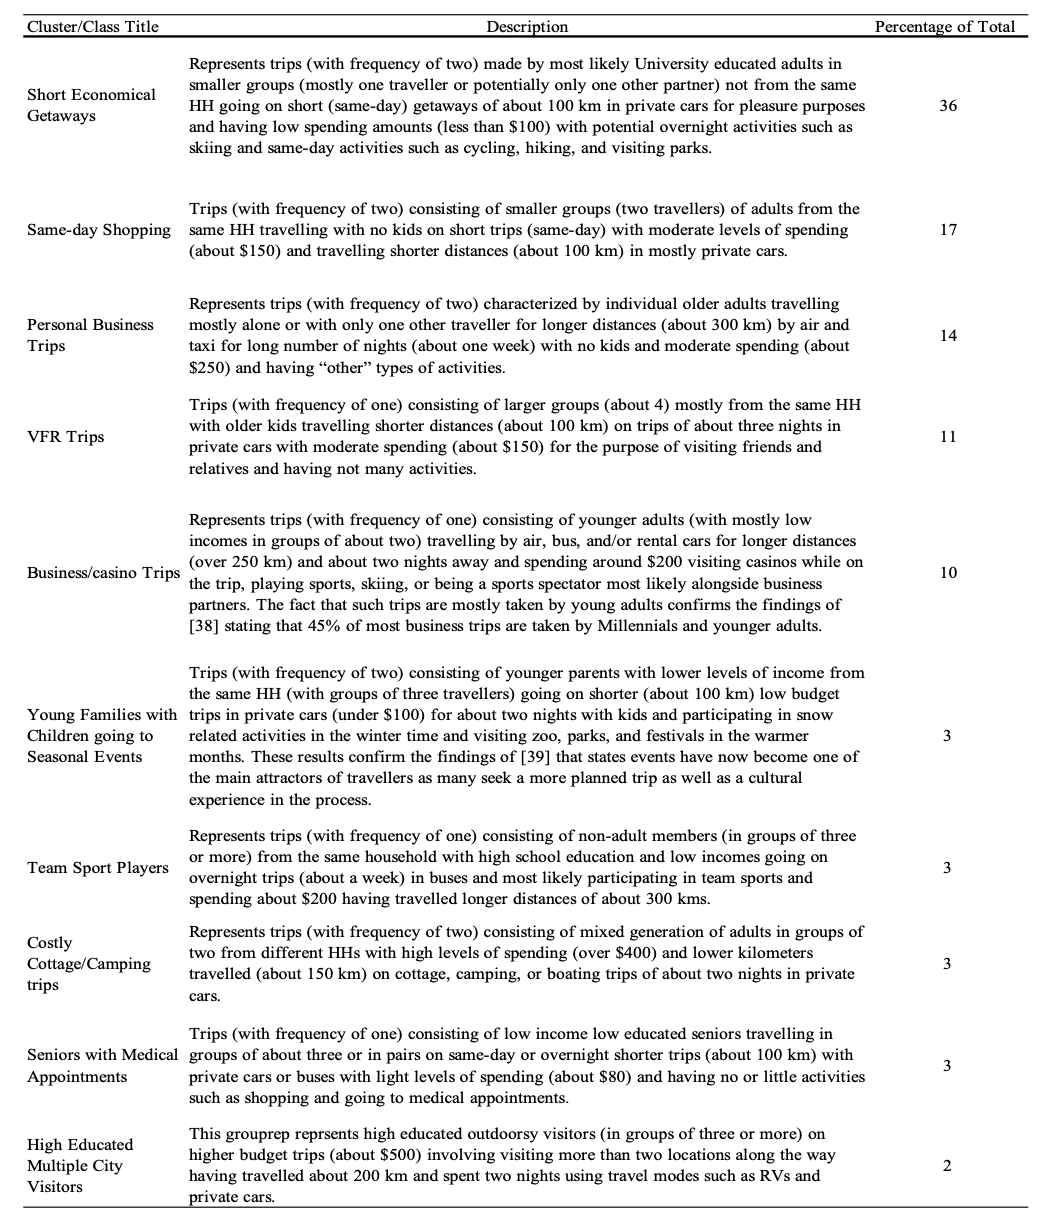
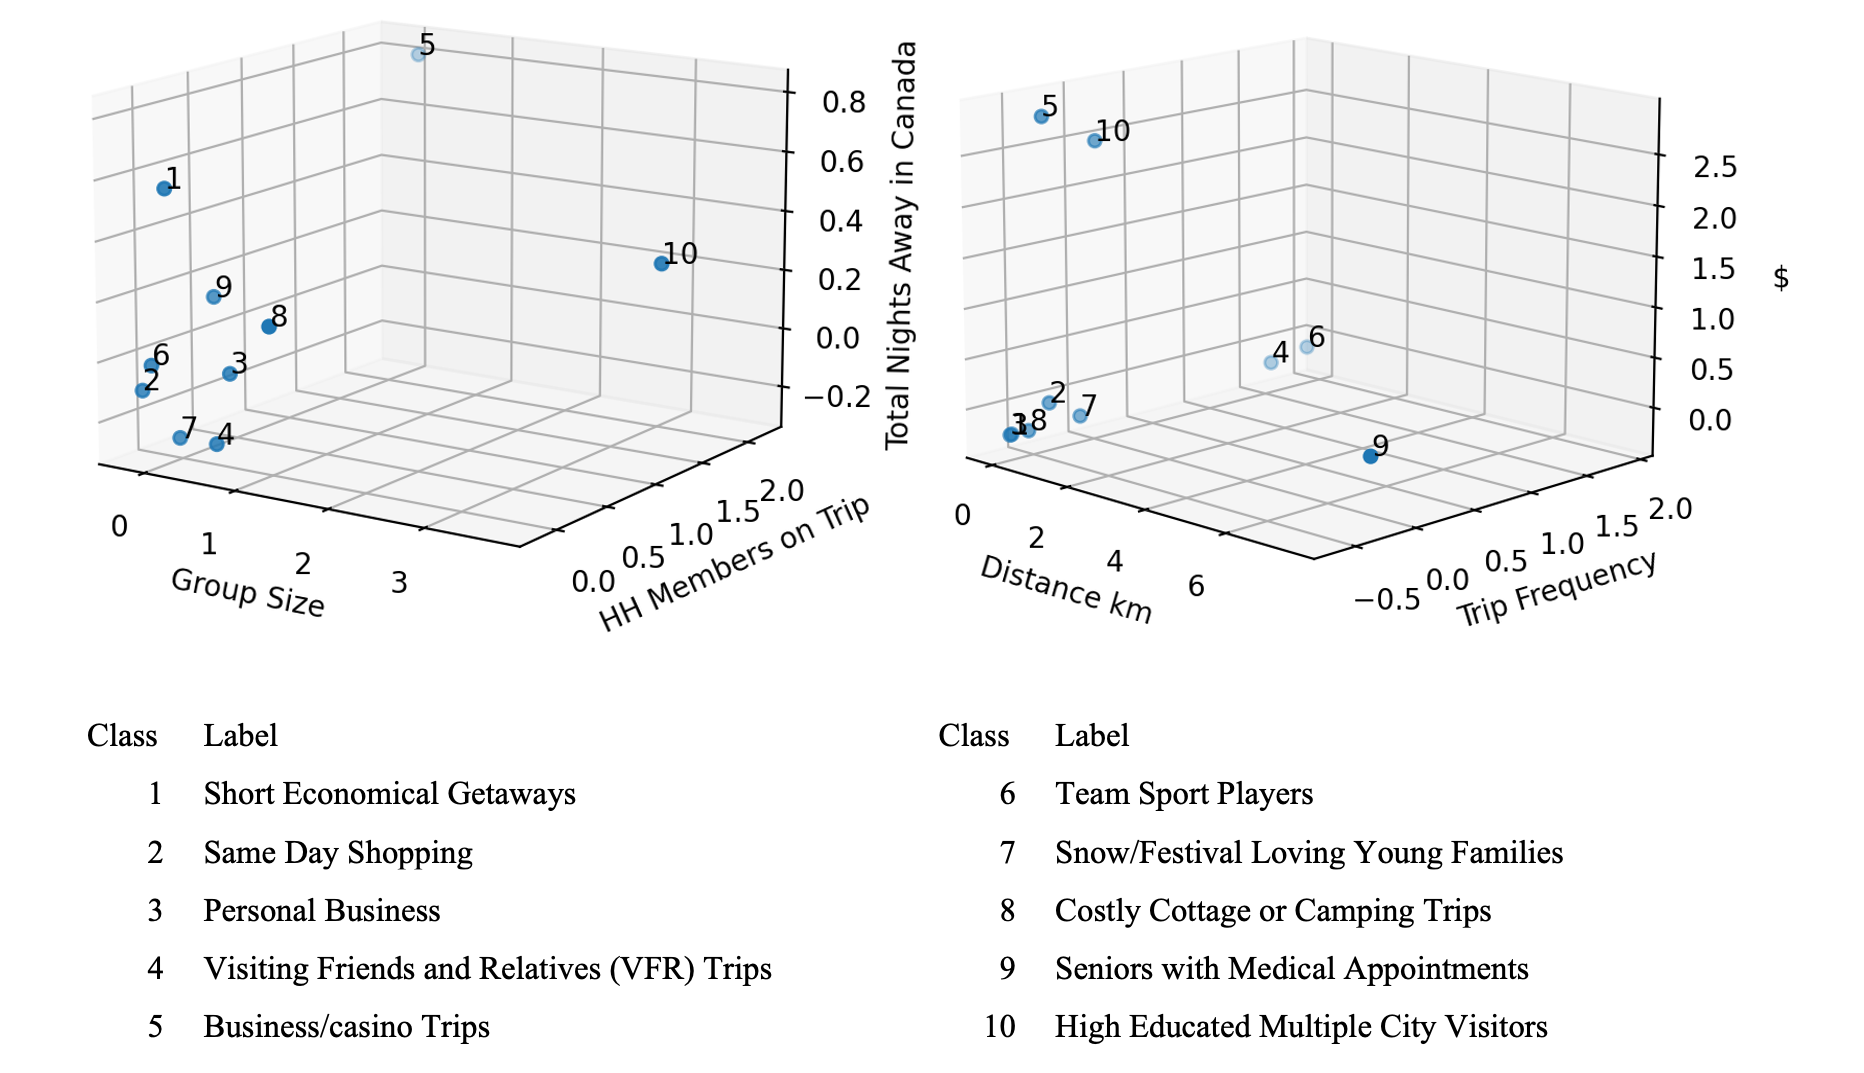
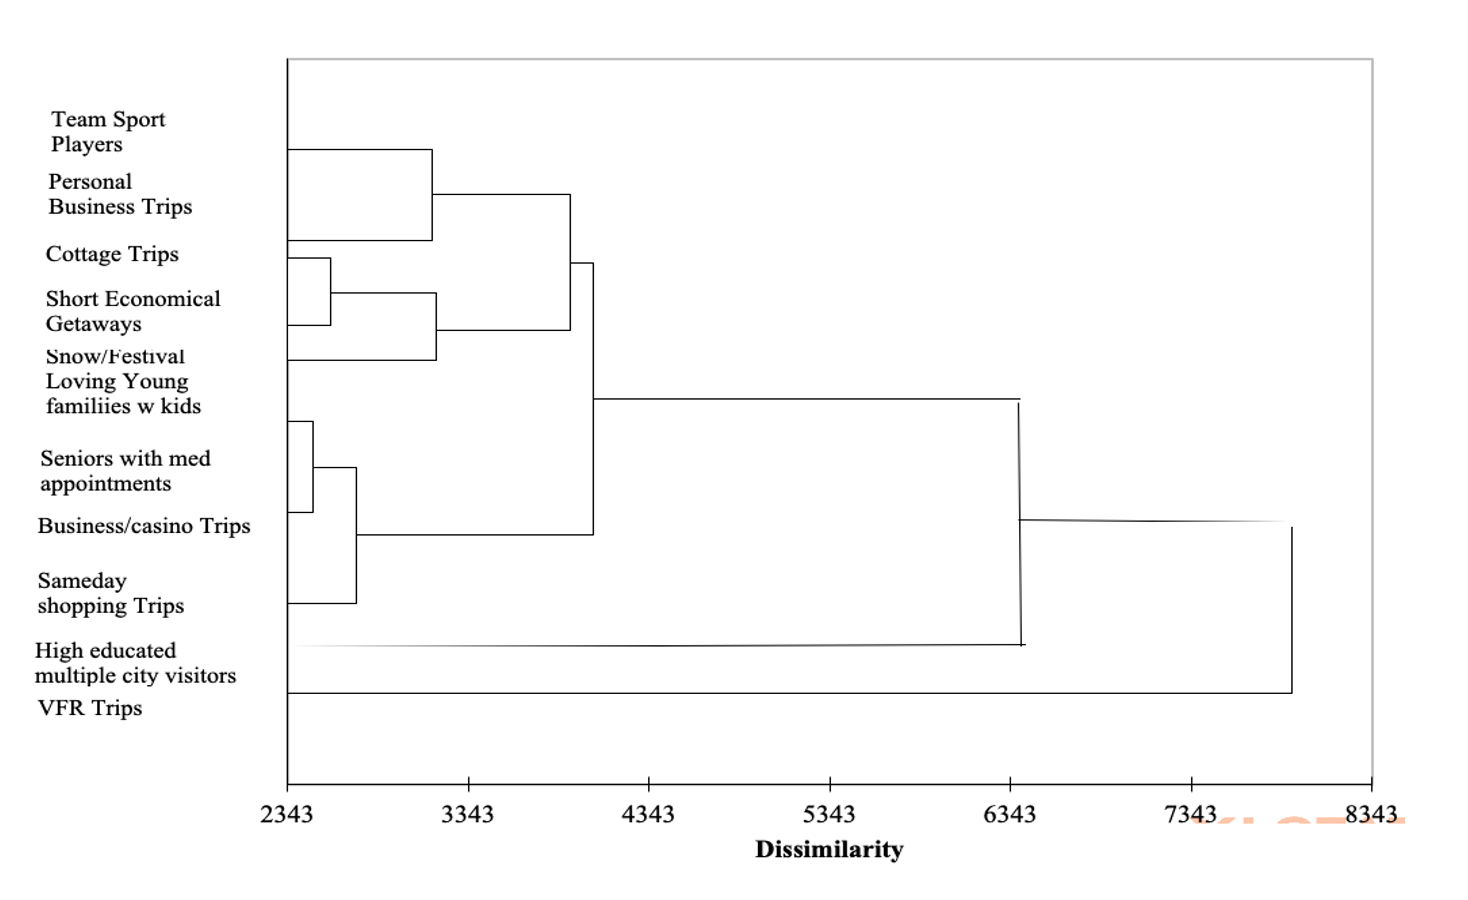
Table 3 describes 10 clusters found in the 2017 data set followed by Figure 2 which is a 3D representation of clusters’ center points across some of the most important dimensions (for brevity). Figure 3 represents a dendrogram of classes hierarchy found through (AHC) clustering.

Table 3
Table 3:Clusters Found in the 2017 (TSRC) (AB) to (AB) Trips at 68% Confidence Level
Figure 2
Figure 2:3D Representation of 10 Clusters Across a few Key Dimensions: Household (HH) Members on the Trip, Travelling Group Size, Total Nights Away from home while on Trip, One-way Distance from Home in km, Trips Frequency, Total Amount of Spending while on Trip in 2017 $CAD
Figure 3
Figure 3:2017 (TSRC) (AB) to (AB) Trips (AHC) Ward’s Dendrogram

Examinations revealed the data possess a natural structure with 10 clusters at 68% confidence level. Such results are consistent with other literature findings for LD trips (Future Foundation 2015; Birley and Westhead 1990; Mooi and Sarstedt 2011). For example, trips done for pleasure have consistently been found to belong to mostly the top two categories of LDPT. The second largest cluster is representative of individual adults from the same HH who travel in smaller groups with no kids. Their purpose is mainly same-day trips of shopping with moderate levels of spending with activities such as walking. This finding is novel and could be a characteristic of the Province of Alberta, in that malls and shopping centres such as Banff, Lake Louise, West Edmonton mall, or other shopping avenues are also long-distance traveller attractors. The existence of such clusters demonstrates how traditional LDPT trips segmentation through “guessing variables and rechecking” are obsolete and would need to be enhanced using comprehensive clustering approaches targeted for network-based data to better represent the overall LDPT market while relying less on conjecture and assumptions.

Submitted: September 21, 2020 AEST

Accepted: September 21, 2020 AEST

References

Badoe, Daniel A., and Eric J. Miller. 1998. “An Automatic Segmentation Procedure for Studying Variations in Mode Choice Behaviour.” Journal of Advanced Transportation 32 (2): 190–215. https:/​/​doi.org/​10.1002/​atr.5670320205.
Google Scholar
Ben-Akiva, M., and S. Lerman. 1987. Discrete Choice Analysis: Theory and Application to Travel Demand. Cambridge, MA: MIT Press.
Google Scholar
Bezdek, J. C. 1974. “Numerical Taxonomy with Fuzzy Sets.” Journal of Mathematical Biology 1 (1): 57–71. https:/​/​doi.org/​10.1007/​bf02339490.
Google Scholar
Bhat, C. R. 1997a. “An Endogenous Segmentation Mode Choice Model with an Application to Intercity Travel.” Transportation Science 31 (1): 34–48. https:/​/​doi.org/​10.1287/​trsc.31.1.34.
Google Scholar
———. 1997b. “Covariance Heterogeneity in Nested Logit Models: Econometric Structure and Application to Intercity Travel.” Transportation Research Part B: Methodological 31 (1): 11–21. https:/​/​doi.org/​10.1016/​s0191-2615(96)00018-5.
Google Scholar
Birley, S., and P. Westhead. 1990. “Growth and Performance Contrasts between ‘Types’ of Small Firms.” Strategic Management Journal 11 (7): 535–57.
Google Scholar
Carlsson, F. 1999. “Private vs. Business and Rail vs. Air Passengers: Willingness to Pay for Transport Attributes.” In Department of Economics of Goteborg University, Working Paper in Economics No, 14. https:/​/​gupea.ub.gu.se/​handle/​2077/​2679.
Google Scholar
Dunn, J. C. 1974. “Some Recent Investigations of a New Fuzzy Partitioning Algorithm and Its Application to Pattern Classification Problems.” Journal of Cybernetics 4 (2): 1–15. https:/​/​doi.org/​10.1080/​01969727408546062.
Google Scholar
Everitt, B. S., S. Landau, and M. Leese. 2001. Cluster Analysis. 4th ed. Arnold, London.
Google Scholar
Federal Highway Administration. 2015. “Foundational Knowledge to Support a Long-Distance Passenger Travel Demand Modeling Framework Part A: Final Report.” http:/​/​rsginc.com/​files/​publications/​Long%20Distance%20Model%20Framework%20Final%20Report.pdf.
Future Foundation. 2015. “Understanding Tomorrow’s Traveller.” http:/​/​www.amadeus.com/​web/​binaries/​blobs/​378/​139/​amadeus-future-traveller-tribes-2030-report.pdf.
Gite, Akhil V. 2013. “ANFIS Controller and Its Application”.” International Journal of Engineering Research and Technology 2 (ue 2).
Google Scholar
Golob, T. F. 2001. “Joint Models of Attitudes and Behavior in Evaluation of the San Diego I-15 Congestion Pricing Project.” Transportation Research Part A: Policy and Practice 35 (6): 495–514. https:/​/​doi.org/​10.1016/​s0965-8564(00)00004-5.
Google Scholar
Golob, T. F., and D. A. Hensher. 1998. “Greenhouse Gas Emissions and Australian Commuters’ Attitudes and Behavior Concerning Abatement Policies and Personal Involvement.” Transportation Research Part D: Transport and Environment 3 (1): 1–18. https:/​/​doi.org/​10.1016/​s1361-9209(97)00006-0.
Google Scholar
Hassanvand, M. 2020. “Adjusting Logit Model Estimation Results Obtained with Stated Preference Data.” International Journal of Scientific & Engineering Research Volume 11 (June 6). https:/​/​www.ijser.org/​onlineResearchPaperViewer.aspx?Adjusting-Logit-Model-Estimation-Results-Obtained-with-Stated-Preference-Data.pdf.
Google Scholar
Hensher, D.A. 1991. “Efficient Estimation of Hierarchical Logit Mode Choice Models.” Proceedings of the Japanese Society of Civil Engineering 425 (IV–14): 17–28. http:/​/​library.jsce.or.jp/​jsce/​open/​00037/​425/​425-120617.pdf.
Google Scholar
Kaufman, Leonard, and Peter J. Rousseeuw, eds. 1990. Finding Groups in Data. Wiley Series in Probability and Statistics. New York: John Wiley & Sons, Inc. https:/​/​doi.org/​10.1002/​9780470316801.
Google Scholar
Kizielewicz, Joanna, Anntti Haahti, Tihomir Luković, and Daniela Gračan. 2017. “The Segmentation of the Demand for Ferry Travel - a Case Study of Stena Line.” Economic Research-Ekonomska Istraživanja 30 (1): 1003–20. https:/​/​doi.org/​10.1080/​1331677x.2017.1314789.
Google Scholar
Koppelman, F.S., and V. Sethi. 2000. “Incorporating Complex Substitution Patterns and Variance Scaling in Long-Distance Travel Choice Behavior.” Paper presented at the 9th International Association on Travel Behavior Research Conference, July 2-7, 2000, Goldcoast, Gueenslan.
Kumar, Mukesh, Pradip Sarkar, and Errampalli Madhu. 2013. “Development Fuzzy Logic-Based Model Mode Choice Model Considering Various Public Transport Policy.” IJTTE 3 (4): 408–25. https:/​/​doi.org/​10.7708/​ijtte.2013.3(4).05.
Google Scholar
LaMondia, J., C. Bhat, and D. Hensher. 2008. “An Annual Time Use Model for Domestic Vacation Travel.” Journal of Choice Modeling 1 (1): 70–97. http:/​/​www.jocm.org.uk/​index.php/​JOCM/​article/​viewFile/​38/​15.
Google Scholar
Larse, Nynne. 2010. Market Segmentation - A Framework for Determining the Right Target Customers. Published Thesis. Aarhus School of Business.
Google Scholar
Lieberman, William, Dave Schumacher, Alan Hoffman, and Christopher Wornum. 2001. “Creating a New Century of Transit Opportunity: Strategic Planning for Transit.” Transportation Research Record: Journal of the Transportation Research Board 1747 (1): 60–67. https:/​/​doi.org/​10.3141/​1747-08.
Google Scholar
Limtanakool, N., M. Dijst, and T. Schwanen. 2006. “The Influence of Socioeconomic Characteristics, Land Use and Travel Time Considerations on Mode Choice for Medium- and Longer-Distance Trips.” Journal of Transport Geography 14 (5): 327–41. https:/​/​doi.org/​10.1016/​j.jtrangeo.2005.06.004.
Google Scholar
Mandel, B., M. Gaudry, and W. Rothengatter. 1997. “A Disaggregate Box-Cox Logit Mode Choice Model of Intercity Passenger Travel in Germany and Its Implications for High-Speed Rail Demand Forecasts.” The Annals of Regional Science 31 (2): 99–120. https:/​/​doi.org/​10.1007/​s001680050041.
Google Scholar
Milligan, Glenn W. 1996. “Clustering Validation: Results and Implications for Applied Analyses.” In Clustering and Classification, 341–75. Singapore: World Scientific. https:/​/​doi.org/​10.1142/​9789812832153_0010.
Google Scholar
Mooi, E., and M. Sarstedt. 2011. “A Concise Guide to Market Research Chapter 8.” Springer-Verlag Berlin Heidelberg.
Morrison, S.A., and C. Winston. 1985. “An Econometric Analysis of the Demand for Intercity Passenger Transportation.” In Research in Transportation Economics: A Research Annual, edited by T.E. Keeler, 2:213-237,. Greenwich, Connecticut: JAI Press.
Google Scholar
Posse, C. 1998. “Hierarchical Model-Based Clustering for Large Data Sets.” Technical report,. University of Minnesota, School of Statistics.
Punj, Girish, and David W. Stewart. 1983. “Cluster Analysis in Marketing Research: Review and Suggestions for Application.” Journal of Marketing Research 20 (2): 134–48. https:/​/​doi.org/​10.1177/​002224378302000204.
Google Scholar
Roxas, Nicannor R. 2016. “Application of Artificial Neural Network to Trip Attraction of Condominiums in Metro Manila”.” In Proceedings of the 23rd Annual Conference of the Transportation Science Society of the Philippines. Quezon City, Philippines: TSSP.
Google Scholar
Sarkar, Amrita. 2012. “Application of Fuzzy Logic in Transport Planning.” International Journal on Soft Computing (IJSC) 3 (2): 1–21. https:/​/​doi.org/​10.5121/​ijsc.2012.3201.
Google Scholar
Statistics Canada. 2017a. “Labour Force Survey.” https:/​/​www150.statcan.gc.ca/​n1/​daily-quotidien/​180105/​dq180105a-eng.htm.
———. 2017b. “Travel Survey of Residents of Canada.” https:/​/​www.statcan.gc.ca/​eng/​survey/​household/​3810.
Tharwat, O.S. 2014. “Identification of Uncertain Nonlinear MIMO Spacecraft Systems Using Coactive Neuro Fuzzy Inference System (CANFIS).” International Journal of Control, Automation, and Systems Vol. 3 (2).
Google Scholar
Travel Demand Modelling. 2016. “Transport and Infrastructure Council, National Guidelines for Transport System Management in Australia.” https:/​/​ngtsmguidelines.files.wordpress.com/​2014/​08/​ngtsm2016-t1_travel_demand_modelling.pdf.
Wardman, M., J. P. Toner, and G. A. Whelan. 1997. “Interactions between Rail and Car in the Inter-Urban Leisure Travel Market in Great Britain.” Journal of Transport Economics and Policy 31 (2): 163–81.
Google Scholar
Yaldi et al. n.d. “Developing a Fuzzy-Neuro Model for Travel Demand Modelling.”
Zadeh, L.A. 1965. “Fuzzy Sets.” Information and Control 8 (3): 338–53. https:/​/​doi.org/​10.1016/​s0019-9958(65)90241-x.
Google Scholar
Zaki, Mohammed J., and Wagner Meira, Jr. 2014. Data Mining and Analysis: Fundamental Concepts and Algorithms. New York, NY: Cambridge University Press. https:/​/​doi.org/​10.1017/​cbo9780511810114.
Google Scholar

This website uses cookies

We use cookies to enhance your experience and support COUNTER Metrics for transparent reporting of readership statistics. Cookie data is not sold to third parties or used for marketing purposes.

Powered by Scholastica, the modern academic journal management system