
1. Questions
Disasters and their related evacuations cause massive disruptions to people’s mobility. Yet these post-disaster transportation challenges are understudied because these data are hard to gather, and transportation research offers few methods for measuring people’s cumulative transportation needs (Gould-Werth et al. 2018). In the limited literature on disaster-related transportation experiences, prior studies have traditionally used socioeconomic characteristics and/or car ownership as proxies to identify individuals with unmet transportation needs (Grajdura et al. 2026). Identifying need through these characteristics alone, or even in combination, may overlook lived experience, which adds nuance and distinctions in who is affected and how it affects their lives in material and relational ways. The Transportation Security Index (TSI), a new composite metric, centers the lived experience of transportation insecurity by defining levels of insecurity based on responses to a series of questions about forgoing travel and activities. The TSI aims to capture being “unable to regularly move from place to place in a safe or timely manner” (Gould-Werth et al. 2018, 1), and how limited mobility affects personal relationships and material opportunities.
Transit riders are more vulnerable to transportation system disruptions during disasters (Renne et al. 2009; Renne and Mayorga 2022). Thus, we surveyed transit riders in Los Angeles after the 2025 wildfires and combined their responses into the three-question TSI (Murphy, Griffin, et al. 2025).
Using this case study of transit riders after the 2025 Los Angeles wildfires, we ask:
-
To what extent did transit riders experience transportation insecurity in the month following the 2025 Los Angeles wildfires?
-
What evacuation, transportation, housing, and sociodemographic factors were associated with post-wildfire transportation insecurity?
2. Methods
2.1. Study area
Our work is set in Los Angeles County, where multiple fast-moving fires struck densely populated areas in early January 2025, triggering evacuations and devastating communities (Palm et al. 2026). Public transit services, especially buses, were severely disrupted after the fires, while smoke, debris, and particulate matter created hazardous street-level conditions (Withers et al. 2025). The disruption affected Los Angeles for weeks after the initial ignition with dangerous wind conditions continuing through January 22, and the Los Angeles County Metropolitan Transportation Authority pausing fare collection through January 27, 2025.
2.2. The Transportation Security Index
Modeled after the food security index, the transportation security index is derived from a series of questions about how often a person has experienced material and relational transportation problems in the past 30 days. Research has most commonly applied the TSI to measure individual-level change from a particular transportation intervention (Palm et al. 2025; Rodier et al. 2025), and to measure overall transportation insecurity prevalence across populations (Lee et al. 2026; Murphy, Griffin, et al. 2025).
We used the TSI-3 version, based on three questions:
-
How often did you skip going somewhere because of a problem with transportation?
-
How often were you not able to leave the house when you wanted to because of a problem with transportation?
-
How often did problems with transportation affect your relationships with others?
Response options include ‘never,’ ‘sometimes’, or ‘often’. Each response is coded from 0-2, summed, and categorized: above 1 is “insecure,” and 1 or below is “secure” (Murphy et al. 2025). This index provides a quantitative measure of transportation insecurity that can be consistently replicated across applications. (see supplemental material).
We lacked data about respondents’ pre-disaster transportation insecurity, so we cannot measure how the wildfire changed someone’s insecurity status. However, understanding who is transport insecure and analyzing how insecurity status is associated with disaster-specific factors such as evacuation provides valuable insight on people’s post-disaster experience and can inform the prioritization of post-disaster resources.
2.3. Survey Data and Model Specification
We rapidly deployed a survey advertised through Transit App to users in LA County in February 2025 (deployment details in supplemental information). The survey asked about people’s evacuation decision-making, pre-fire travel behavior, pre- and post-fire housing status, the TSI questions, and socio-demographics. Respondents completed the survey approximately 30 days after the fires began, allowing them to answer the TSI questions for the post-disaster period. We estimated a logistic regression model predicting the likelihood of transportation insecurity as a binary outcome, where an odds ratio greater than 1 indicates higher odds of transportation insecurity.
3. Findings
Who experienced transportation insecurity?
Forty-one percent of respondents experienced transportation insecurity in the post-disaster period (Table 1). Evacuees were approximately twice as likely to be insecure as non-evacuees, even though the majority of evacuees in our sample (75%) had returned home in the post-disaster period. People living in some form of temporary housing (homelessness, shelter, or moving around) in the pre-disaster period were nearly twice as likely to be transportation insecure as homeowners or renters. Extremely low-income respondents had more insecurity than higher-income groups. Insecurity prevalence increases with age.
Respondents who used ridehail more frequently before the wildfire, as well as those who got rides from others, showed notably higher rates of insecurity than frequent transit users. Car owners experienced lower transportation insecurity than carless survey respondents. Although car ownership was weakly correlated with frequently getting rides from others, variance inflation factors remained low, suggesting that multicollinearity was not a major concern when these measures were included as separate predictors.
What factors were associated with transportation insecurity?
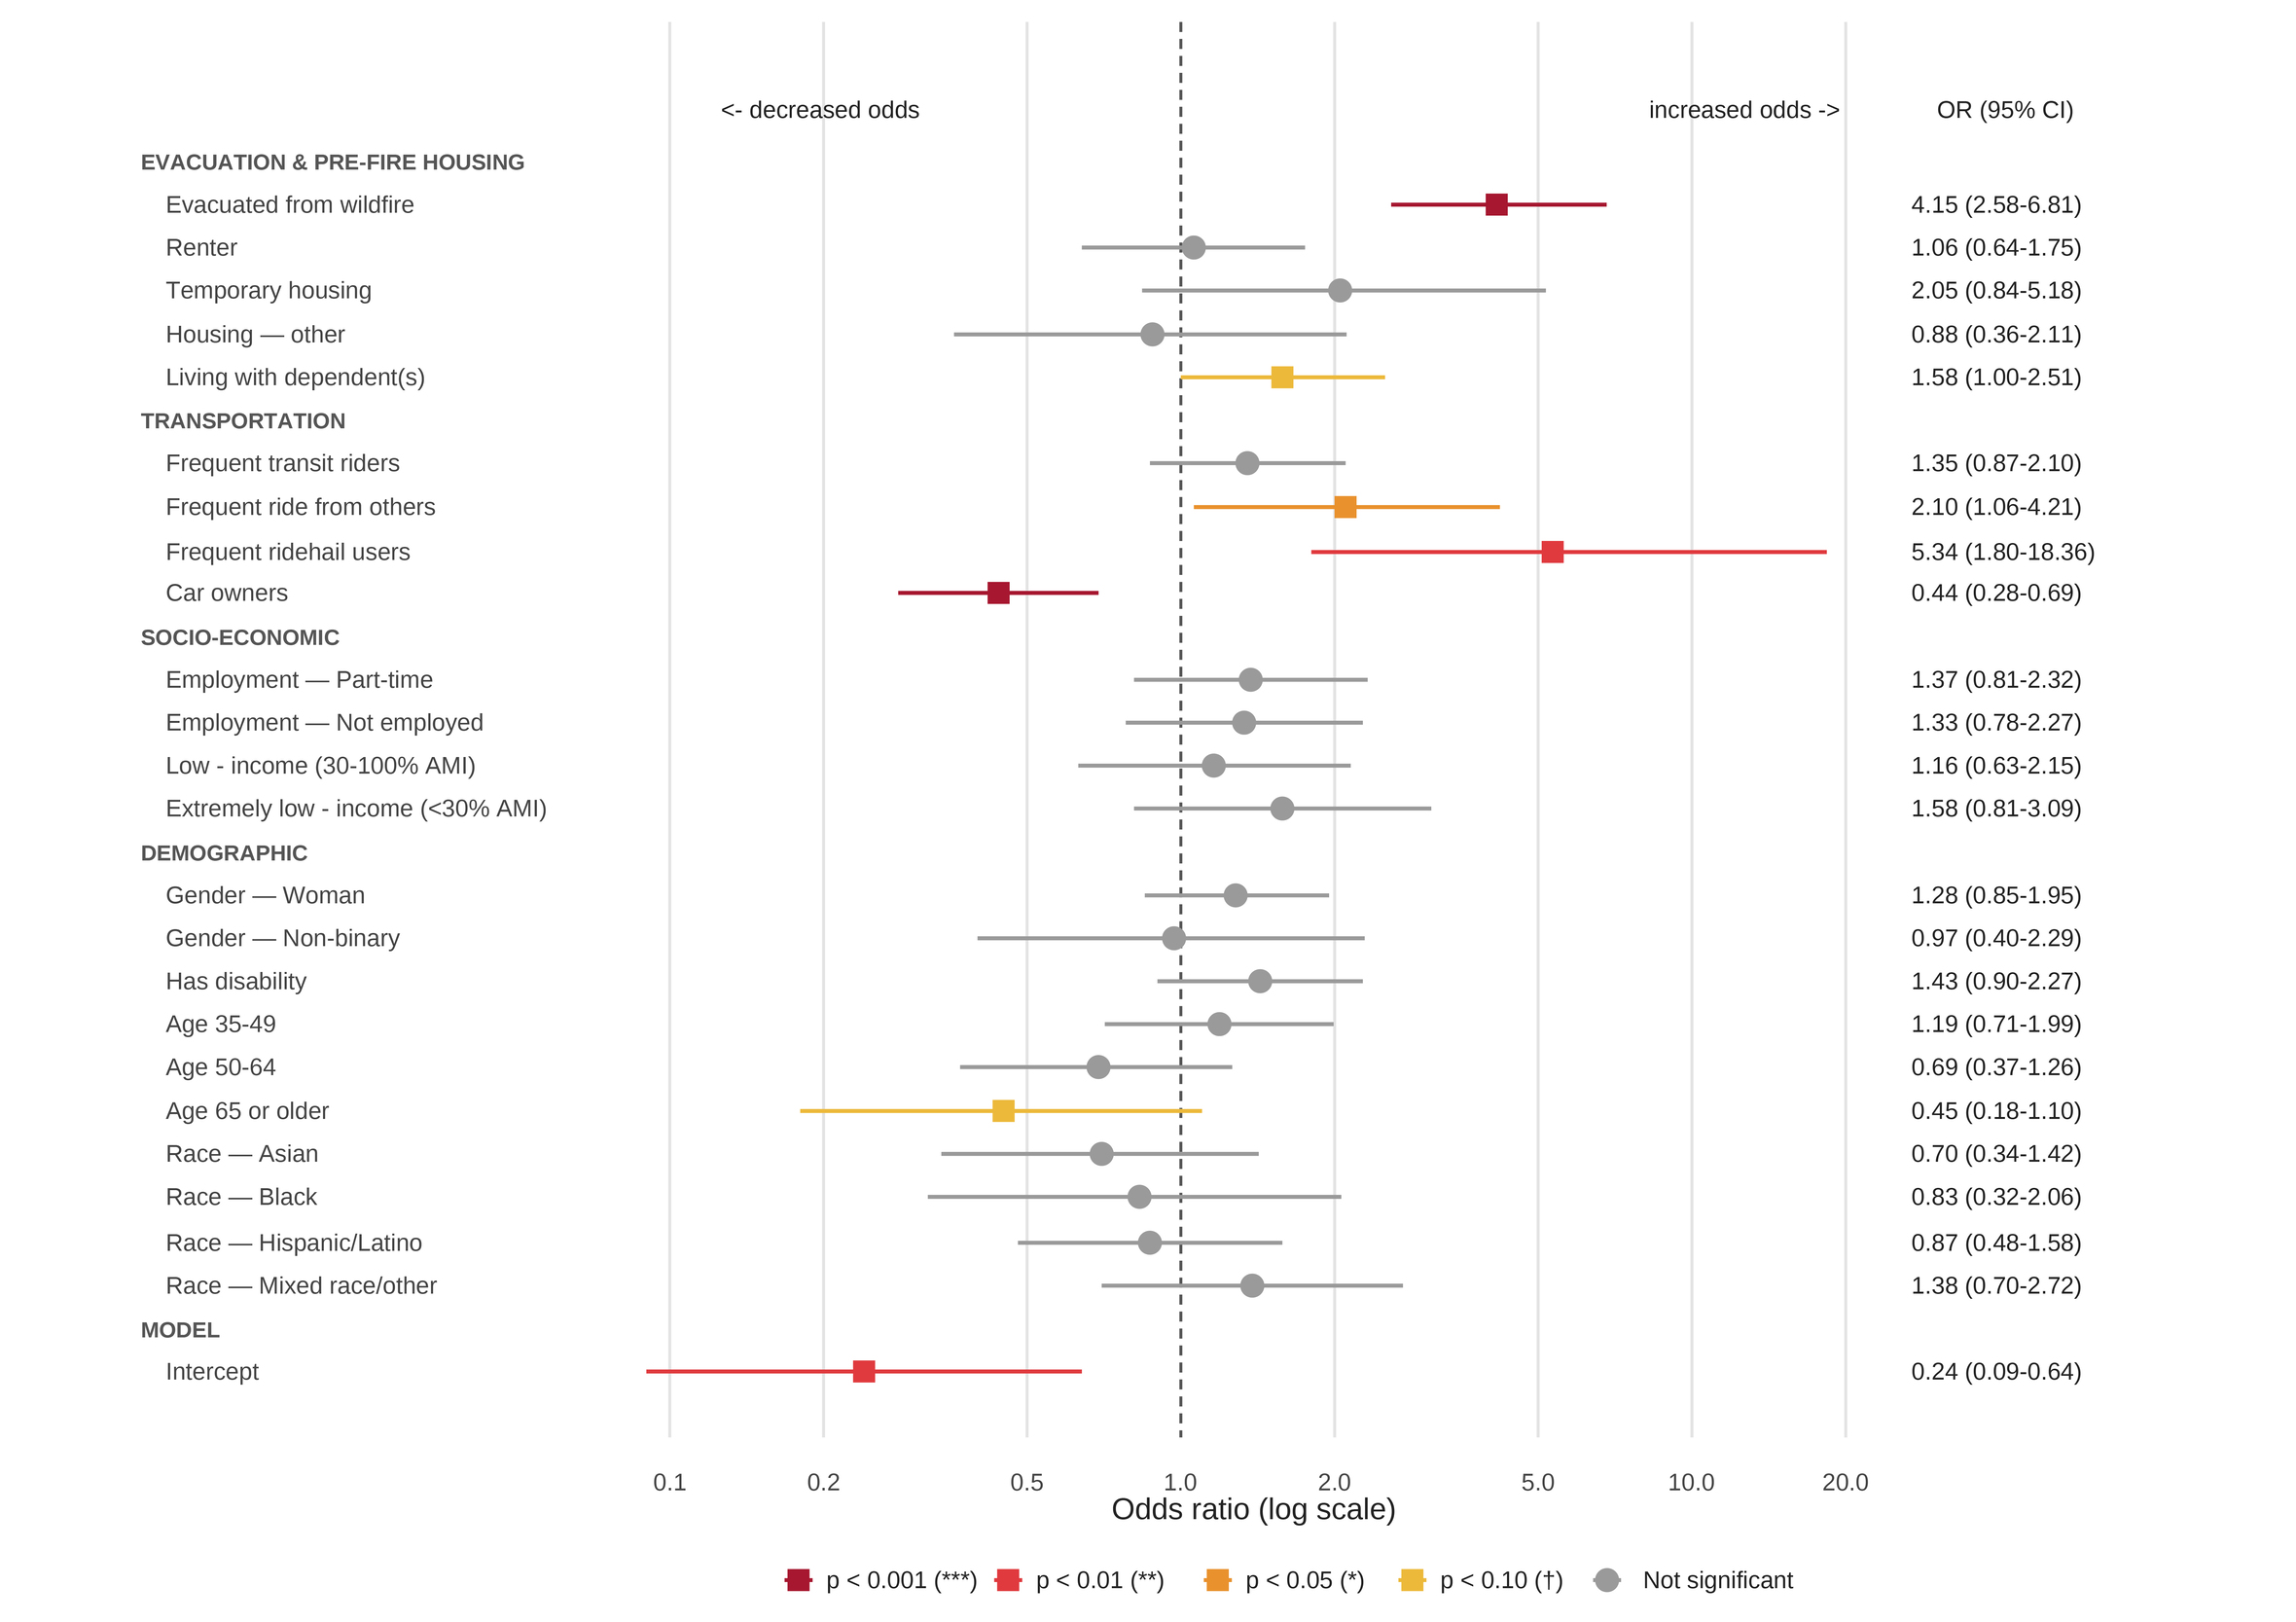
Controlling for transportation, housing, evacuation, and other socio-demographic factors, we find that evacuation status was strongly and most clearly associated with post-disaster transportation insecurity (Figure 1). Evacuees had nearly four times the odds of reporting transportation insecurity compared to non-evacuees. Frequently getting rides from others and using ridehail were similarly associated with higher odds of insecurity, but with wider confidence intervals than evacuation status. In comparison, owning a car and being over age 65 were associated with lower odds of insecurity.
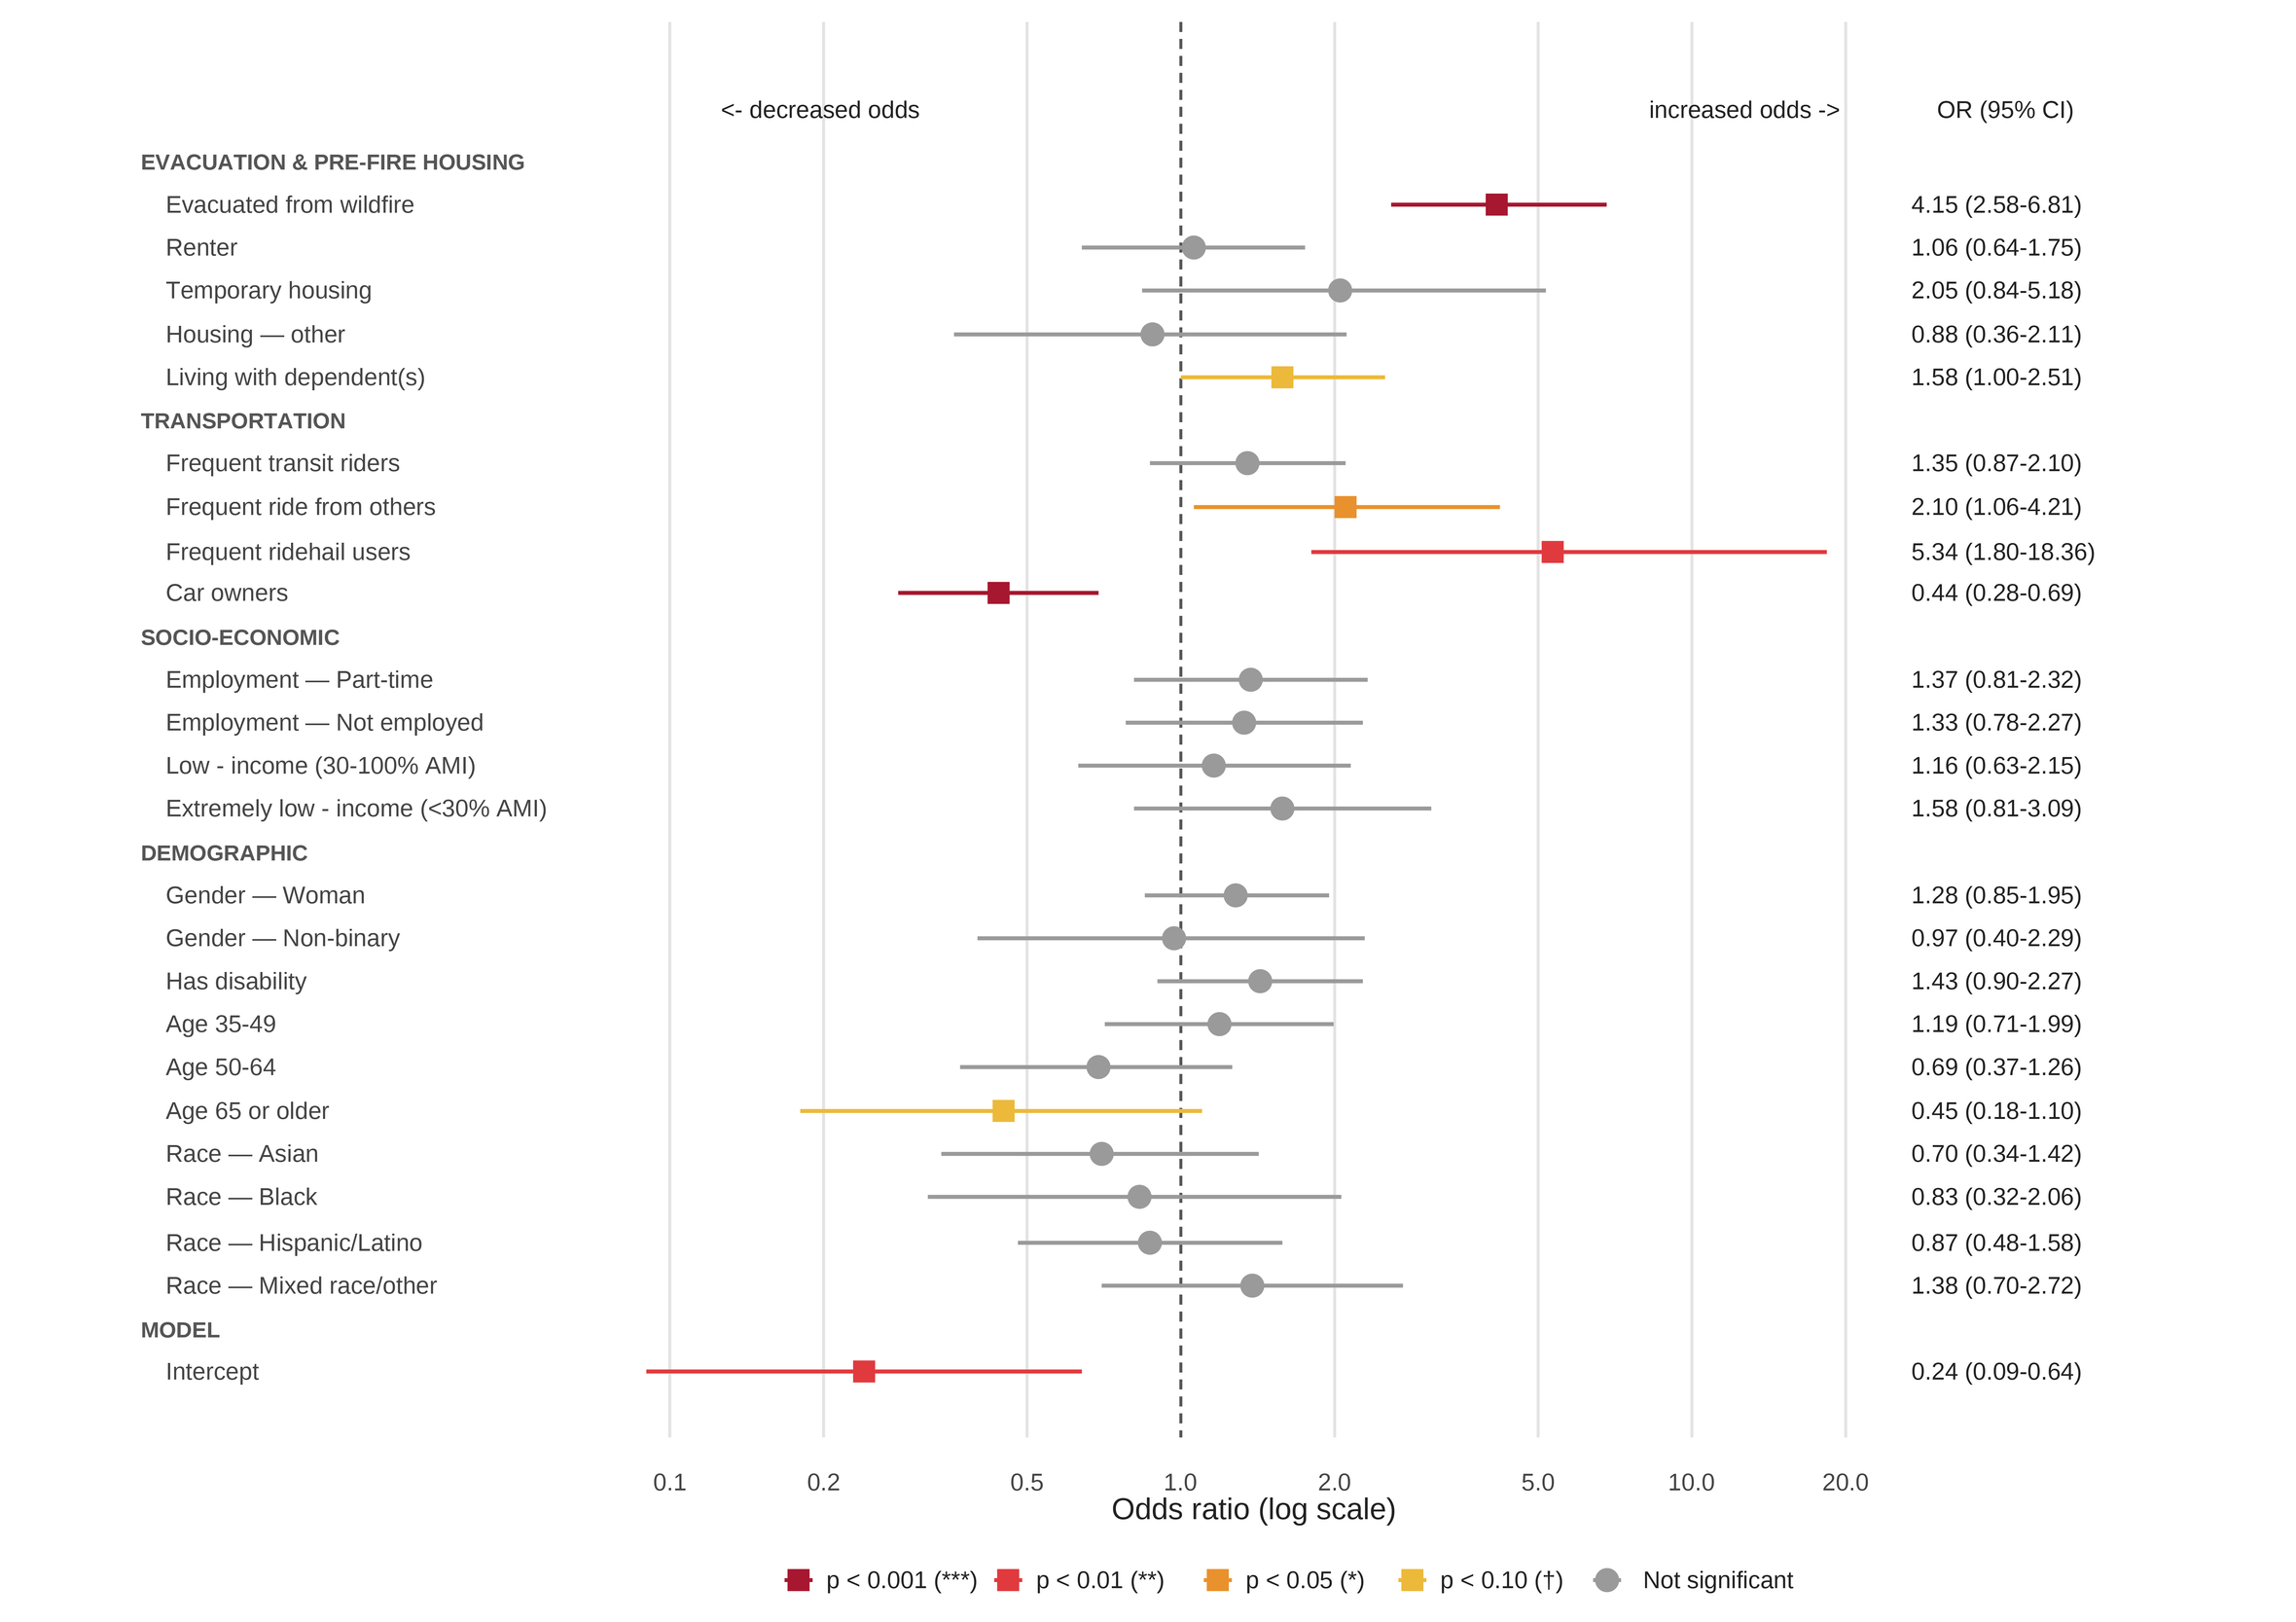
Income did not significantly predict insecurity, which contrasts with previous TSI studies (Bader et al. 2025; Murphy, Pilkauskas, et al. 2025; Wileden and Murphy 2025). We conducted a sensitivity analysis and found that, after removing car ownership, income became a significant predictor. This suggests a close relationship between car ownership and income, as would be expected, even as multicollinearity was not identified as a previous model concern.
We find that evacuation status was much more strongly associated with transportation insecurity than car ownership. This evidence suggests that evacuation disrupts people’s movement in the post-disaster period, and that identifying insecurity based on car ownership or other proxies may not fully capture needs. Disaster planning should prioritize ways to provide additional mobility in this acute period as it can lessen the negative effects that insecurity may have on people’s lives.