1. Questions
When presented with two alternative routes in a stated preference design, choosers will select the one advertised as more reliable. For realised choices, travellers must both know and care about journey time reliability in order to observe a significant coefficient on reliability. Does the preference for reliability persist when the same people respond to revealed and stated preference route choice questions?
2. Methods
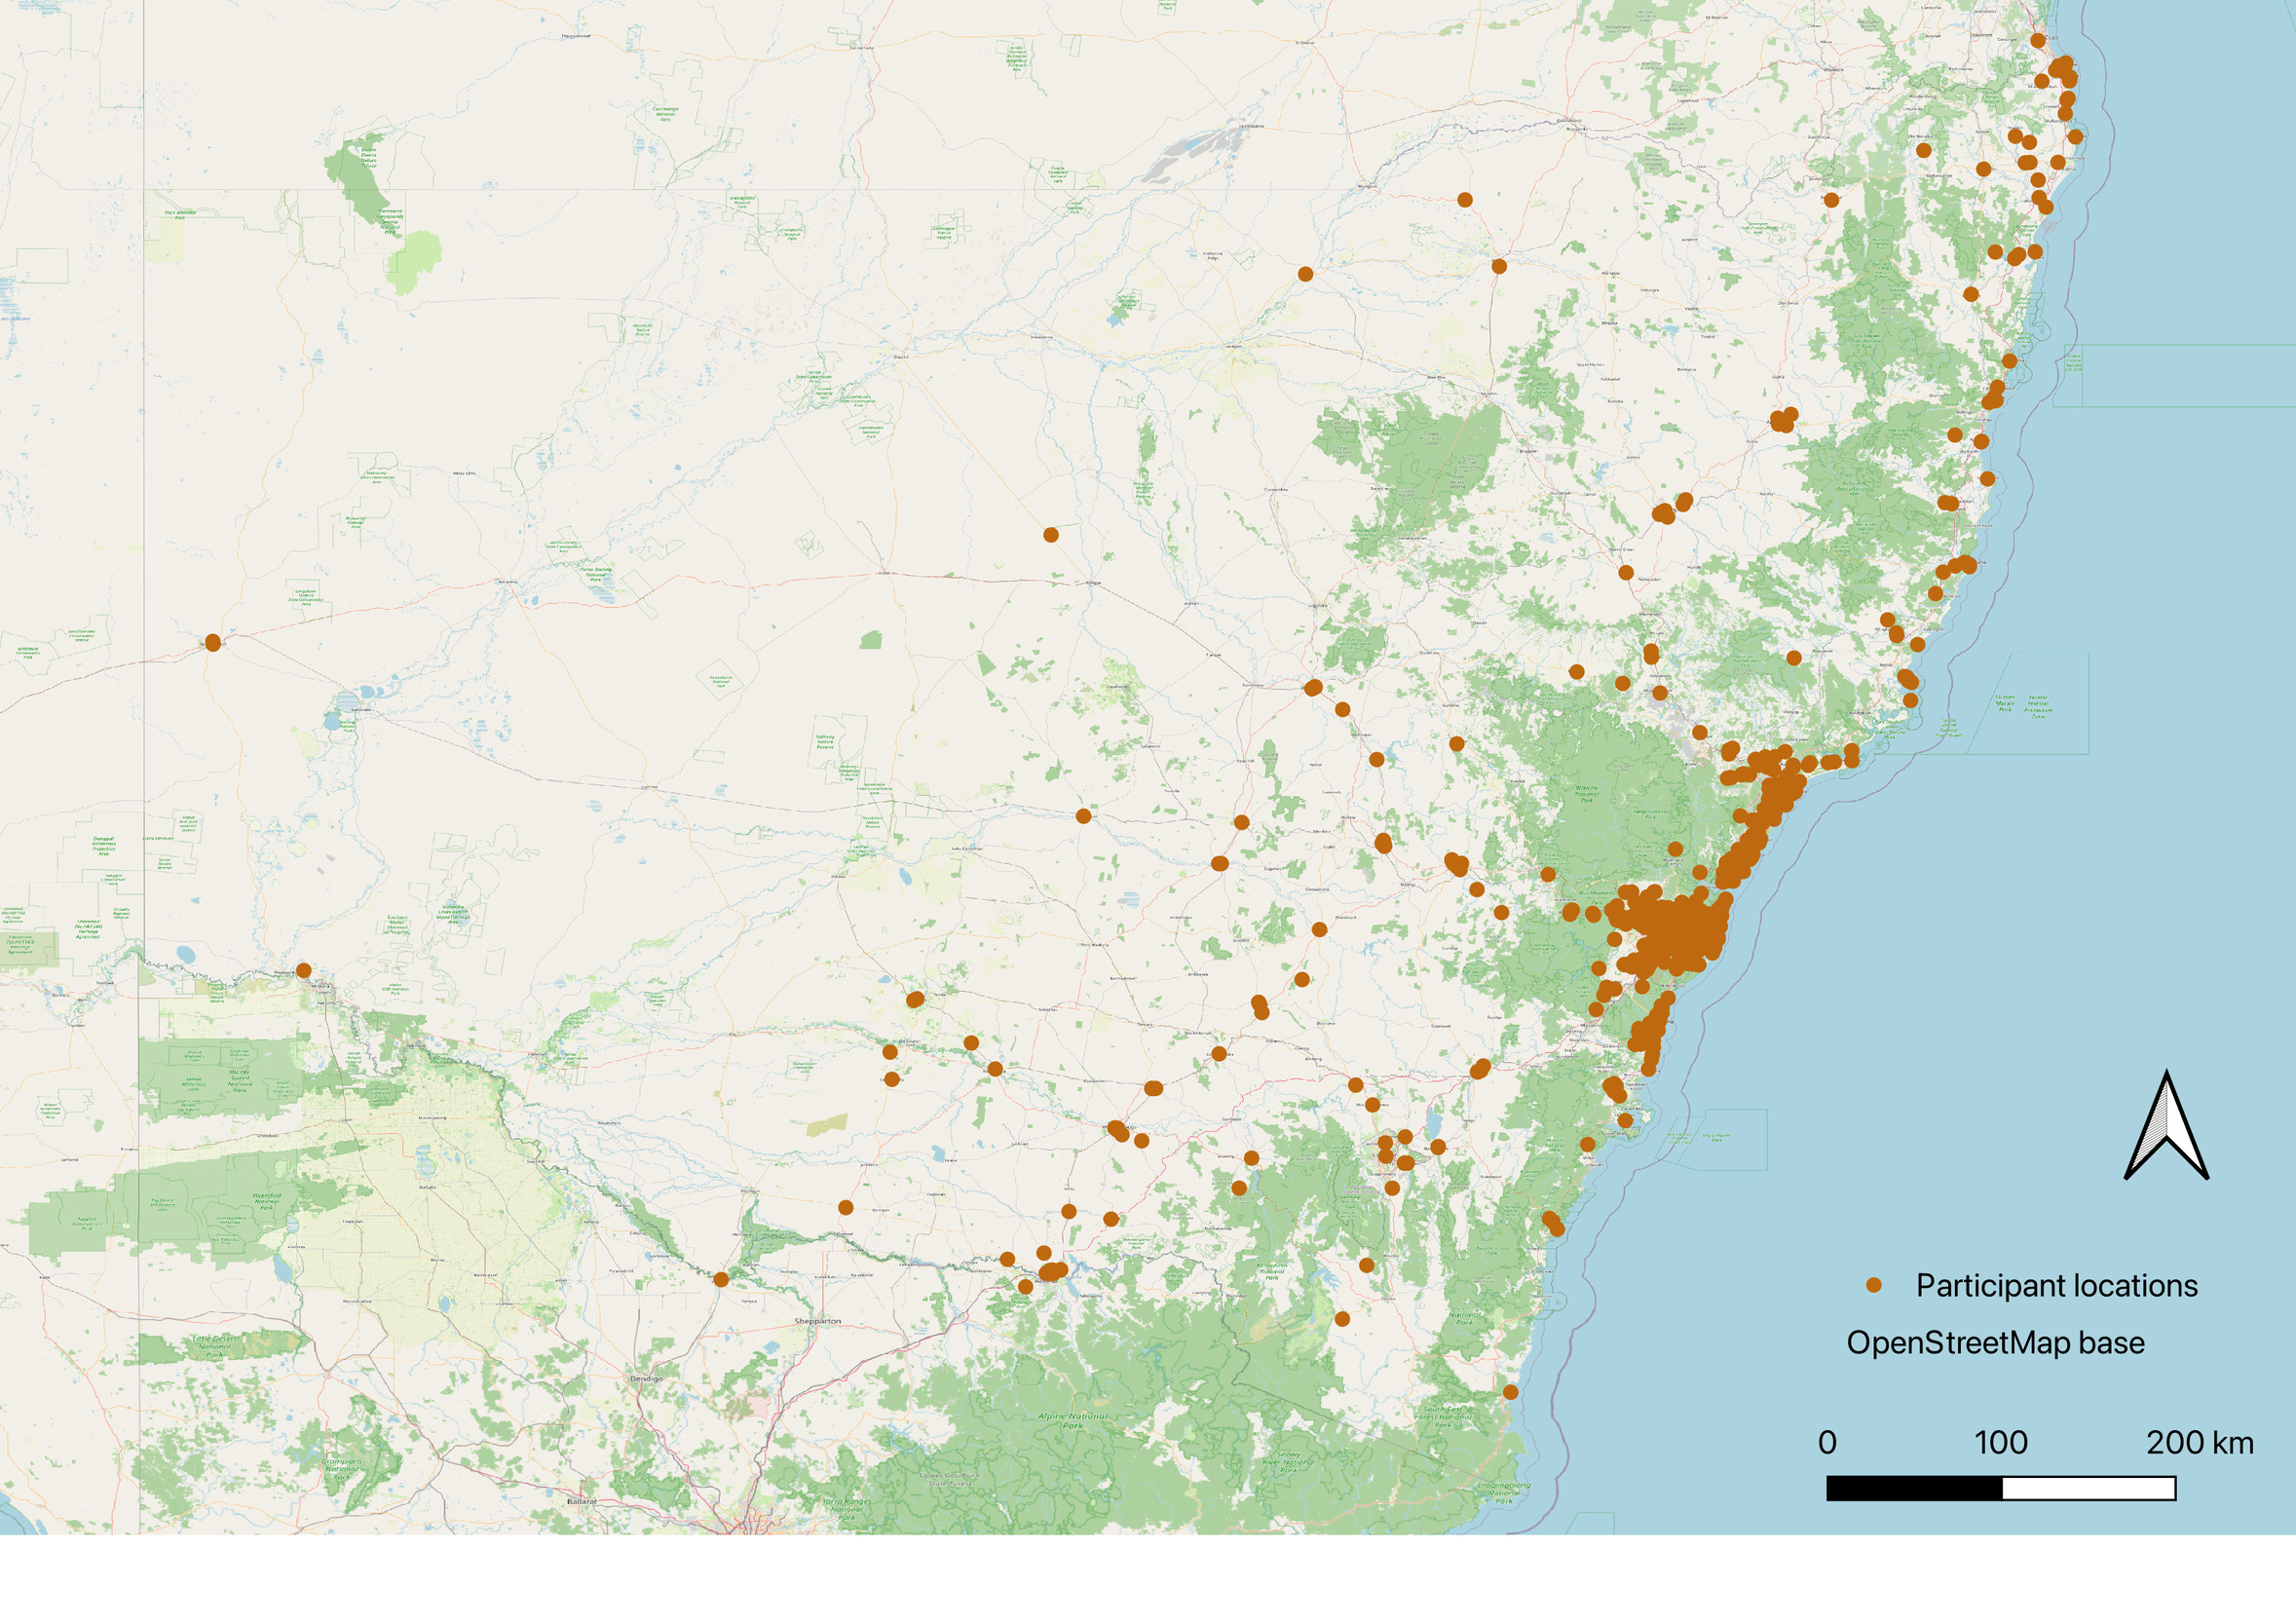
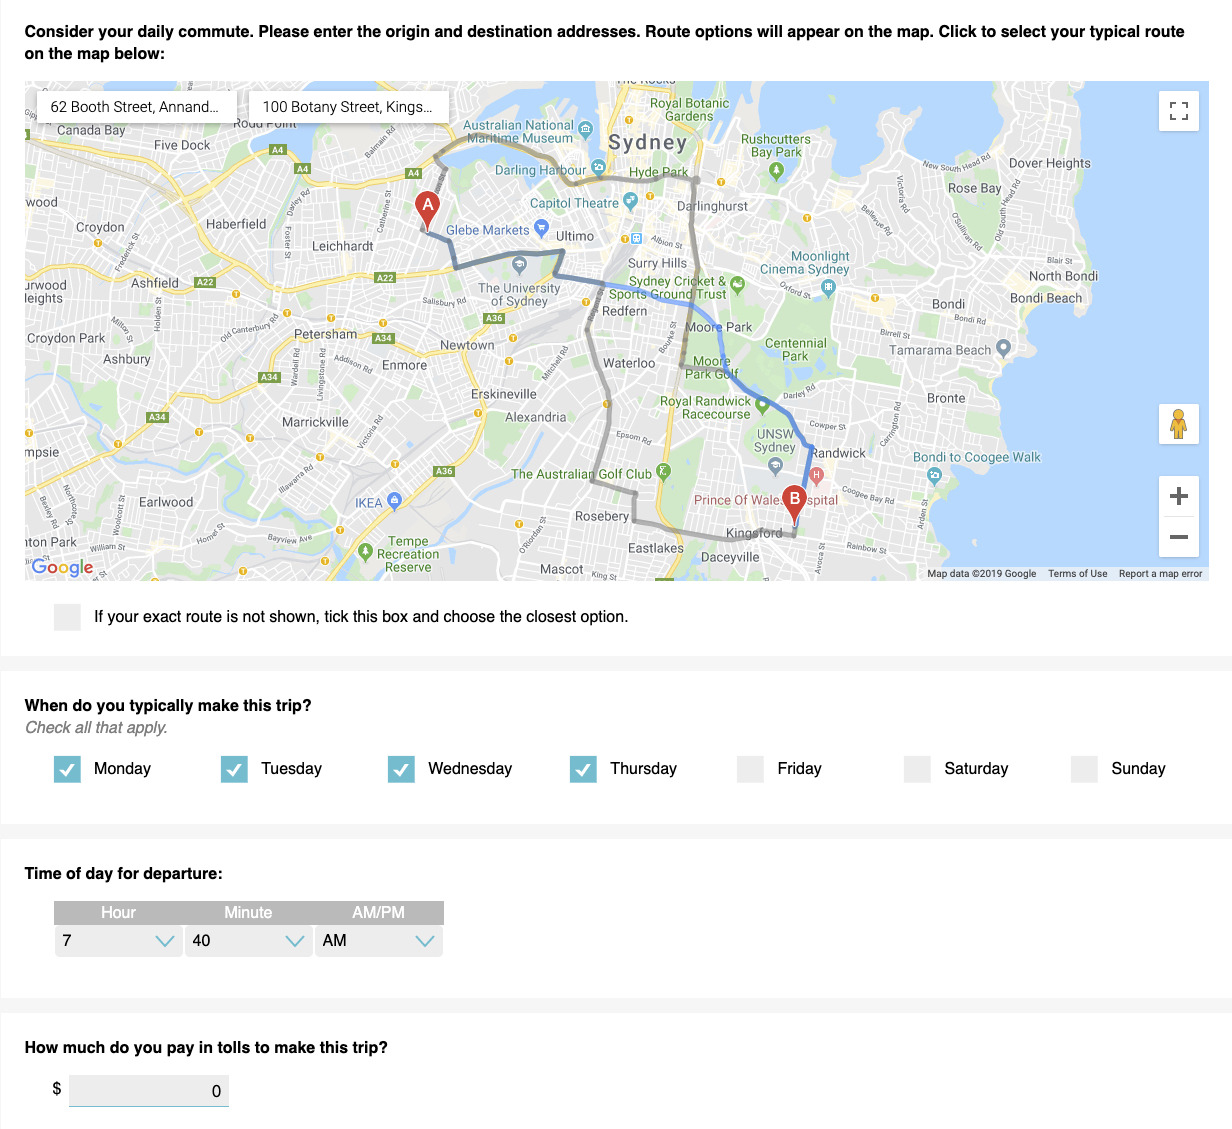
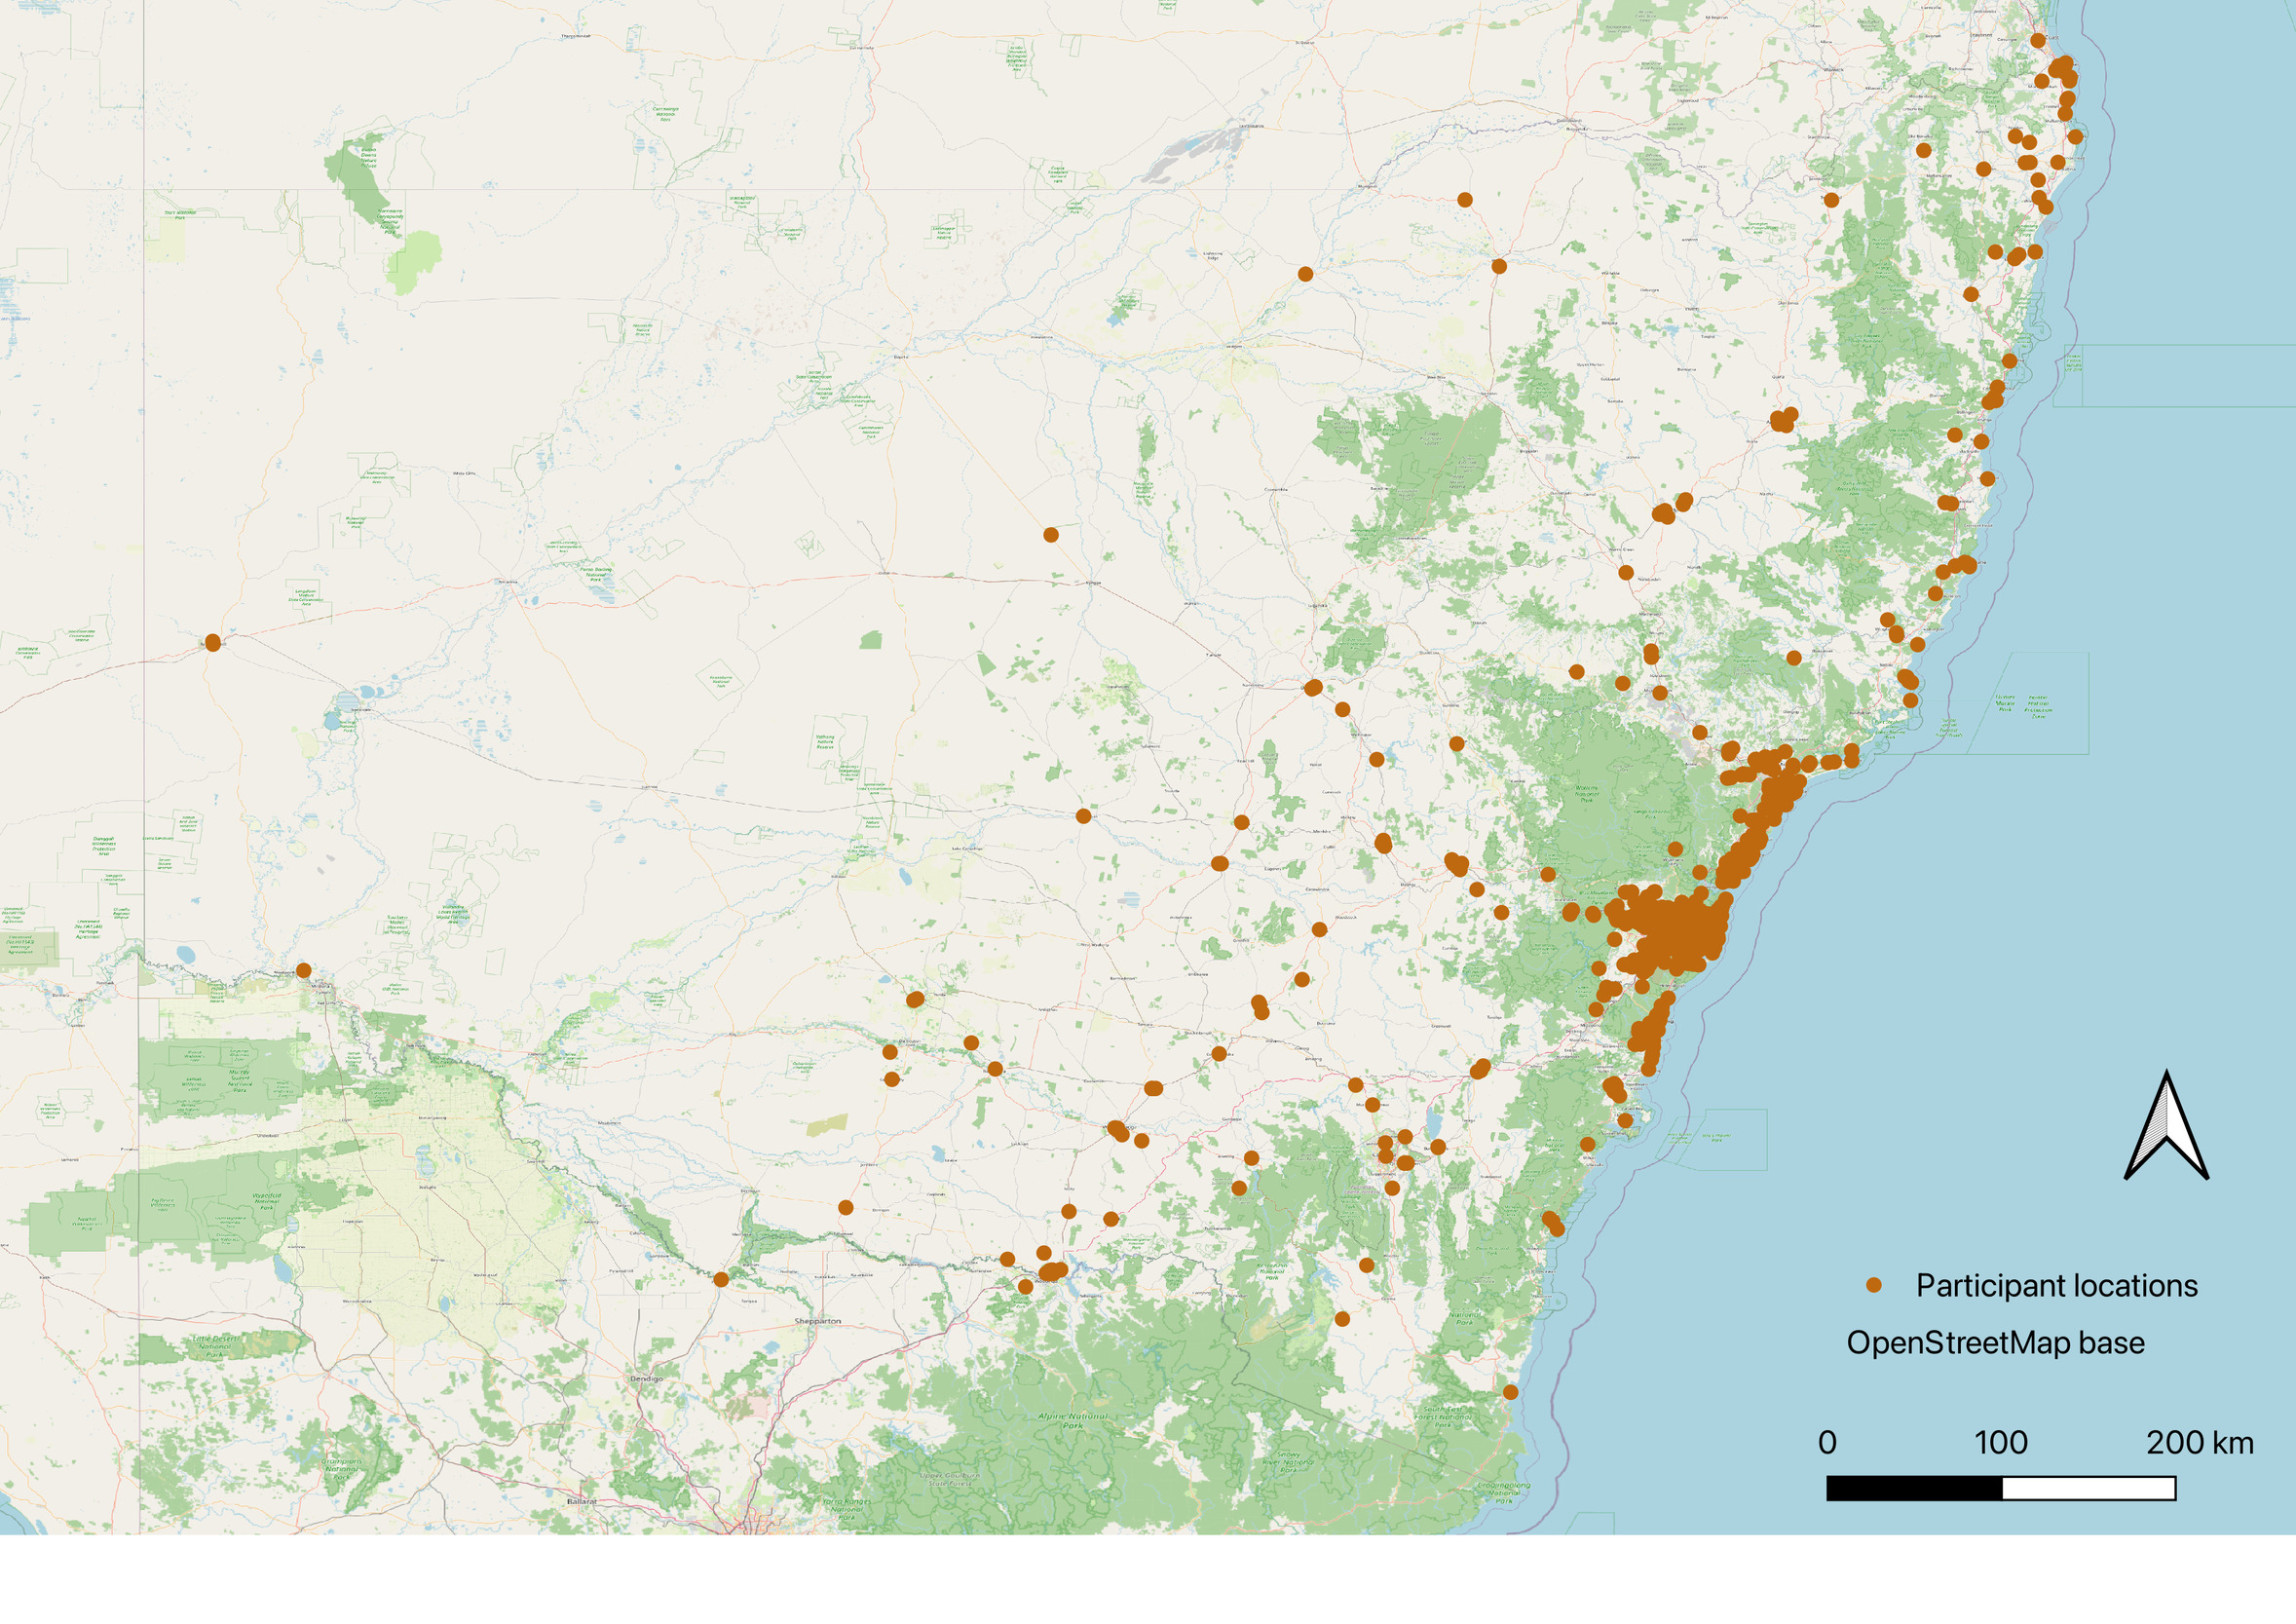
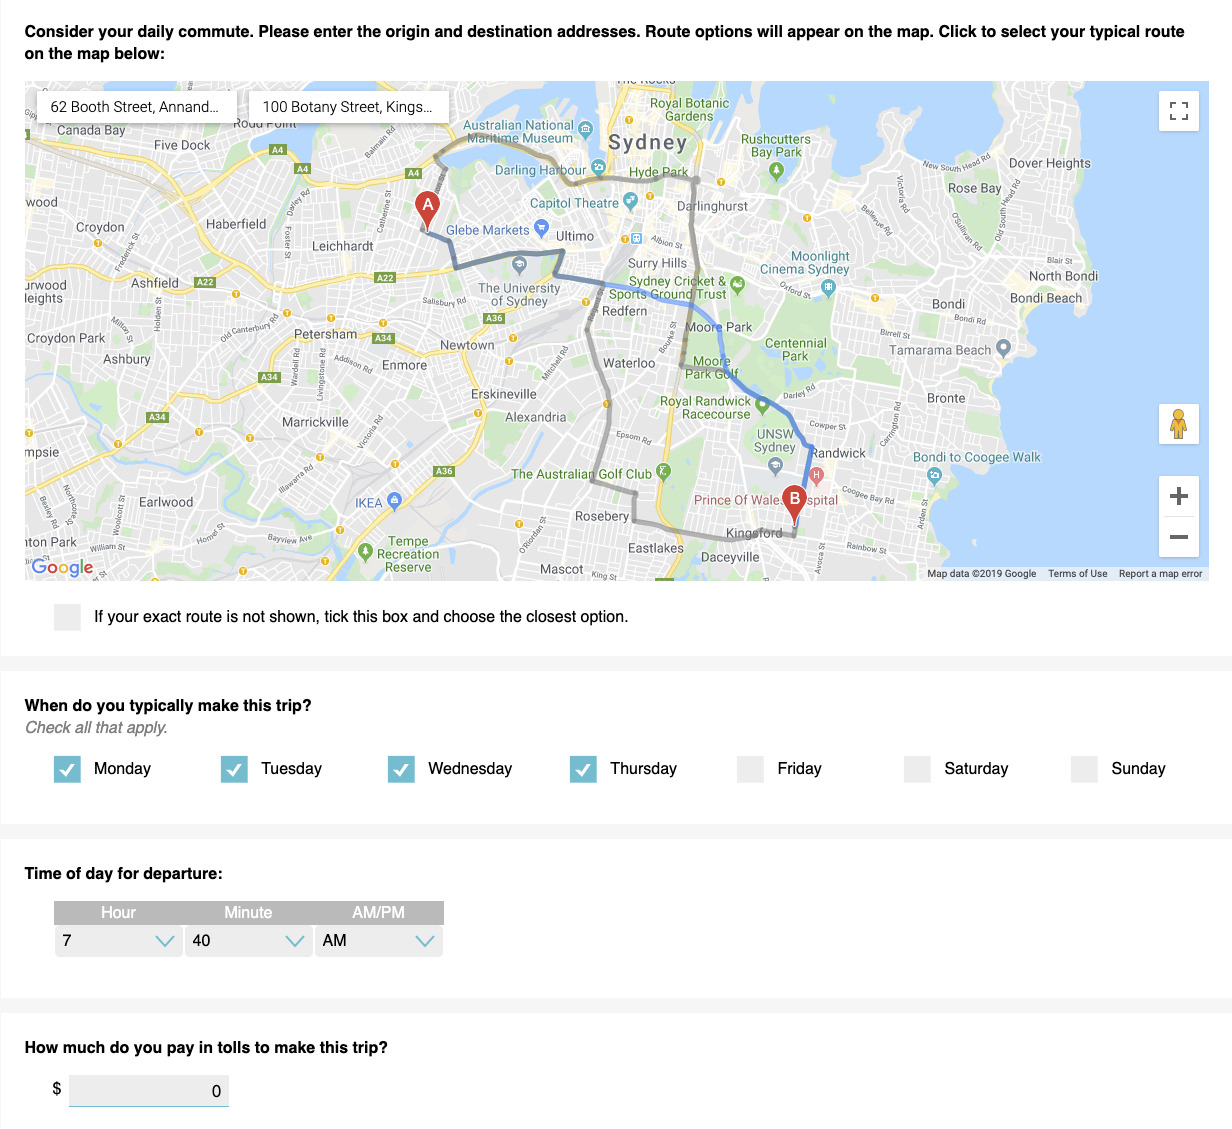
This finding uses revealed preferences for route choices for 689 regular car commuters in NSW, Australia in 2019. Respondents were asked to identify, from a map interface, their usual route to work from a set of either two (28.7%) or three (71.3%) alternatives. Information about the distribution of journey times on each of the alternatives was subsequently collected using duration in traffic queried from the Google Maps API over 100 days. More details about the sample and the attributes of the alternatives are provided in Supplement A. A set of reliability measures was calculated from each distribution based on the indicators in the reports on Reliability from the US Strategic Highway Research Program 2 (2013) and previous work using the same dataset (Moylan et al. 2022). The measures are standard deviation, coefficient of variation, buffer index, skewness statistic and rare-event reliability, which capture, respectively, the typical variation, the typical variation as a percent of the average travel time, the amount of extra time needed to be on-time 80% of the time, the importance of the tail of the travel time distribution and the portion of the distribution that is longer than a respondent-identified threshold of lateness. Definitions are provided in Supplement B.
We tested choice model specifications with each reliability measure in addition to median travel time, (in minutes), travel cost due to tolls, (in Australian Dollars), and circuity, (defined as the ratio between the length of the route and the straight line distance (Levinson and El-Geneidy 2009)). Combinations of reliability measures did not yield improved significance of the findings. In order to account for route overlap correlation, we estimated a series of C-logit models (Equation 1) that modify the systematic utility (Equation 2) of a multinomial logit model for individual and alternative by incorporating a commonality factor (Equation 3) (Cascetta 2013):
\[\small \tilde{V}_{ij} = V_{ij} - CF_{ij}\tag{1}\]
\[\small V_{ij} = \beta_{\text{t}} \cdot \text{t}_{ij} + \beta_{\text{c}} \cdot \text{c}_{ij} + \beta_{\text{u}} \cdot \text{u}_{ij} + \beta_{\text{r}} \cdot \text{r}_{ij}\tag{2}\]
\[\small CF_{ij} = \beta_0 \cdot \ln\left[1 +\sum \limits_{\overset{k\in C_i}{k\neq j} } \left(\frac{L_{jk}}{\sqrt{L_j\cdot L_k}}\right)\left(\frac{L_j-L_{jk}}{L_k-L_{jk}}\right)\right]\tag{3}\]
Here, corresponds to an additional parameter to be estimated compared to standard logit, and for individual and route is calculated by looking at all routes that are part of the choice set of the individual which is the length of the specific route which is the length of each other route, and which is the length of the overlap between routes and
The results from these models are interpreted in the context of previously published results (Moylan et al. 2022) from a stated-preference experiment with the same participants which found statistically significant coefficients on standard deviation of travel time and rare event reliability. Further details in Supplement C.
3. Findings
In five of the six models tested, we see stable coefficients for travel time, travel cost, and circuity. The Value of Time (VoT) sits around 42.5 AUD/hr $/hr, [6.1 - 77.6 90% CI]), which falls between regular and business VoT for Australia (Rose 2025). However, the reliability measures tested in these models returned statistically insignificant (albeit intuitively signed for the most part) coefficients. The sixth model is an exception— rare event unreliability has a statistically significant and intuitively signed coefficient, but the median travel time is not significant. This interaction should be expected since this metric is constructed from how often the travel time exceeds a user-specific threshold, so slower alternatives will have higher unreliability by this measure. In contrast to this set of revealed-preference models, the same respondents gave stated preferences that indicated statistical significance with intuitive signs on both standard deviation and rare-event unreliability. This suggests that the accepted value on travel time reliability is overstated.
The finding can be interpreted in several ways. A key challenge in revealed preference design is to accurately represent the choice set. In this experiment, the choice set is made explicit by presenting three options (where available) for the nominated origin and destination addresses, but it does not follow that the travellers were aware of and considered these choices before taking the survey. Moreover, the travellers may value reliability but not be aware of the reliability of their alternatives. As a frequently made journey, it can be assumed that the respondents do have semantic knowledge of the travel time distribution of their selected alternative but not necessarily of the routes they don’t usually use. Finally, it may be that the travellers do know about the reliability characteristics of all the alternatives, but they do not value them. All three of these explanations (or a combination) would result in the observed outcome of insignificant coefficients. Future work could separate the explanations by collecting information on the traveller’s awareness of the alternatives and testing the accuracy of their knowledge of their reliability attributes.
To contextualise these findings, common sense says that travellers probably do value reliability in their route choice decisions, but not in a way that is well captured by the standard deviation or even how often they are subjectively late. There is substantial evidence that recalled travel times are biased (Stopher et al. 2007; Parthasarathi et al. 2013; Tenenboim and Shiftan 2018), which makes sense in the context of the Peak-End Rule (Fredrickson and Kahneman 1993), which implies that travellers should be swayed by their worst or most recently experienced travel time (episodic knowledge) rather than attributes of the distribution (semantic knowledge). This distinction is important for transport system planners tempted to assign user benefits to projects that fractionally reduce the standard deviation of travel times— travellers may say that is attractive in a hypothetical context, but the evidence is weak that it will influence their behaviours.
Acknowledgements
The authors gratefully acknowledge Michiel Bliemer, Taha Hossein Rashidi and Karen Cong for their important roles in the creation of this dataset. In addition, we thank Tom Adelmeijer and Hamza El Idrissi who made use of the NSW toll data available through the NSW Open Data Hub to calculate toll costs for our analysed routes (https://opendata.transport.nsw.gov.au/).