

Research Questions and Hypotheses
In the US, affordable housing is sponsored by both federal and state authorities to accommodate low-income residents (Nedwick and Burnett 2015). Transit provides opportunities for residents to access jobs, and is a cost-effective way to mitigate the mobility constraints of disadvantaged groups (Blumenberg and Ong 2001). However, since the cost of housing is usually two or three times the cost of transportation, most low-income households choose affordable housing over easy access to transit, resulting in a spatial mismatch and leading to transit deserts (Badami and Haider 2007).
Jiao and Dillivan (2013) defined transit deserts as areas with transit services that are unable to meet the mobility needs of disadvantaged groups. Transit deserts are often present in suburban areas where transit operations are not cost-effective, and are fairly rare in urban settings (Taylor, McCullough, and Legg 2008; Jiao and Dillivan 2013; Jiao 2017; Cai et al. 2020; Jiao and Cai 2020). In most previous studies, transit deserts were analyzed qualitatively without using detailed quantitative information.
This study asks the following research questions:
-
How to identify transit deserts that spatially overlap with affordable housing programs?
-
What factors determine the locations of transit deserts?
Answering these questions can help policymakers integrate transit plans with affordable housing programs and identify solutions that address the mobility needs of underserved groups.
Data and Methods
Seattle is a quickly growing city with skyrocketing rent, gentrification and increasing unaffordability. The rapid rise in living costs is a signal of the city’s success but also of its widening inequality. Seattle has 683 subsidized housing programs that are independently or jointly supported by five authorities. These programs reflect the city’s intention to shelter low-income households and to improve social equity.
Transit options in Seattle include the bus and the metro. The city operates four metro lines, and many affordable housing programs are located adjacent to these lines. In contrast, the bus system covers a larger area, with more than 3,000 bus stops and 237 routes in King County. Statistics show that residents are fairly dependent on transit in the Seattle Metropolitan area (McIntosh et al. 2014).
Data and Model Specifications
In this study, each affordable housing program represents an analytical unit. Walking or biking play key roles in impacting transit dependence. A 5-min walk covers approximately 0.25 miles (Kim et al. 2005; Guerra, Cervero, and Tischler 2012), and this value was used to quantify built environment features. To simplify the analysis, only the built environment features around each affordable housing program were quantified.
Transit access and services are also vital for identifying transit deserts. This study used the number of bus stops, bus routes, metro stations, and metro lines to quantify transit access, and used bus operational frequency and business hours on weekdays to quantify transit services. The data sources are described in Table 1, and a data summary is presented in Table 2.
Method: Spatial Principal Component Analysis (sPCA)
Transit deserts cannot be directly quantified but can be expressed using related variables. Transit can only be accessed at certain times at specific locations, but prior studies have largely ignored the spatiotemporal attributes of transit. In this study, temporal attributes were captured using transit service hours, and spatial attributes were examined by applying sPCA, which is a descriptive methodology similar to the principal component analysis that adjusts for spatial proximity (Jombart et al. 2008). This method was able to rank transit desert-related factors while incorporating spatial and temporal features.
Findings
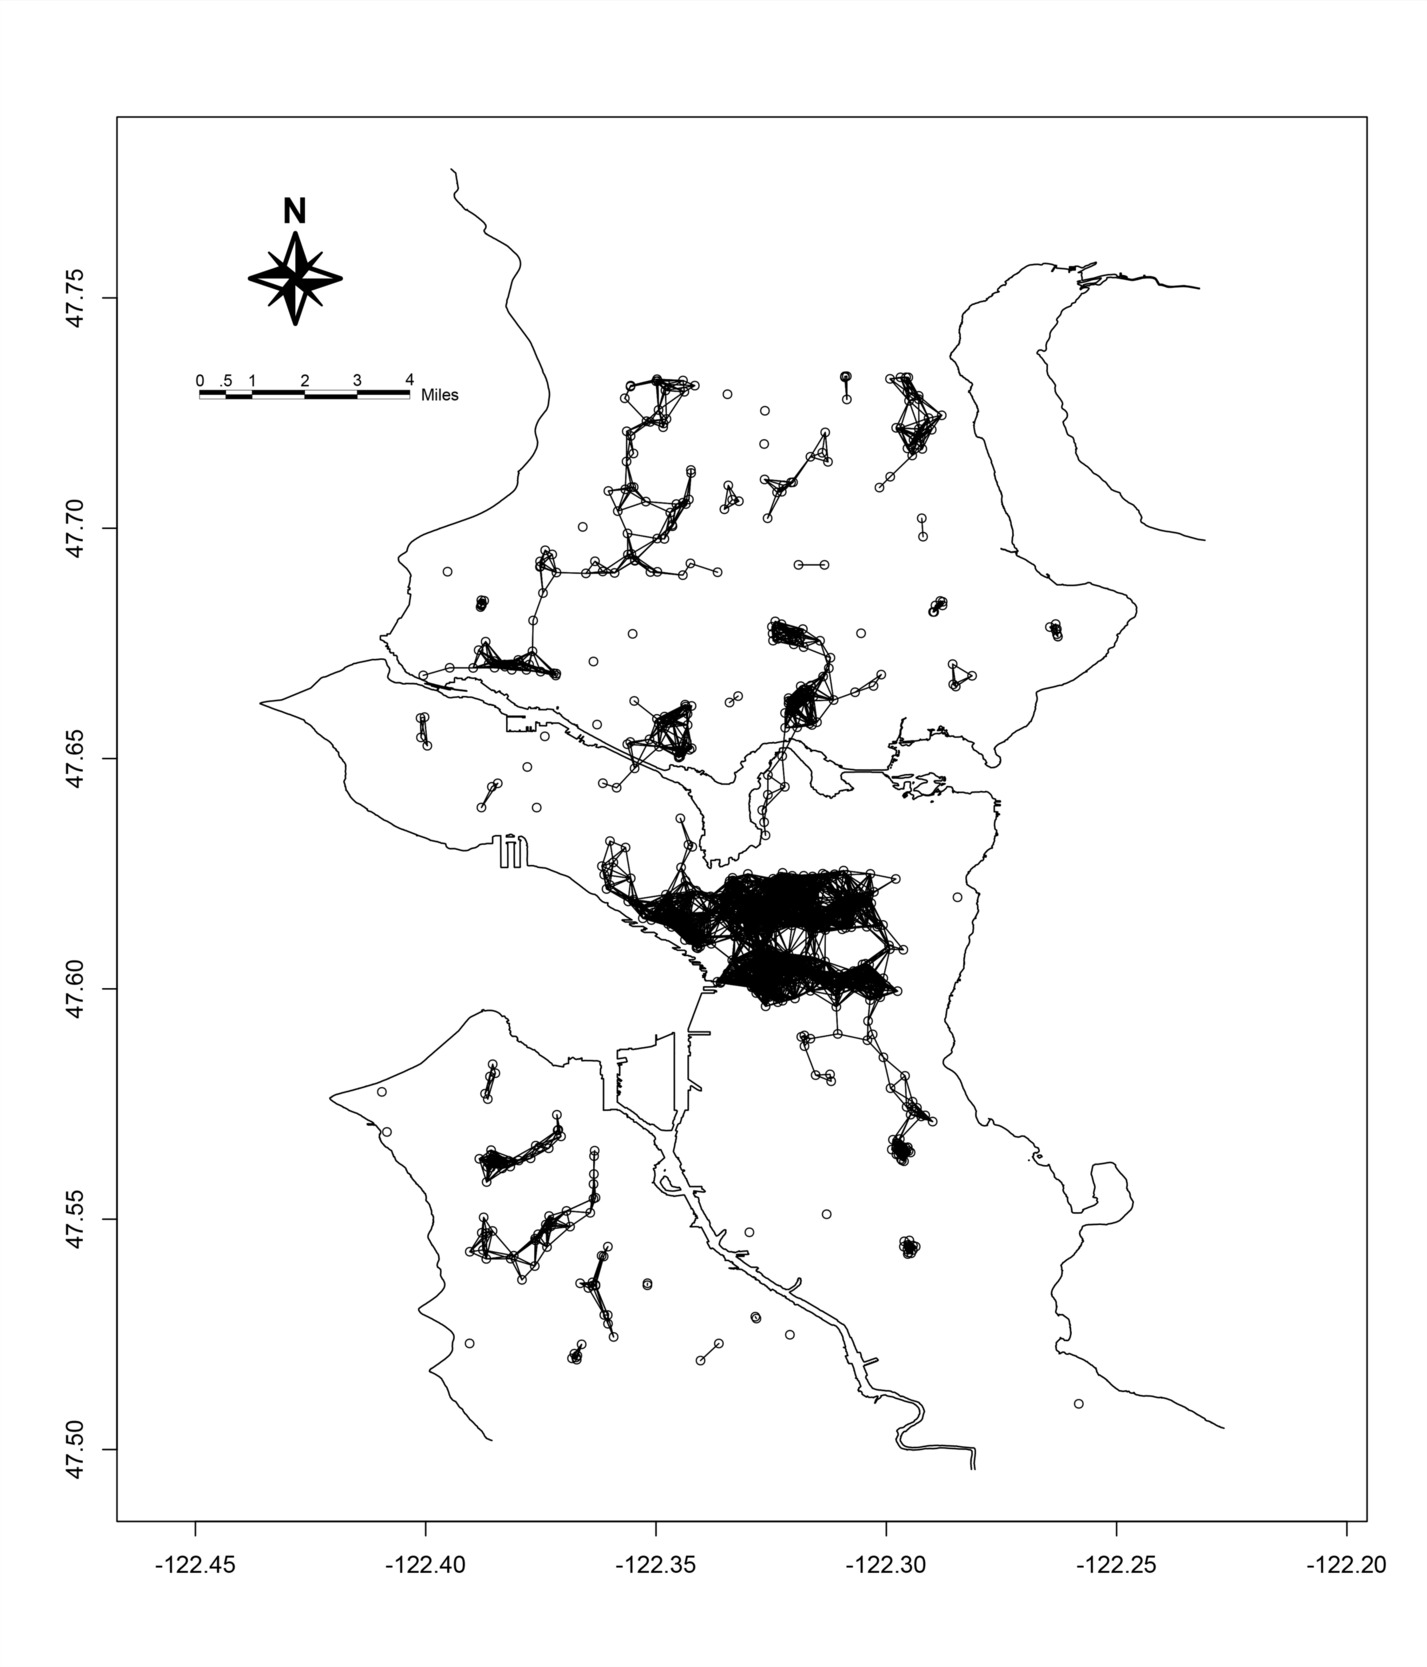
Spatial connectivity is defined as the degree of overlap between analytical units (Calenge 2006). In this study, it refers to the overlap in variance between neighboring affordable housing programs. As shown in Fig.1, the programs located in downtown Seattle have a more connected structure than clusters located in the city’s peripheral regions.
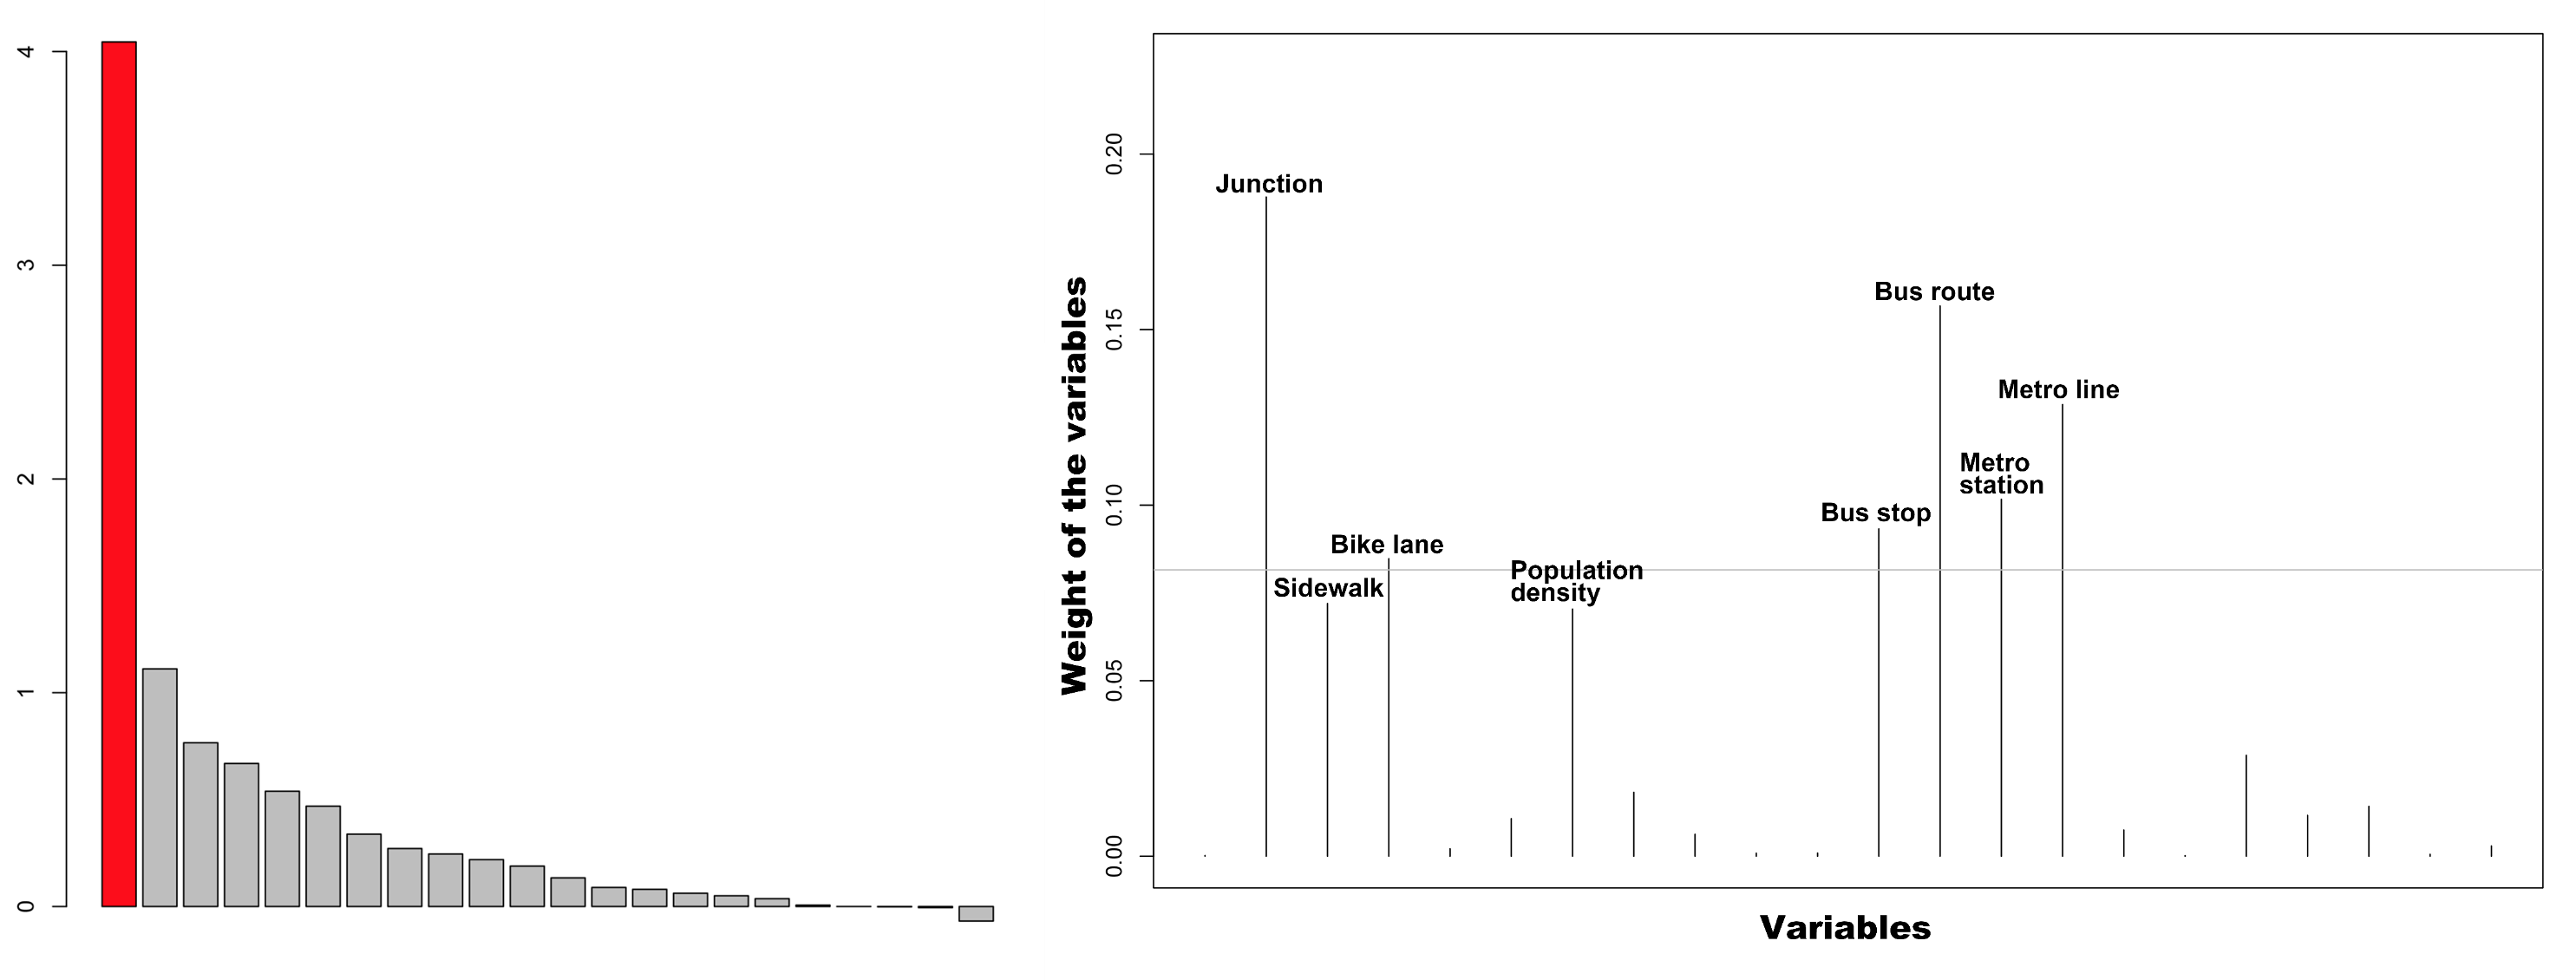
The eigenvalues from the sPCA are shown in Fig. 2(a), with a red bar representing the first eigenvalue. There was a sudden decrease between the first and the second value, indicating that the first sPCA accounted for a large proportion of the variance, and was the main component contributing to transit deserts in Seattle.
_eigenvalues_of_the_spcas__(b)_contribution_of_each_variable_to_the_first_spca.png)
sPCA cannot provide a statistical inference but can sort factors according to their weights, as shown in Fig. 2(b). Transit access contributed the most to transit deserts, with the number of bus routes (No. 2), the number of metro lines (No. 3), the number of metro stations (No. 4), and the number of bus stops (No. 5) contributing the most. The local walking and biking environments also played key roles in defining transit deserts. The number of junctions ranked No. 1, the density of bike lanes No. 6, and the density of sidewalks No. 7 among all the selected variables.
_structure_of_the_first_spca__(b)_clustered_and_scattered_transit_deserts.png)
Fig. 3(a) presents the structure of the first sPCA. Black areas display the global structure while white areas represent the local structure. The scores range from -3 to 5. A positive score indicates a global structure, and a negative score suggests a local structure. A high absolute score indicates good transit access, while a low absolute score suggests transit deserts. Fig. 3(b) displays the identified affordable housing program-based transit deserts with scores ranging from -0.3 to 0.5. As shown, both clustered (blue) and scattered (red) transit deserts were identified.
Transit deserts are closely related to urban form. In this study, affordable housing programs in downtown Seattle and near the University of Washington (UW) form global structures while others located in more suburban areas form local structures. Most bus routes pass through major corridors and dense areas to serve more riders. Examples include the I-5 corridor connecting downtown Seattle and UW. However, areas outside the corridor are likely to be underserved, like with clustered transit deserts shown in Fig. 3(b). This corridor effect is reinforced by the metro system. In Seattle, the Link light-rail connects UW, downtown Seattle, and the Sea-Tac International Airport. In areas outside this corridor, transit access is limited.
In conclusion, the variables of transit service and local access are important for identifying transit deserts (Welch 2013). Furthermore, economically disadvantaged households are affected more by these transit deserts. There are three clustered transit deserts in Seattle, located around the Atlantic, Minor, and Stevens areas. This study analyzed the key socioeconomic indicators of these three transit deserts and compared them with Seattle’s average, as shown in Table 3. The results show that the proportion of black and poor households in these transit deserts were much greater than Seattle’s average, confirming that vulnerable groups suffer more due to limited transit access. The other scattered transit deserts were sparsely distributed across low-density areas, where buses are no longer cost-effective.
For policy implications, when selecting sites for developing new affordable housing units, planners should analyze existing transit options. Similarly, when changing bus stops and routes, the location of affordable housing programs should be accounted for. The mobility needs of disadvantaged groups deserve more attention when planning transit. For clustered transit deserts, revising existing transit plans to cover such underserved areas is the best solution. For scattered transit deserts, regular bus or metro stops are unrealistic. In many cases, transit is not cost-effective for serving these low-density areas with high levels of car ownership. Authorities should avoid such areas as sites for affordable housing programs because of a lack of access to transit. Another mitigation strategy for such urban transit deserts is to provide on-demand, micro-transit services. Finally, we also noted that more connected streets and denser bike lanes led to a lower probability of a transit desert. Consequently, the development of alternative modes of transportation, such as walking, biking, and e-scootering, is also helpful.
Several limitations of this study deserve attention. First, sPCA is a descriptive methodology, not an inferential analysis. This study referred to many existing studies when conceptualizing the model, but the validity of this analysis is conditional on the assumption that the selected factors are significant predictors of transit deserts. Second, the results can vary greatly depending on the city. For example, the level of transit access and services is vastly different among various US cities, which may constrain the generalizability of these findings.
Acknowledgement
The authors gratefully acknowledge the support provided by the Center for Transportation, Environment, and Community Health (CTECH), which is a Tier 1 University Transportation Center sponsored by the US Department of Transportation (USDOT) through Grant No. 69A3551747119. The views, opinions, findings, and conclusions in this paper are the responsibility of the authors only and do not represent the official policy or position of the USDOT/CTECH, or any state or other entity.