This website uses cookies

We use cookies to enhance your experience and support COUNTER Metrics for transparent reporting of readership statistics. Cookie data is not sold to third parties or used for marketing purposes.

Skip to main content
null
Findings
  • Menu
  • Articles
    • Energy Findings
    • Resilience Findings
    • Safety Findings
    • Transport Findings
    • Urban Findings
    • All
  • For Authors
  • Editorial Board
  • About
  • Blog
  • search
  • X (formerly Twitter) (opens in a new tab)
  • LinkedIn (opens in a new tab)
  • RSS feed (opens a modal with a link to feed)

RSS Feed

Enter the URL below into your favorite RSS reader.

https://findingspress.org/feed
ISSN 2652-8800
Safety Findings
October 15, 2026 AEST

Examining the Relationship Between Cycling Infrastructure Buffers and Parking Citations for Vehicles Obstructing Cycling Facilities in Toronto, Canada

Trevor Jones,
bike lanecycling infrastructureparking citationsvehicle obstruction
Copyright Logoccby-sa-4.0 • https://doi.org/10.32866/001c.172268
Findings
Jones, Trevor. 2026. “Examining the Relationship Between Cycling Infrastructure Buffers and Parking Citations for Vehicles Obstructing Cycling Facilities in Toronto, Canada.” Findings, October 14. https://doi.org/10.32866/001c.172268.
Save article as...▾
Download all (1)
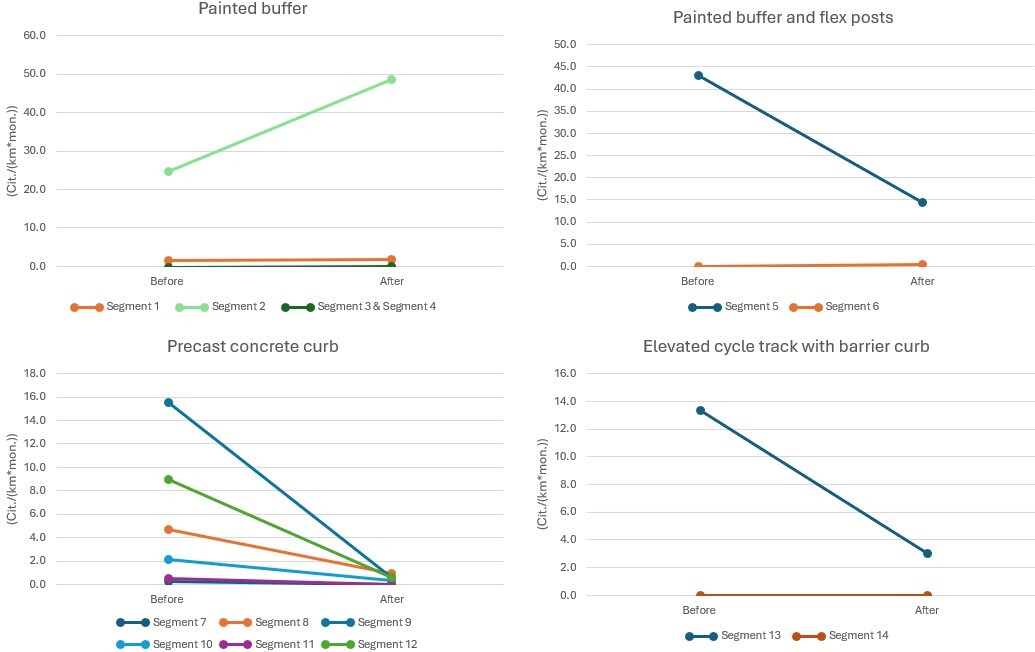
  • Figure 1. Changes in parking citation rates grouped by cycling infrastructure buffer type
    Download

Error

Sorry, something went wrong. Please try again.

If this problem reoccurs, please contact Scholastica Support

Error message:

undefined

View more stats

Abstract

This study evaluates the relationship between different cycling infrastructure buffer types in Toronto, Canada, and car parking citations issued to vehicles obstructing cycling facilities. Car parking infraction data from 2014 to 2024 were used to compare parking infractions during comparable periods before and after the installation of cycling infrastructure buffers. Fourteen cycling infrastructure locations were selected, encompassing multiple buffer types, including painted buffers, flex posts, concrete curbs, and elevated cycle tracks. Results indicate that buffers with concrete curbs were associated with lower rates of car parking citations, while painted buffers without physical barriers were associated with higher citation rates.

1. Questions

Parked vehicles within cycling facilities (e.g., bike lane, cycle track) can be hazardous for cyclists, with 88% of cyclists entering the adjacent vehicle traffic lane when encountering an obstruction (Basch et al. 2023). To prevent vehicles from obstructing cycling infrastructure, buffers are sometimes placed between cycling facilities and vehicle lanes. Previous research has found that physical barriers can lower vehicle obstruction rates (Karoly 2023; Jarry and Apparicio 2021); however, these studies have not distinguished between different types of physical barriers. This study contributes to the existing research by examining the relationship between cycling infrastructure buffers and citation rates for cars parked in cycling facilities. The following is the research question addressed by this paper:

What is the relationship between different types of cycling infrastructure buffers and citation rates for cars obstructing cycling facilities?

2. Methods

The car parking infraction dataset was obtained from the City of Toronto Open Data Portal and contained information on the fine amount, address, time, date, and type of infraction (City of Toronto, n.d.-a). Three types of parking infractions were included within the analysis:

  • City of Toronto Bylaw 886-6: Prohibits parking, driving, or operating any vehicle, except a bicycle, on a bicycle path

  • City of Toronto Bylaw 886-10: Prohibits operating any vehicle, except a bicycle, in a bicycle lane

  • City of Toronto Bylaw 886-10: Prohibits operating a vehicle, except a bicycle, in a cycle track (City of Toronto 2025a)

For most sites, one year of car parking infraction data before and after the installation of the cycling infrastructure buffer were available for analysis. A cycling infrastructure buffer is defined as a space between the vehicle lane and cycling facility. Comparable one-year periods of car parking infraction data were not available for some sites. Car parking citation data before February 1, 2014, or after August 1, 2024, were excluded from the analysis because fines for cars parked in cycling facilities were increased at these times, which may have affected illegal parking behaviour (City of Toronto 2014; 2024). Data from March 1, 2020, to March 31, 2022, were excluded from the analysis because driving behaviour varied significantly during the COVID-19 pandemic (Yasin et al. 2021).

To account for potential seasonal variation in car parking citations, the same calendar months were used for both the before and after periods for each site. Rather than using comparison groups, the analysis focused on changes in illegal car parking citations before and after the installation of cycling infrastructure buffers. This approach was used to help control for site-specific factors that may influence illegal parking behaviour, such as the availability of car parking facilities and driver knowledge (Yan et al. 2023).

The locations of cycling infrastructure within Toronto were identified using the City of Toronto’s 2025 Cycling Map (City of Toronto 2025b). The type of cycling infrastructure that existed prior to the buffer installation, the type of buffer installed, and the buffer installation dates were confirmed using Google Street View imagery (Google, n.d.). It was assumed that intersection treatments implemented as part of each cycling infrastructure buffer project corresponded to the buffer treatment installed along the study block. Intersection treatments were therefore not analyzed separately, which is a limitation of the study.

Selected locations were required to have a painted bike lane before the installation of a cycling infrastructure buffer. This ensured that car parking infraction data were available for cars parked in painted bike lanes (pre-buffer) and for cars parked in buffered cycling facilities (post-buffer). Construction notices were used to determine the cycling infrastructure buffer installation dates for locations along College Street because of large time gaps between available Google Street View imagery (City of Toronto 2023).

The length of each cycling infrastructure location and the spacing between flex posts were calculated using the City of Toronto online mapping application Toronto Maps (City of Toronto, n.d.-b). The selected cycling infrastructure locations are summarized in Table 1.

Table 1.Cycling infrastructure locations selected for analysis
Segment Buffer Post-upgrade Street Beginning/End Streets Pre-Upgrade Timeframe Post-Upgrade Timeframe Pre-/Post- Timeframe
Total Months
Side of the road Length (km)
1 Painted buffer Habord St St George St/Ossington Ave Feb 14 -
Oct 14
Feb 16 -
Oct 16
9 Both 2.18
2 Gerrard St W Bay St/Elizabeth St Jul 18 -
Jun 19
Jul 22 -
Jun 23
12 Both 0.12
3 Huntingwood Dr Brimley Rd/Birchmount Rd Nov 17 -
Oct 18
Nov 22 -
Oct 23
12 Both 2.61
4 Rathburn Road The East Mall/Martin Grove Rd Nov 18 - Oct 19 Nov 22 - Oct 23 12 Both 0.75
5 Painted buffer and flex posts every 6.0 meters Gerrard St E Yonge St/Sherbourne St Oct 14 - Sep 15 Oct 17 - Sep 18 12 North 0.83
6 Conlins Rd Canmore Blvd/Good Rd Jul 18 - Jun 19 Jul 22 - Jun 23 12 West 0.16
7 Precast concrete curb Birmingham St Dwight Ave/Kipling Ave Jan 19 – Dec 19 Jan 23 - Dec 23 12 North 1.60
8 College St Bay St/Spadina Ave Jan 19 – Jul 19 Jan 24 - Jul 24 7 Both 1.18
9 Gerrard St W Yonge St/Bay St Jul 18 - Jun 19 Jul 22 - Jun 23 12 Both 0.22
10 Shuter Street Church St/River St Jan 19 - Jul 19 Jan 24 - Jul 24 7 Both 1.64
11 Conlins Rd Canmore Blvd/Good Rd Jul 18 - Jun 19 Jul 22 - Jun 23 12 East 0.16
12 Davenport Road Bay St/Bedford Rd Jan 19 – Jul 19 Jan 24 - Jul 24 12 Both 0.83
13 Elevated cycle track with barrier curb separation College St Spadina Ave/Manning Ave Jan 19 – Jul 19 Jan 24 - Jul 24 7 Both 1.05
14 Lower Sherbourne St Railway/The Esplanade Jan 12 - Dec 12 Jan 18 - Dec 18 12 Both 0.14

After selecting the cycling infrastructure locations, the car parking infraction dataset was filtered. The dataset was first filtered to include only parking infractions issued to cars blocking cycling facilities. Next, the addresses at both ends of each selected cycling infrastructure location were used to filter the dataset and identify citations that occurred at each location. After, the total number of car parking infractions recorded during the before and after installation periods from Table 1 were then determined for each location. Finally, the total number of car parking infractions was divided by length of each cycling infrastructure location and the total number of months in the observation period to account for differences in spatial and temporal exposure.

3. Findings

The car parking infraction rates for each location, expressed as citations/(km*month), are shown in Table 2. For segments that had cycling infrastructure buffers on both sides of the street, their length from Table 1 was doubled when calculating citations/(km*month). Car parking infraction rates varied substantially across locations, ranging from 0 citations/(km*month) to 43.0 citations/(km*month). This variation may reflect differences in the land uses surrounding the cycling infrastructure segments, which could influence the amount of illegal car parking activity (Wenneman et al. 2015).

Table 2 indicates that all four painted buffer locations and one location that had a painted buffer combined with flex posts showed increases in parking citations. Every location with a precast concrete curb showed decreases in parking citations, ranging from 80.8% to 100%. For the locations with elevated cycle tracks with barrier curbs, one showed a 77.6% decrease in parking citations while the other had no recorded parking citations before or after the cycling buffer installation.

Table 2.Illegal car parking infractions per kilometer*month for each cycling infrastructure location
Seg. Buffer Post-upgrade Street Beginning / End Streets Pre-upgrade (Cit.) Post-upgrade (Cit.) Pre-upgrade (Cit./(km*mon.)) Post-upgrade (Cit./(km*mon.)) Percentage
Difference
1 Painted buffer Habord St St George St/Ossington Ave 61 70 1.6 1.8 15.0%
2 Gerrard St W Bay St/Elizabeth St 71 140 24.7 48.6 97.2%
3 Huntingwood Dr Brimley Rd/Birchmount Rd 0 5 0.0 0.1 N/A
4 Rathburn Road The East Mall/Martin Grove Rd 0 1 0.0 0.1 N/A
5 Painted buffer and flex posts every 6.0 meters Gerrard St E Yonge St/Sherbourne St 428 143 43.0 14.4 -66.6%
6 Conlins Rd Canmore Blvd/Good Rd 0 1 0.0 0.5 N/A
7 Precast concrete curb Birmingham St Dwight Ave/Kipling Ave 4 0 0.2 0.0 -100.0%
8 College St Bay St/Spadina Ave 78 15 4.7 0.9 -80.8%
9 Gerrard St W Yonge St/Bay St 82 3 15.5 0.6 -96.4%
10 Shuter Street Church St/River St 48 7 2.1 0.3 -85.3%
11 Conlins Rd Canmore Blvd/Good Rd 1 0 0.5 0.0 -100.0%
12 Davenport Road Bay St/Bedford Rd 178 12 8.9 0.6 -93.2%
13 Elevated cycle track with barrier curb separation College St Spadina Ave/Manning Ave 196 44 13.3 3.0 -77.6%
14 Lower Sherbourne St Railway/The Esplanade 0 0 0.0 0.0 N/A

Seg. = Segment, Cit. = citation, mon. = month

Figure 1 illustrate the changes in car parking citation rates for each segment grouped by cycling infrastructure buffer type. The charts shows that there is variation in the magnitude of increases in car parking citation rates across the painted buffer segments and that there are consistently large reductions in car parking citation rates amongst the precast concrete curb segments.
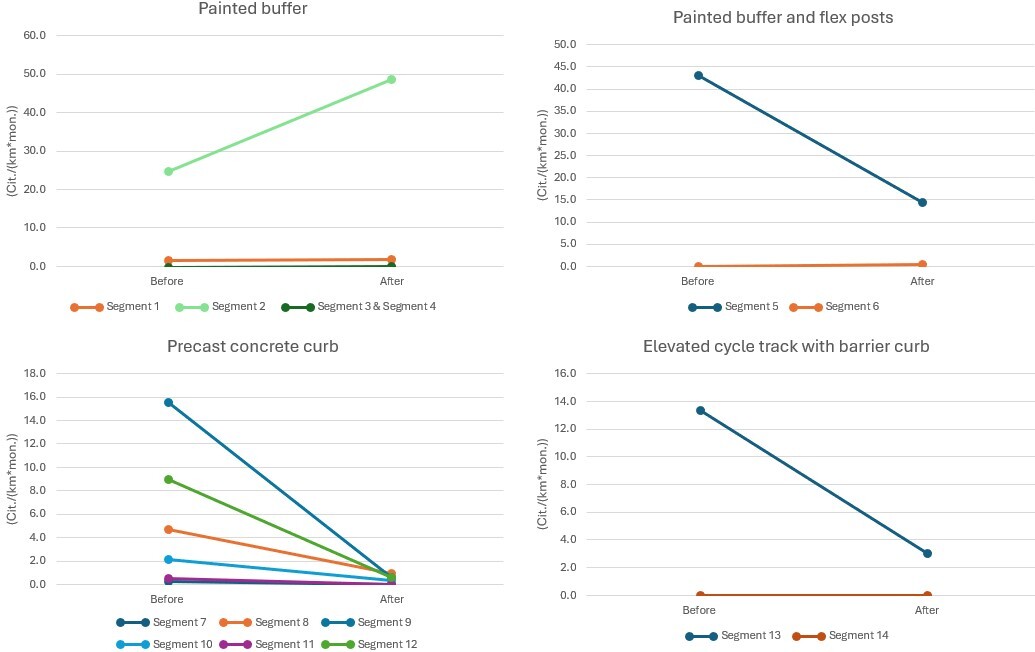
Figure 1
Figure 1.Changes in parking citation rates grouped by cycling infrastructure buffer type

There are several limitations of the study due to the available data and the number of study locations. One limitation is that parking enforcement levels, which may influence the likelihood of receiving a parking citation, are not controlled for (City of Toronto 2014). The limited number of locations for some types of cycling infrastructure buffers could be due to the requirement for painted bike lanes to exist before the cycling infrastructure buffer was installed. The findings of this paper could be strengthened by further analysis of car parking infractions in other cities or by collecting and analyzing cyclist-vehicle conflict data.


Acknowledgements

The authors did not receive support from any organization for the submitted work. Language editing was assisted by ChatGPT (version 5.6). The author takes full responsibility for all content.

Submitted: August 18, 2026 AEST

Accepted: October 09, 2026 AEST

References

Basch, C. H., D. Ethan, J. Fera, B. Kollia, and C. E. Basch. 2023. “Micromobility Vehicles, Obstructions, and Rider Safety Behaviors in New York City Bike Lanes.” Journal of Community Health 48 (3): 522–27. https:/​/​doi.org/​10.1007/​s10900-023-01197-6.
Google Scholar
City of Toronto. 2014. Toronto Police Service – Increasing Parking Enforcement on Arterial Roads During the Rush Hours and On All Bike Lanes. https:/​/​www.toronto.ca/​legdocs/​mmis/​2015/​pw/​bgrd/​backgroundfile-77783.pdf.
City of Toronto. 2023. Construction Update #3 Infrastructure Improvements on College Street from Manning Avenue to Bay Street. http:/​/​www.toronto.ca/​wp-content/​uploads/​2023/​09/​900d-22ECS-TI-09SP-w11-college-infra-improve-cons-update3-feb21-23.pdf.
City of Toronto. 2024. Increase in Penalty Amounts for Parking Offences and Establishment of New Electric Vehicle Parking Offences for Off-Street Parking Facilities. https:/​/​www.toronto.ca/​legdocs/​mmis/​2024/​cc/​bgrd/​backgroundfile-243968.pdf.
City of Toronto. 2025a. “Chapter 886 FOOTPATHS, PEDESTRIAN WAYS, BICYCLE PATHS,BICYCLE LANES AND CYCLE TRACKS.” https:/​/​www.toronto.ca/​legdocs/​municode/​1184_886.pdf.
City of Toronto. 2025b. “Toronto Cycling Map.” http:/​/​www.toronto.ca/​wp-content/​uploads/​2025/​05/​9678-2025TorontoCyclingMapdigitalv1.3.pdf.
City of Toronto. n.d.-a. “City of Toronto’s Open Data Portal.” Open Dat Portal. https:/​/​open.toronto.ca/​dataset/​parking-tickets/​.
City of Toronto. n.d.-b. “Toronto Maps.” Accessed January 19, 2026. http:/​/​map.toronto.ca/​torontomaps/​.
Google. n.d. “Discover Street View and Contribute Your Own Imagery to Google Maps.” Google Maps Street View. Accessed January 19, 2026. http:/​/​www.google.com/​streetview/​.
Jarry, V., and P. Apparicio. 2021. “Ride in Peace: How Cycling Infrastructure Types Affect Traffic Conflict Occurrence in Montréal, Canada.” Safety (Basel) 7 (3): 63. https:/​/​doi.org/​10.3390/​safety7030063.
Google Scholar
Karoly, S. 2023. “What’s in the Bike Lane? A Study of the Factors Leading to Bike Lane Obstructions in Two Bay Area Cities.” San José State University. https:/​/​www.sjsu.edu/​urbanplanning/​docs/​honors-reports/​2023_2024_Karoly.pdf.
Wenneman, A., K. M. N. Habib, and M. J. Roorda. 2015. “Disaggregate Analysis of Relationships between Commercial Vehicle Parking Citations, Parking Supply, and Parking Demand.” Transportation Research Record 2478 (1): 28–34. https:/​/​doi.org/​10.3141/​2478-04.
Google Scholar
Yan, J., X. Zhou, and Y. Ji. 2023. “What Causes Curbside Illegal Parking Behavior: A Method Based on Structural Equation Model.” KSCE Journal of Civil Engineering 27 (8): 3581–90. https:/​/​doi.org/​10.1007/​s12205-023-0048-6.
Google Scholar
Yasin, Y. J., M. Grivna, and F. M. Abu-Zidan. 2021. “Global Impact of COVID-19 Pandemic on Road Traffic Collisions.” World Journal of Emergency Surgery 16 (1): 51. https:/​/​doi.org/​10.1186/​s13017-021-00395-8.
Google Scholar

Attachments

Powered by Scholastica, the modern academic journal management system