
1. Questions
Traffic signals divide waiting time between pedestrians and vehicles. The Sydney Coordinated Adaptive Traffic System (SCATS) records pedestrian-button requests, signal states, and vehicle-detector counts (Transport for NSW 2024). These records identify the first accepted button request after flashing-don’t-walk begins, which we call the first actuation. They do not identify pedestrians who arrive later. Earlier studies estimate pedestrian delay from controller events (Karimpour et al. 2022) and optimize signal timing for pedestrians and vehicles together (Roshandeh et al. 2014; Yu et al. 2017; Liang et al. 2020). We ask:
-
How do average and total pedestrian delay compare with vehicle delay at the same intersections and during the same hours?
-
How would delay change for each mode if pedestrian service began earlier, aiming to limit the wait after the first button request to 15, 20, 30, or 45 seconds?
2. Methods
We link SCATS pedestrian-button requests, Walk indications, signal phases, vehicle green intervals, and detector counts for Tuesday, 18 September 2018, an arbitrarily selected date. Each site-hour represents one intersection during one clock hour. The comparison of current conditions covers 2,226 site-hours at 168 intersections. Of these intersections, 95 meet the criteria for the 30-second timing experiment. We also repeat the analysis for 14–20 September at 35 intersections with complete inputs for all seven days. Supplemental Information describes the study-day weather and the limits of these samples.
The companion network study uses the timing of the first button request to estimate arrival events and their accumulated delay at site during hour (Levinson 2026a). An arrival event can be one pedestrian or a group. Calibration factors from 14 manual-observation and 24 video-observation cases convert arrival events to individual crossings and event-delay to pedestrian delay (Levinson 2026b):
\[\widehat N_{sh}^p=\widehat\alpha_N\widehat N_{sh}^{p,e},\qquad \widehat D_{shq}^p=\widehat\alpha_{Dq}\widehat D_{sh}^{p,e},\qquad \widehat{\bar d}_{shq}^p=\frac{\widehat D_{shq}^p}{\widehat N_{sh}^p},\tag{1}\]
Here distinguishes two estimates: everyone waits for Walk, or pedestrians cross as observed in the calibration data (Choy and Levinson 2026). Across the 38 cases, the mean multipliers are for crossings, for full-compliance delay, and for observed-behavior delay. The ranges show how results vary across calibration cases. They are not confidence intervals and do not capture other sources of uncertainty.
For vehicles arriving on approach we assign zero signal delay during green and otherwise assign the time until the next green. This assigned delay is We average it over the seconds for which the next green is known, denoted whose duration is The calculation assumes that arrivals are spread uniformly through time and that no queue remains after green ends:
\[\widehat{\bar d}_{ash}^v=\frac{1}{T_{ash}}\int_{\mathcal T_{ash}}r_{ash}^v(t)\,dt,\quad \widehat D_{sh}^v=\sum_a N_{ash}^v\widehat{\bar d}_{ash}^v,\quad \widehat{\bar d}_{sh}^v=\frac{\widehat D_{sh}^v}{\sum_a N_{ash}^v}.\tag{2}\]
The vehicle count sums counts from the active detector nearest the intersection on each mapped inbound lane. Of 1,990 active detector slots, 1,872 (94.1%) have spatial mappings. We retain an approach-hour only when at least 3,500 seconds can be evaluated and observed flow is below 75% of estimated capacity Capacity assumes 1,800 vehicles per represented lane-hour of green. This screen removes 1,654 approach-hours but no entire intersection. The delay model omits residual queues, bunched arrivals, and upstream blocking. Detector assignments are inferred rather than independently verified. Missing inbound lanes could bias vehicle-delay changes and the break-even pedestrian-wait weight; the direction depends on their response to retiming. Pedestrian crossings and detected vehicles both count intersection passages, not complete trips.
The timing experiment starts the phase containing Walk earlier by shortening the preceding phase. We test first-call wait targets of 15, 20, 30, and 45 seconds. The preceding phase must remain at least seconds long. At phase boundary contains eligible button requests, is the wait after request and is the preceding phase duration. We move the boundary earlier by:
\[\delta_k=\min\left\{\max_{e\in\mathcal E_k}\max(R_e-c,0),\ \max(L_{k-1}-L_{\min},0)\right\}.\tag{3}\]
The preceding vehicle green ends seconds earlier; yellow and all-red intervals retain their original durations. The 10-second minimum means some first-call waits can still exceed the target. We hold pedestrian crossing volumes and detected vehicle counts at their current levels when calculating the effect of retiming. An intersection qualifies if at least 80% of pedestrian delay can be linked to phase boundaries, at least 10 boundaries move, both modes are compared over the same hours, and retained vehicle approach-hours remain below after retiming. The seven-day analysis uses the same calculations but retains observations above that flow-to-capacity limit.
We compare current timing (subscript 0) with retiming toward wait target Pedestrian person-hours saved are and vehicle-hours added are At intersections where vehicle delay increases, reports pedestrian-hours saved per vehicle-hour added.
To compare people’s time, we multiply vehicle-hours by assumed occupancy persons per detected vehicle. Occupancy was not measured at these intersections; this illustrative value lies between Sydney work-trip and all-day occupancies (Bureau of Transport Statistics 2014). We then let express how much weight a minute of pedestrian waiting receives relative to a minute of vehicle-occupant waiting. The weighted time saved exceeds the time added when The break-even weight is : a positive balance requires This makes the valuation of pedestrian waiting explicit. Pedestrians’ exposure to weather and traffic, and their physical vulnerability, may justify a different weight (Zhu et al. 2023). Higher assumed vehicle occupancy raises the break-even weight in direct proportion.
3. Findings
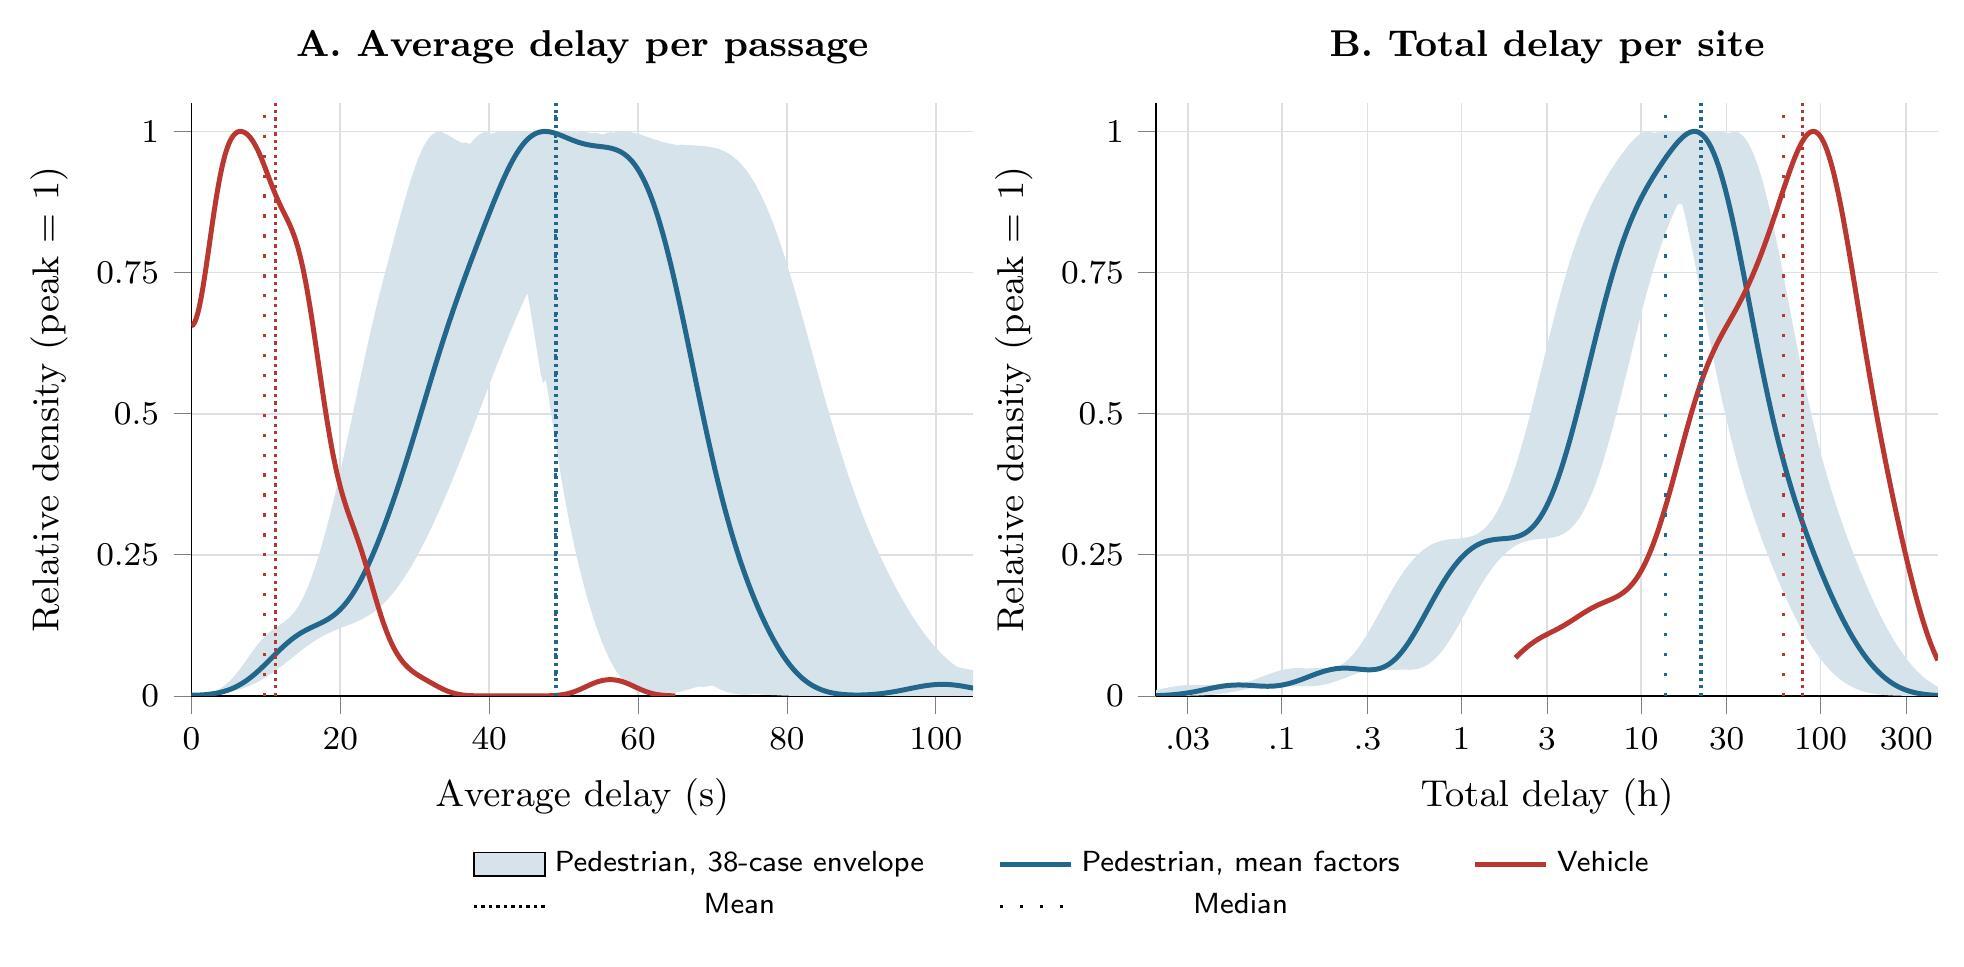
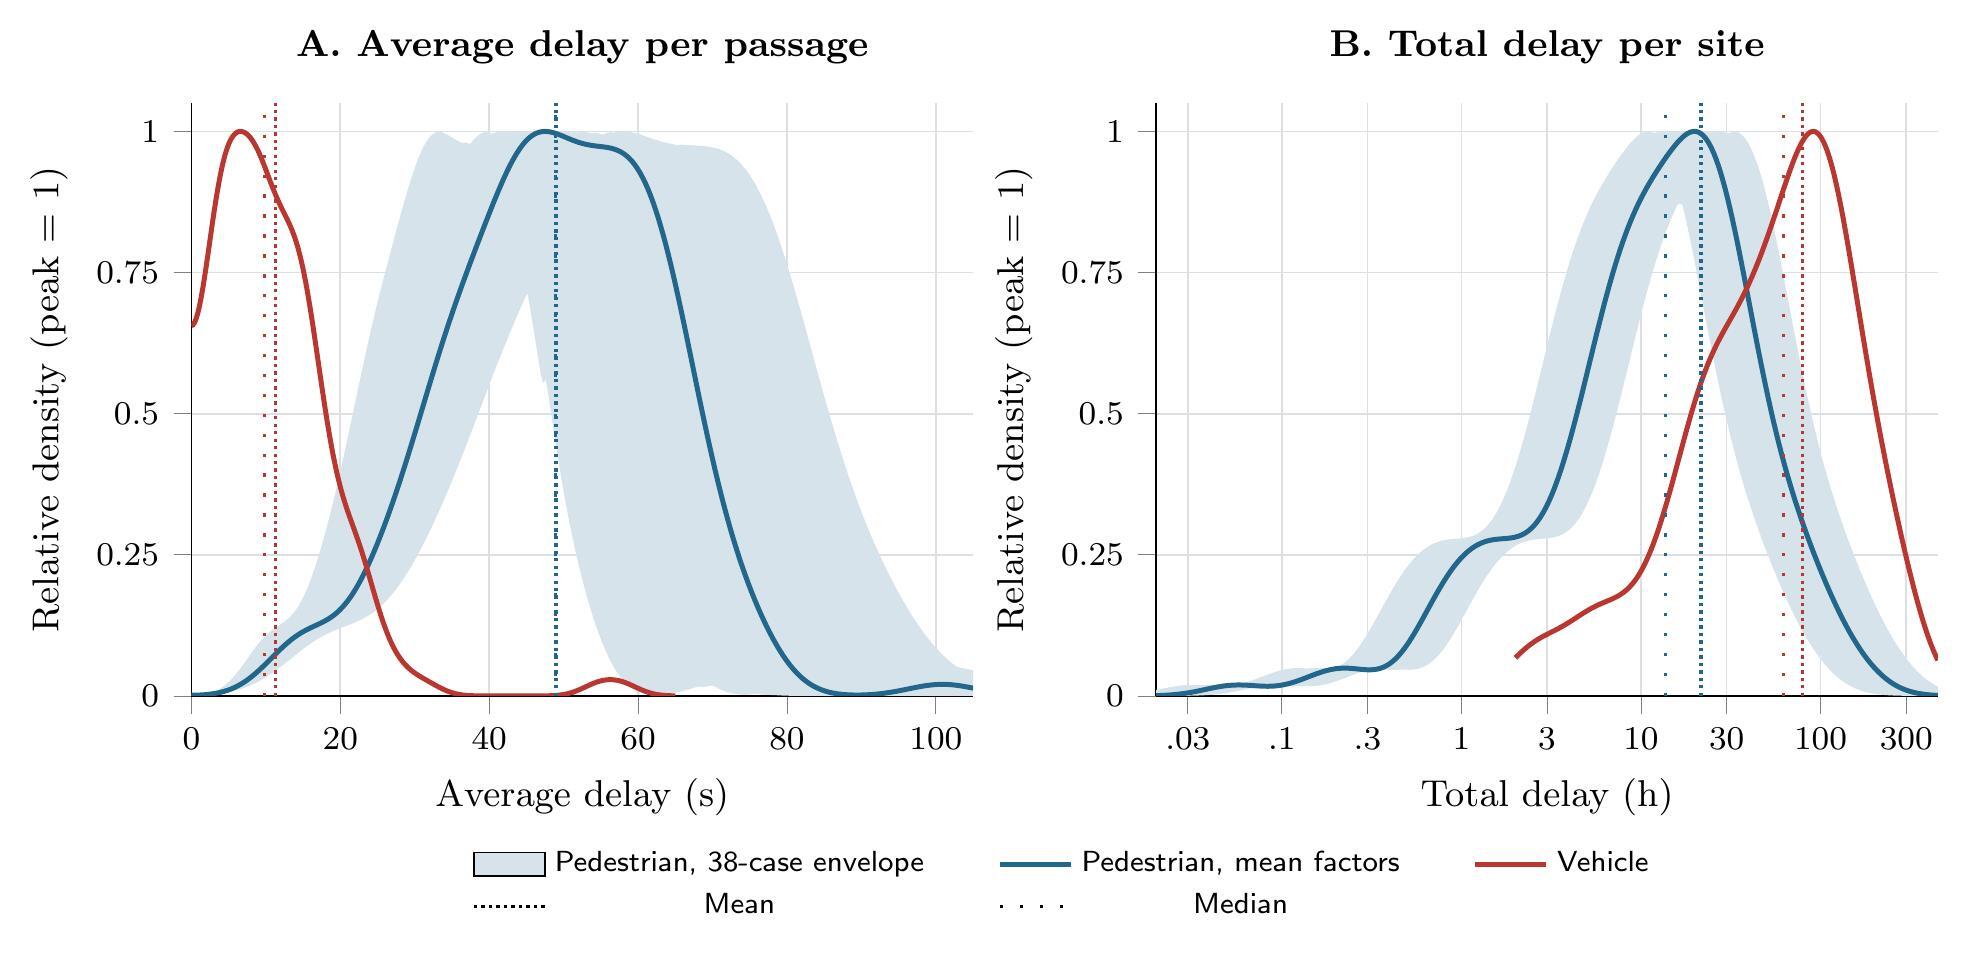
The matched sample contains 328,421 estimated pedestrian crossings and 4,581,992 detected vehicle passages (Supplemental Information, Table 4). Vehicles outnumber pedestrian crossings by about 14 to one. They therefore accumulate more total delay even though each vehicle waits less, on average, than each pedestrian. At 1.2 occupants per vehicle, pedestrians account for 5.6% of counted person-passages but 18.6% of total person-delay under full Walk compliance, or 14.6% under observed behavior. These are shares of passages through the sampled intersections, not shares of Sydney trips. Mean pedestrian delay exceeds mean vehicle delay at 165 of 168 intersections under full compliance. Averaging across all estimated crossings gives 39.8 seconds per crossing; the median intersection has a mean pedestrian delay of 48.9 seconds (Figure 1).
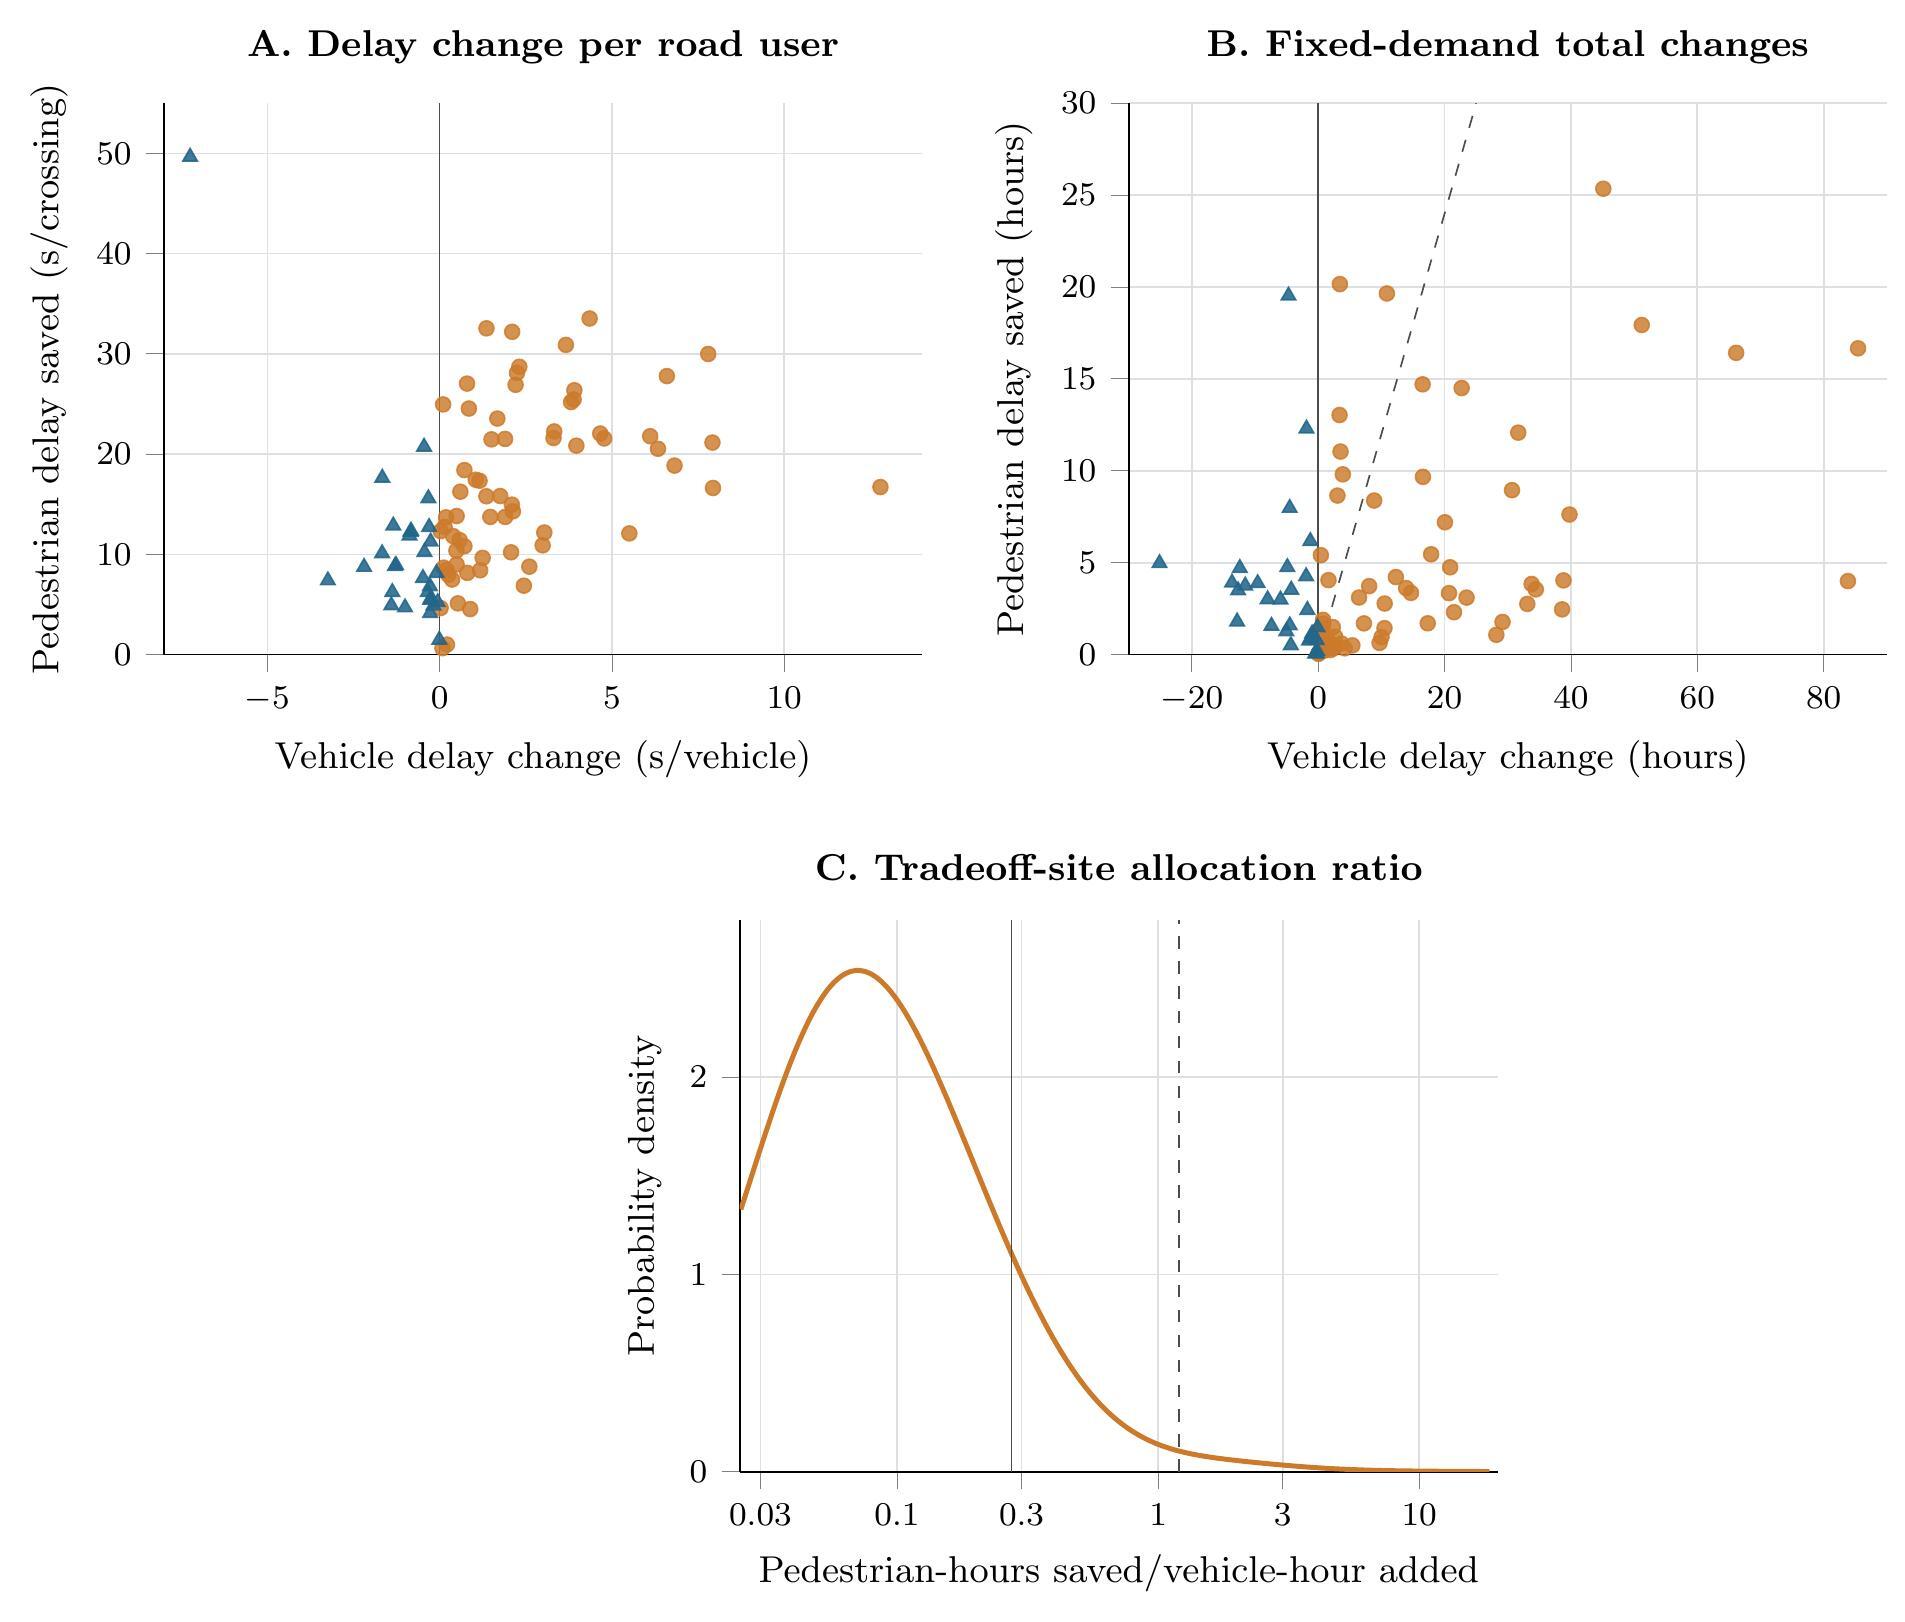
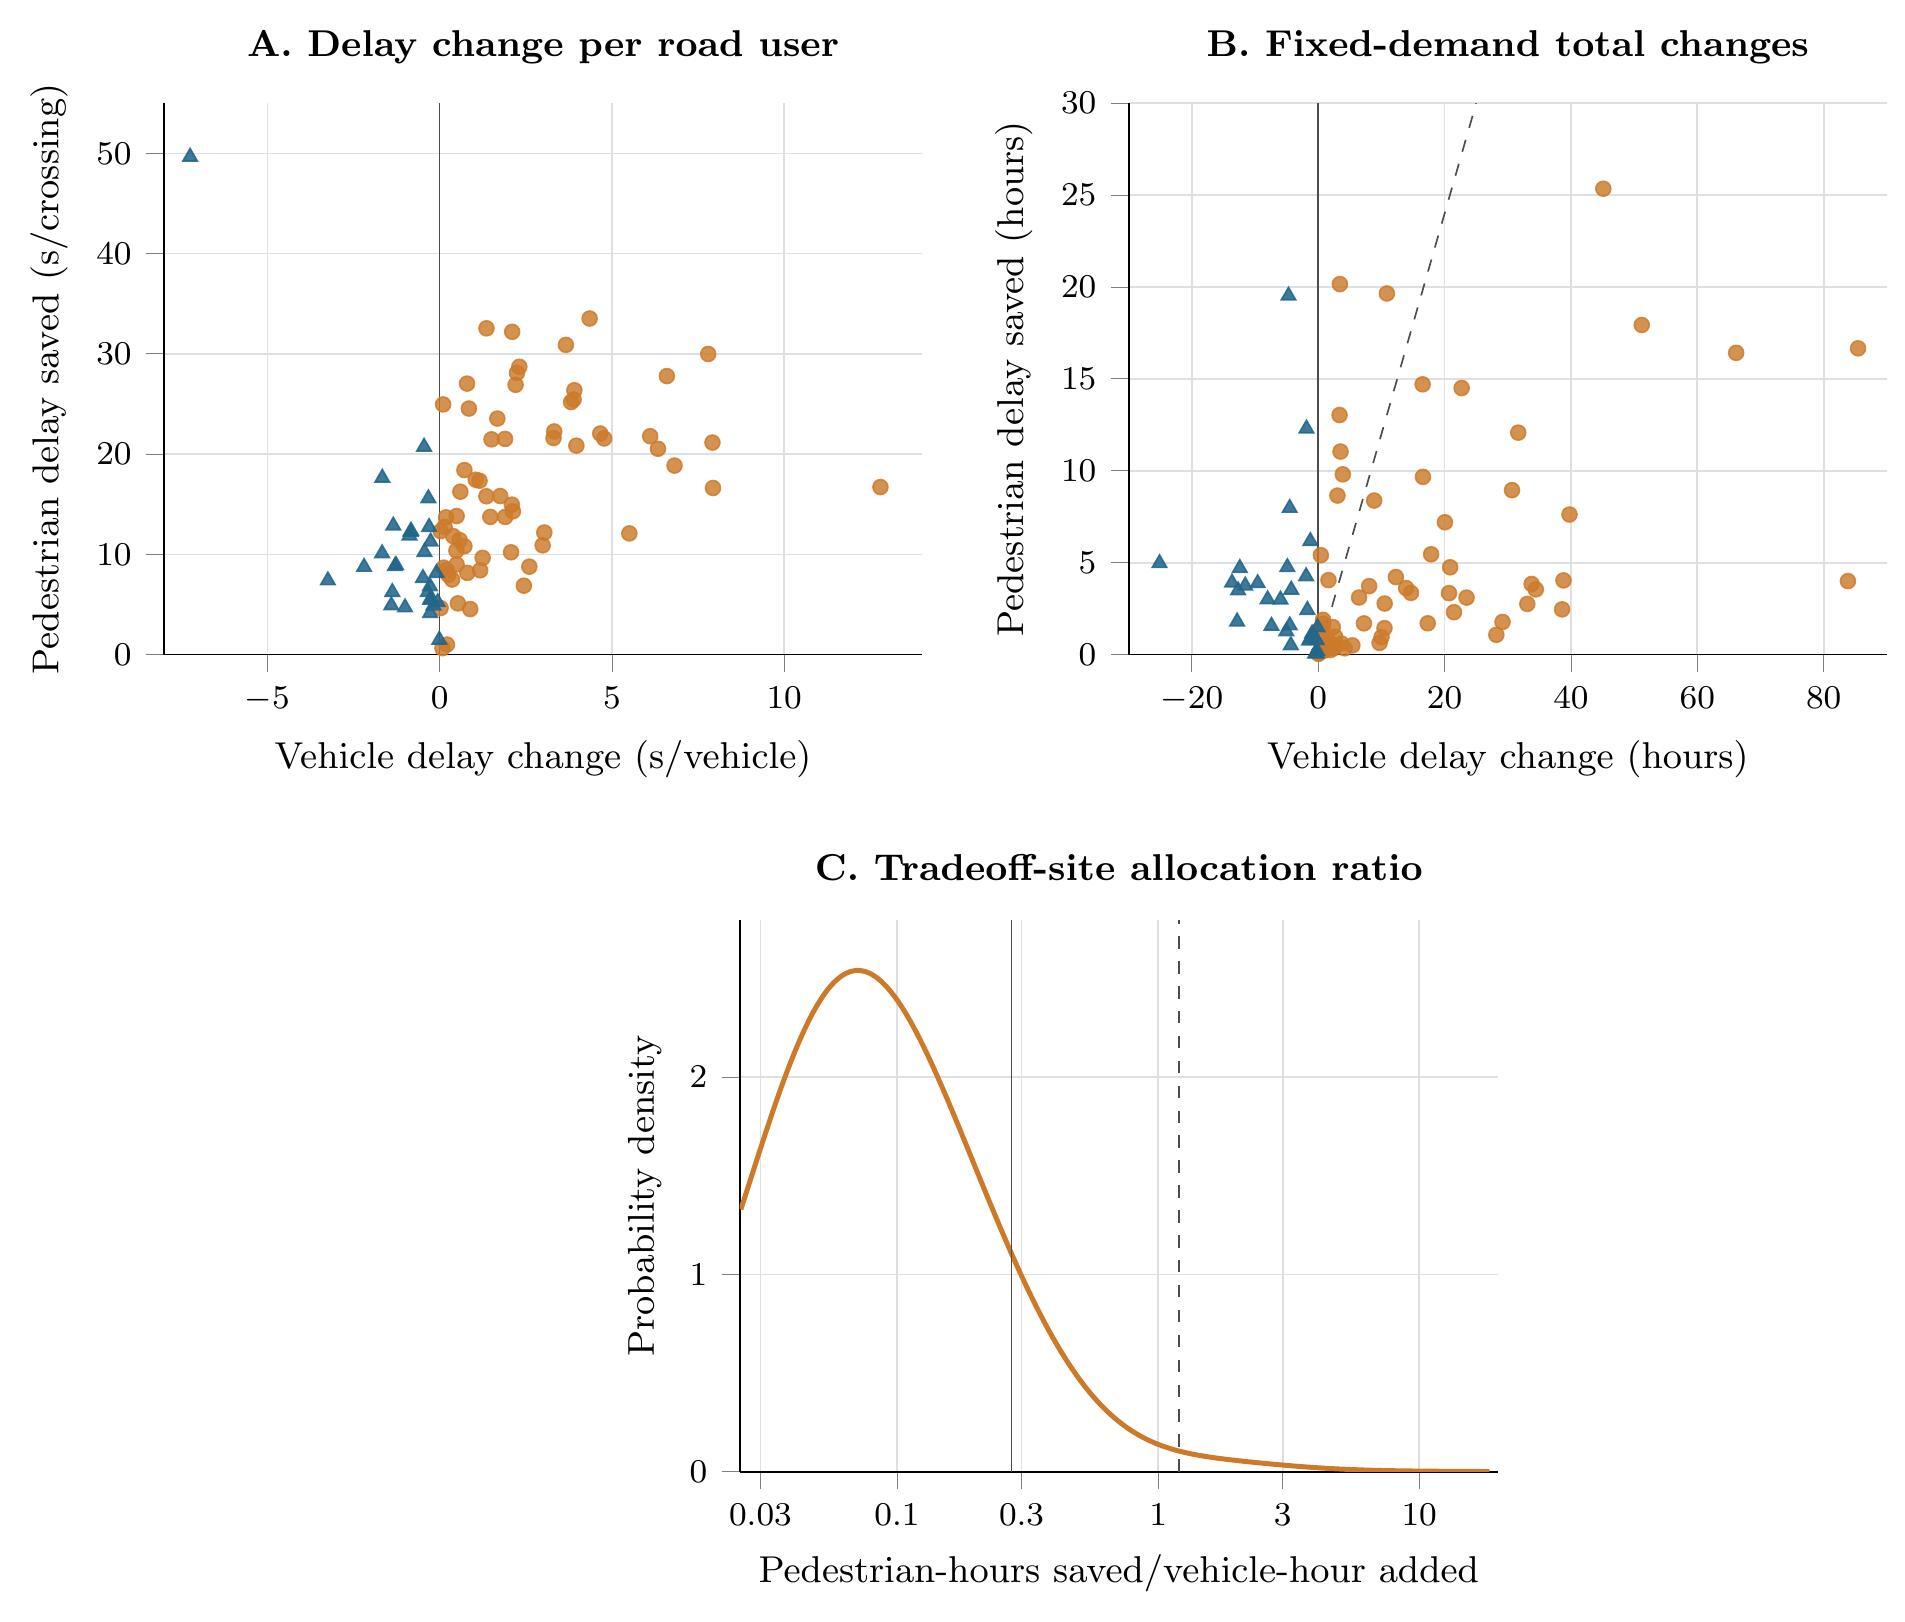
At the 95 intersections eligible for the 30-second experiment, estimated pedestrian delay under full Walk compliance falls from 38.05 to 26.46 seconds per crossing. Vehicle delay rises from 9.55 to 11.01 seconds per detected vehicle. At 29 intersections, both modes spend less time waiting: together they save 103.74 pedestrian-hours and 163.32 vehicle-hours. At the other 66 intersections, pedestrians save time while vehicles incur additional delay (Figure 2). Across all 95 intersections, the break-even pedestrian-wait weight is 2.42 under full compliance and 3.23 under observed behavior (Table 2).
The break-even weight also depends on which intersections and approaches are included. For the 30-second target, restoring excluded high-flow approaches at the same 95 intersections lowers the full-compliance weight from 2.42 to 2.11. Including all otherwise-eligible intersections then raises it to 3.89. That increase of 1.78 is nearly five times the 0.37 range across wait targets in the same-site, no-screen comparison. In these comparisons, changing the included intersections affects the break-even weight more than changing the wait target. Restored approaches reduce estimated vehicle delay in aggregate; the additional intersections account for the larger vehicle cost. SI-7 separates these effects and reports comparisons that hold the set of intersections fixed. At an assumed occupancy of 1.4, every break-even weight would be 16.7% higher.
In the seven-day analysis, the 30-second experiment reduces pedestrian delay at 32 of 35 intersections: 18 add vehicle delay and 14 reduce delay for both modes. The remaining three have no modeled change. Twenty-two intersections retain the same direction of change in both modes on all seven days. Across the week, the experiment saves 429.12 pedestrian-hours and adds 794.32 vehicle-hours under full Walk compliance. At occupancy 1.2, pedestrian waiting must receive more than 2.22 times the weight of vehicle-occupant waiting for the weighted savings to exceed the added delay (Table 3). These 35 intersections were selected because complete inputs were available. The analysis retains high flow-to-capacity observations, where vehicle-delay estimates are less reliable because queues are not modeled.
The estimated gains at the 29 one-day intersections where both modes benefit require validation against pedestrian clearance, coordination, queues, and safety constraints. The experiment isolates the effect of changing signal timing at current pedestrian and vehicle volumes. It does not estimate how people might change their route, departure time, crossing location, or travel mode in response.
Acknowledgments
Zhenyu Liu collected the manual field observations used in calibration. Keng Io Choy collected the video observations and supplied upstream pedestrian and signal tables. Anthropic Claude and OpenAI Codex assisted with code review and manuscript editing; the author verified the analysis and text.
Data and Code Availability
Analysis scripts and derived, non-identifying outputs used in the tables and sensitivity checks are provided as supplementary material with this article. Raw controller histories cannot be redistributed under the local archive terms.
Funding and Conflict of Interest
The author reports no project-specific funding or conflict of interest.