
1. Questions
Most shared micromobility (SMM) systems are privately operated and must balance affordability with operational sustainability (NACTO 2024), yet pricing’s effect on demand remains understudied. At least one study showed stated-preference evidence that lower fares with upfront cost certainty could increase use; however, the accompanying revealed-preference experimental trial showed minimal travel behavior change which was hypothesized to be due to ride-by-ride price choice in the designed trial (Fukushige et al. 2026). In this study we hypothesized that lower flat-rate pricing with upfront cost certainty, automatically applied to each trip after a single participant opt-in at the beginning of the trial, would change users’ SMM trip characteristics and usage. We investigated these questions:
-
How much does lower flat-rate pricing with upfront cost certainty change trip frequency among existing SMM users?
-
How much does lower flat-rate pricing with upfront cost certainty change SMM first use and trip frequency among new users?
-
How much does lower flat-rate pricing with upfront cost certainty change users’ SMM trip distance and speed?
2. Methods
Collaborating with SMM operator Lime, we conducted randomized pricing trials in Summer and Winter 2025 in San Francisco, Oakland, Sacramento, and Los Angeles, California. Each city had randomly assigned, equally sized treatment and control groups. The three treatment groups were offered either $1.75, $2.50, or $3.25 flat rates for trips up to 20 minutes, after which additional per-minute charges applied. The control group used standard pay-as-you-go (PAYG) fare ($1 unlock fee plus a per-minute charge: $0.49 in Sacramento, $0.55 in the Bay Area, and $0.54 in Los Angeles).
We recruited infrequent users (< 20 trips per 28 days on average, whose primary city during the screening period was a study city) and non-users (summer only). After invited participants opted in by confirming their trial participation, they paid flat rates for all trips except those cheaper with a PAYG fare or another promotional code/pass. For the summer trial only, selection was stratified by usage frequency: low (< 3), mid (3 to <10), and high (10 to < 20 trips per 28 days). Table 1 reports timeframes and target quotas by city and segment.
We obtained Lime transaction records for all participants and defined comparable pre-trial and intervention indicators for each wave (Table 1). To reduce measurement error in the trip-level analysis, we excluded trips shorter than 0.08 kilometers (unlikely to be meaningful travel), and trips with average speeds above 32.2 kph or less than 0.8 kph (likely GPS error or abnormal recordings). Table 2 reports summary statistics.
We analyzed how the trial changed first use, trip frequency, duration and distance using multivariate statistical models. Specifically, we used Bayesian multilevel difference-in-differences (DiD) models to evaluate the intervention based on the interaction between time (pre vs. during) and group status. The primary Intent-to-Treat (ITT) model, the traditional difference-in-differences specification, utilized the four randomized assignments (three treatment groups, one control) to preserve randomization and maximize internal validity. The secondary As-Treated (AT) model split the treatment groups into flat-rate trip makers (adopters) and those that were treated but who did not make flat-rate trips (non-adopters) to assess the effectiveness of flat-rate pricing on SMM use by adopter status. To partially mitigate selection bias in the AT analysis, participants with zero trial trips were excluded (Table 3). Additionally, we analyzed trip distance and speed (duration conditioned on distance) using Gamma models including trips made by participants in the study cities only. All models were estimated with the R package brms (Bürkner 2017). We used weakly informative priors selected from prior predictive checks (McElreath 2020) and confirmed convergence with no Stan diagnostic warnings. The supplemental material contains model details and parameter summaries.
3. Findings
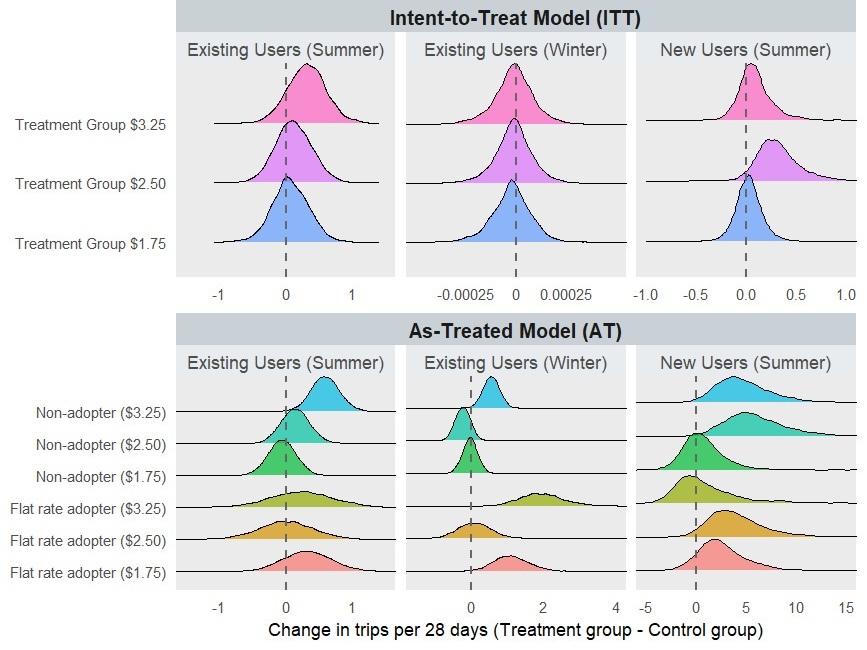
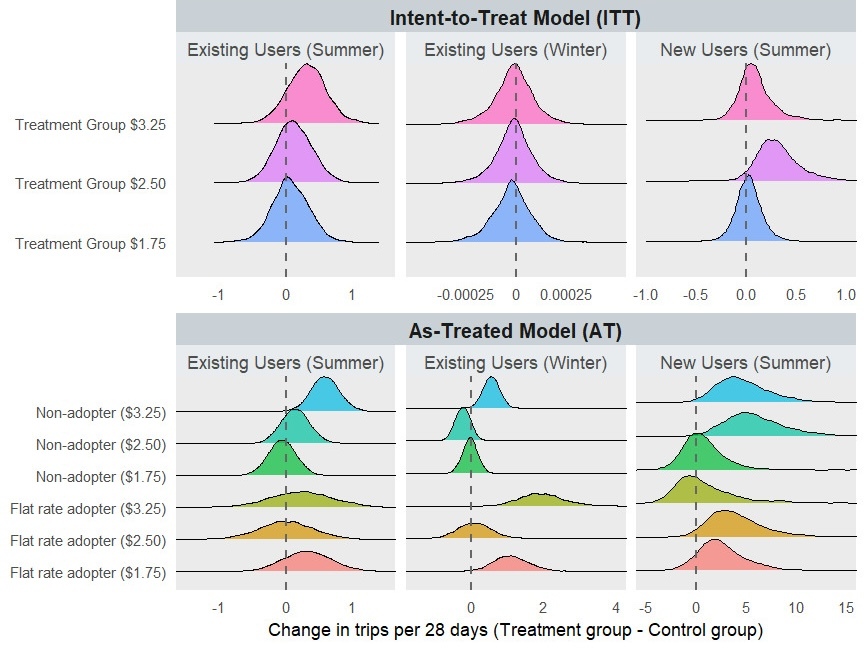
The ITT analysis indicates the flat-rate plans produced no clear effects on trip frequency for existing or new users, countering our expectation that users would respond to lower flat-rate pricing with upfront cost certainty and indicating such price structures may not motivate new first use (Figure 1). This finding aligns with our earlier pricing trial in Davis, California (Fukushige et al. 2026) and likely stems from low flat-rate uptake within the treatment groups (Table 2). The AT analysis revealed a tendency toward greater trip frequency in the $1.75 and $3.25 plan groups in the winter trial and the $1.75 plan group in the summer trial. Because the AT analysis breaks experimental randomization, the result is descriptive rather than causal; the apparent increase may partly reflect self-selection by more motivated riders.
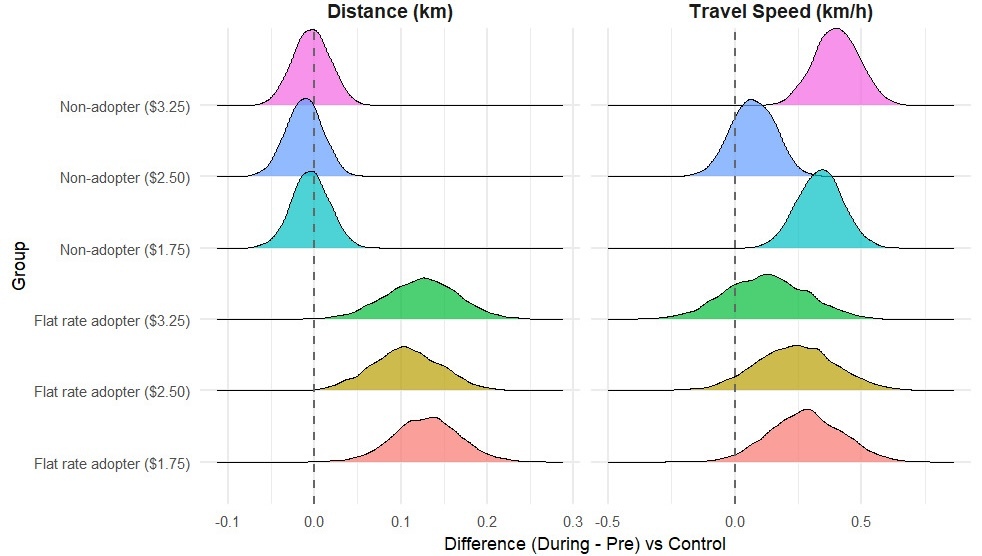
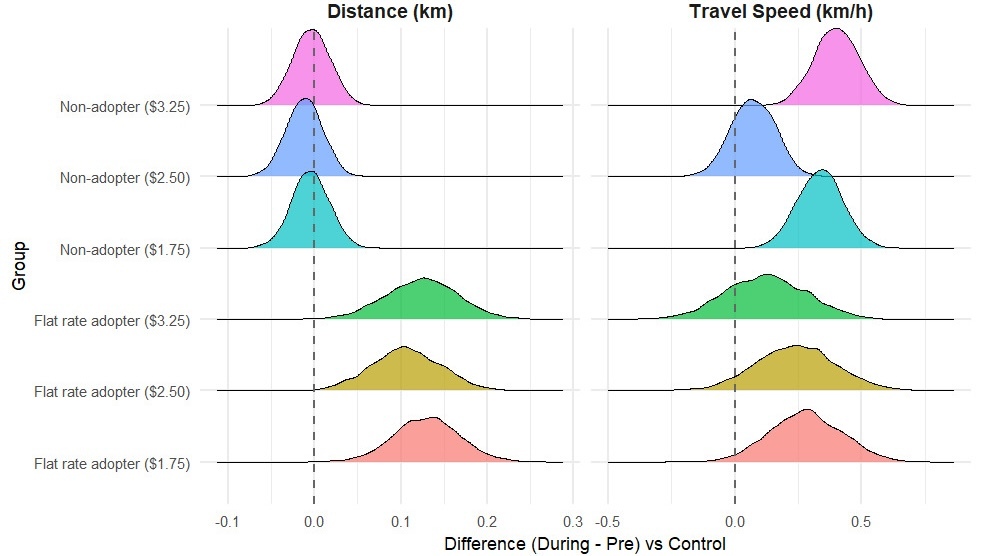
Conversely, the trip distance analysis supported our hypothesis that lower fares with upfront cost certainty encourage longer trips, demonstrated by the divergence between flat-rate adopters and controls (Figure 2). Treatment groups experienced a greater increase in average trip distance than the control group. However, without spatial origin and destination information and a participant survey, we cannot determine whether this increase reflects newly induced trips, a shift to more distant destinations given the lower marginal cost of travel, or rerouted trips to the same destinations for reasons such as perceived safety.
The travel speed results remain ambiguous (Figure 2). Contrary to expectations that lower flat rates would prompt slower, more relaxed travel, adopters traveled at similar or slightly faster speeds than controls. Furthermore, while baseline-to-trial speed among adopter groups exceeded that of the control group, the $1.75/$3.25 non-adopter groups exhibited a similar trend with stronger effects, suggesting lower flat-rates may not be the cause of speed change.
The primary results from this trial—which offered steeply discounted fares with upfront cost certainty— underscore the difficulty of overcoming SMM travel habits. While usage did not change, the interpretation remains ambiguous due to a short trial timeline, low baseline use, and heterogeneous demand profiles. Prior research suggests that SMM demand is mixed (Shaheen et al. 2015), with PAYG users riding less frequently than users with subscriptions (Fitch-Polse et al. 2023). Low use of flat rates may also stem from the cognitive load of choosing among many transportation options, providers, and fare products. Crucially, the distance models showed a significant increase in trip lengths among flat-rate adopters, indicating the cost certainty and lower marginal costs successfully caused some people to change behavior. Ultimately, shifting SMM travel habits may require extended trial durations paired with sustained, consistent promotion to give people enough time to reshape long-term travel habits.
FUNDING SOURCES
This study was made possible with funding received by the University of California Institute of Transportation Studies through the Road Repair and Accountability Act of 2017 (Senate Bill 1).
DECLARATION OF INTERESTS
Lime supported this work non-financially by providing labor to administer the study. Calvin Thigpen is a former employee of Lime and owns equity in Lime. The other authors declare that they have no known competing financial interests or personal relationships that could have appeared to influence the work reported in this paper. The research team sought to minimize the potential for conflict of interest by excluding Calvin Thigpen from data cleaning, processing, and analysis.
ACKNOWLEDGEMENTS
The authors would like to thank Lime (Brandon Haydu and Dounan Tang) for their support. This document is disseminated under the sponsorship of the State of California in the interest of information exchange and does not necessarily reflect the official views or policies of the State of California.