Processing math: 100%

This website uses cookies

We use cookies to enhance your experience and support COUNTER Metrics for transparent reporting of readership statistics. Cookie data is not sold to third parties or used for marketing purposes.

Skip to main content
null
Findings
  • Menu
  • Articles
    • Energy Findings
    • Resilience Findings
    • Safety Findings
    • Transport Findings
    • Urban Findings
    • All
  • For Authors
  • Editorial Board
  • About
  • Blog
  • search
  • X (formerly Twitter) (opens in a new tab)
  • LinkedIn (opens in a new tab)
  • RSS feed (opens a modal with a link to feed)

RSS Feed

Enter the URL below into your favorite RSS reader.

https://findingspress.org/feed
ISSN 2652-8800
Transport Findings
October 21, 2026 AEST

Estimating Pedestrian Flows and Signal Delay from Sydney Traffic-Signal Event Histories

David M. Levinson, PhD,
pedestrian flowpedestrian delaytraffic-signal historiespedestrian actuationcensored estimation
Copyright Logoccby-sa-4.0 • https://doi.org/10.32866/001c.172160
Findings
Levinson, David M. 2026. “Estimating Pedestrian Flows and Signal Delay from Sydney Traffic-Signal Event Histories.” Findings, October 20. https://doi.org/10.32866/001c.172160.
Save article as...▾
Download all (4)
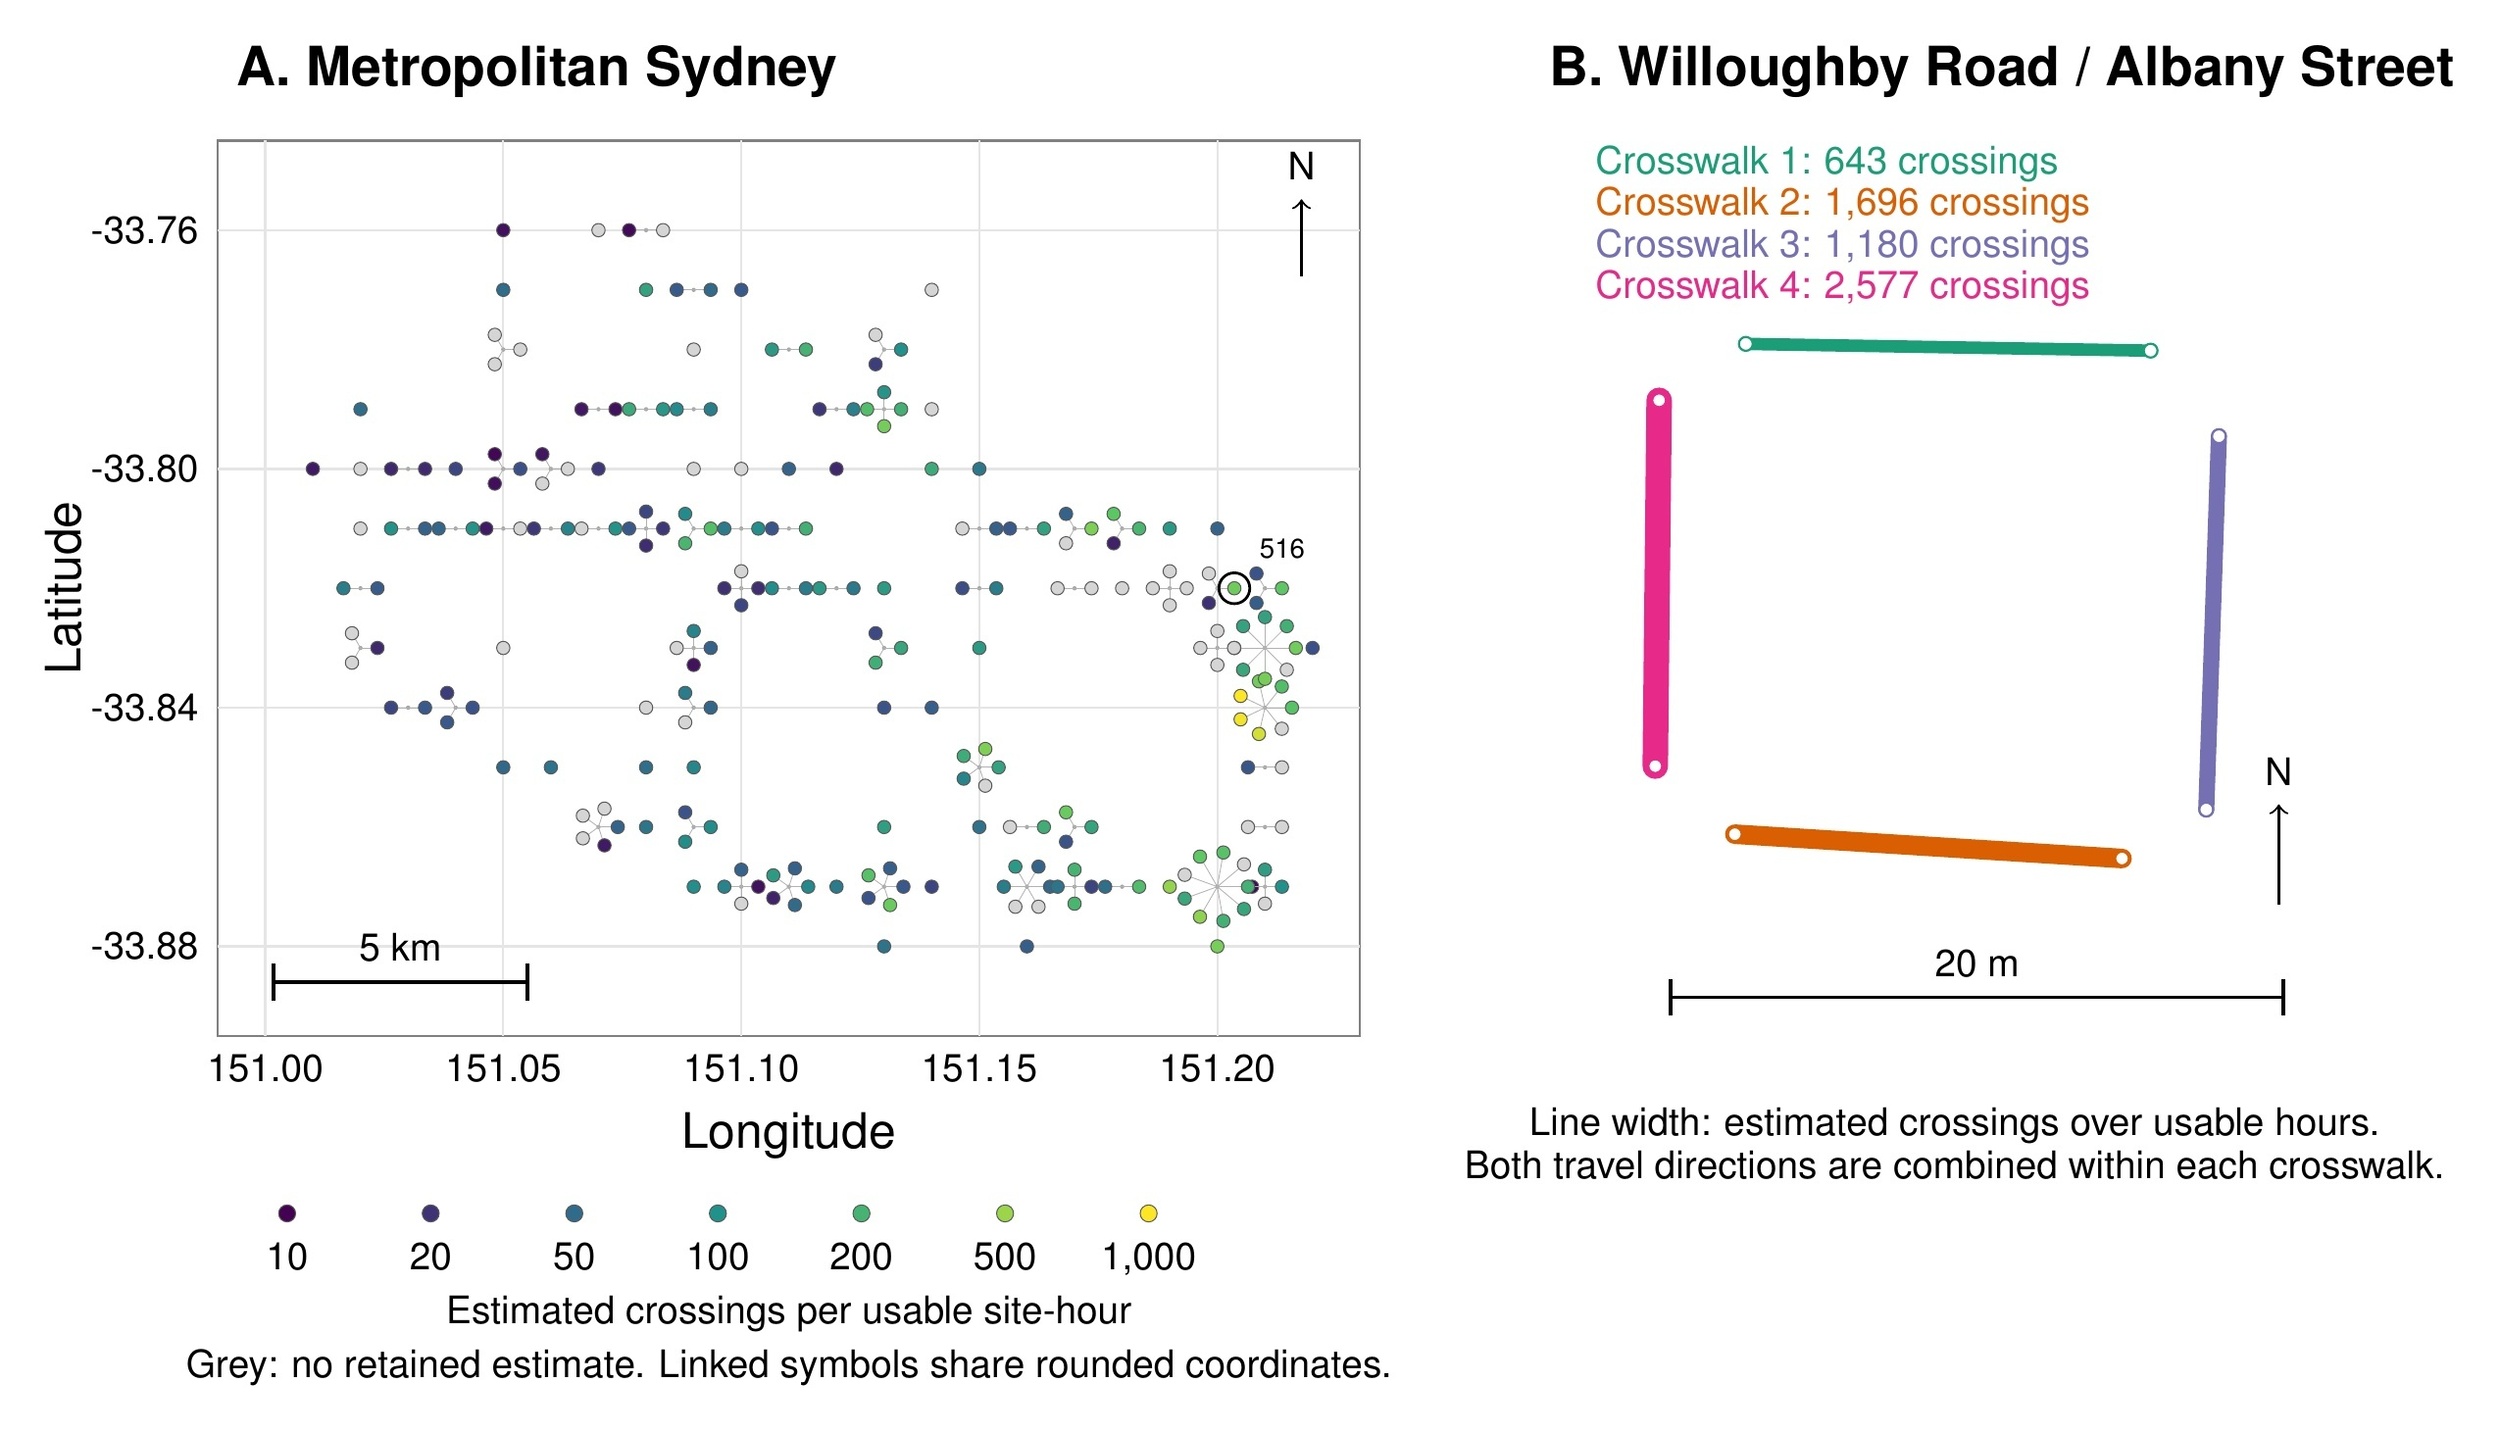
  • Figure 1. Estimated pedestrian activity on 18 September 2018. Panel A shows the 229-site inventory, with colour indicating estimated crossings per usable site-hour at 174 retained sites; grey symbols indicate sites without retained estimates. The inventory coordinates are rounded to 0.01°. Sites sharing a coordinate are separated by small display offsets and linked to that coordinate; offsets do not indicate precise site locations. The outlined symbol identifies site 516. Panel B shows its four crosswalks; line width indicates estimated crossings over usable hours, combining both travel directions.
    Download
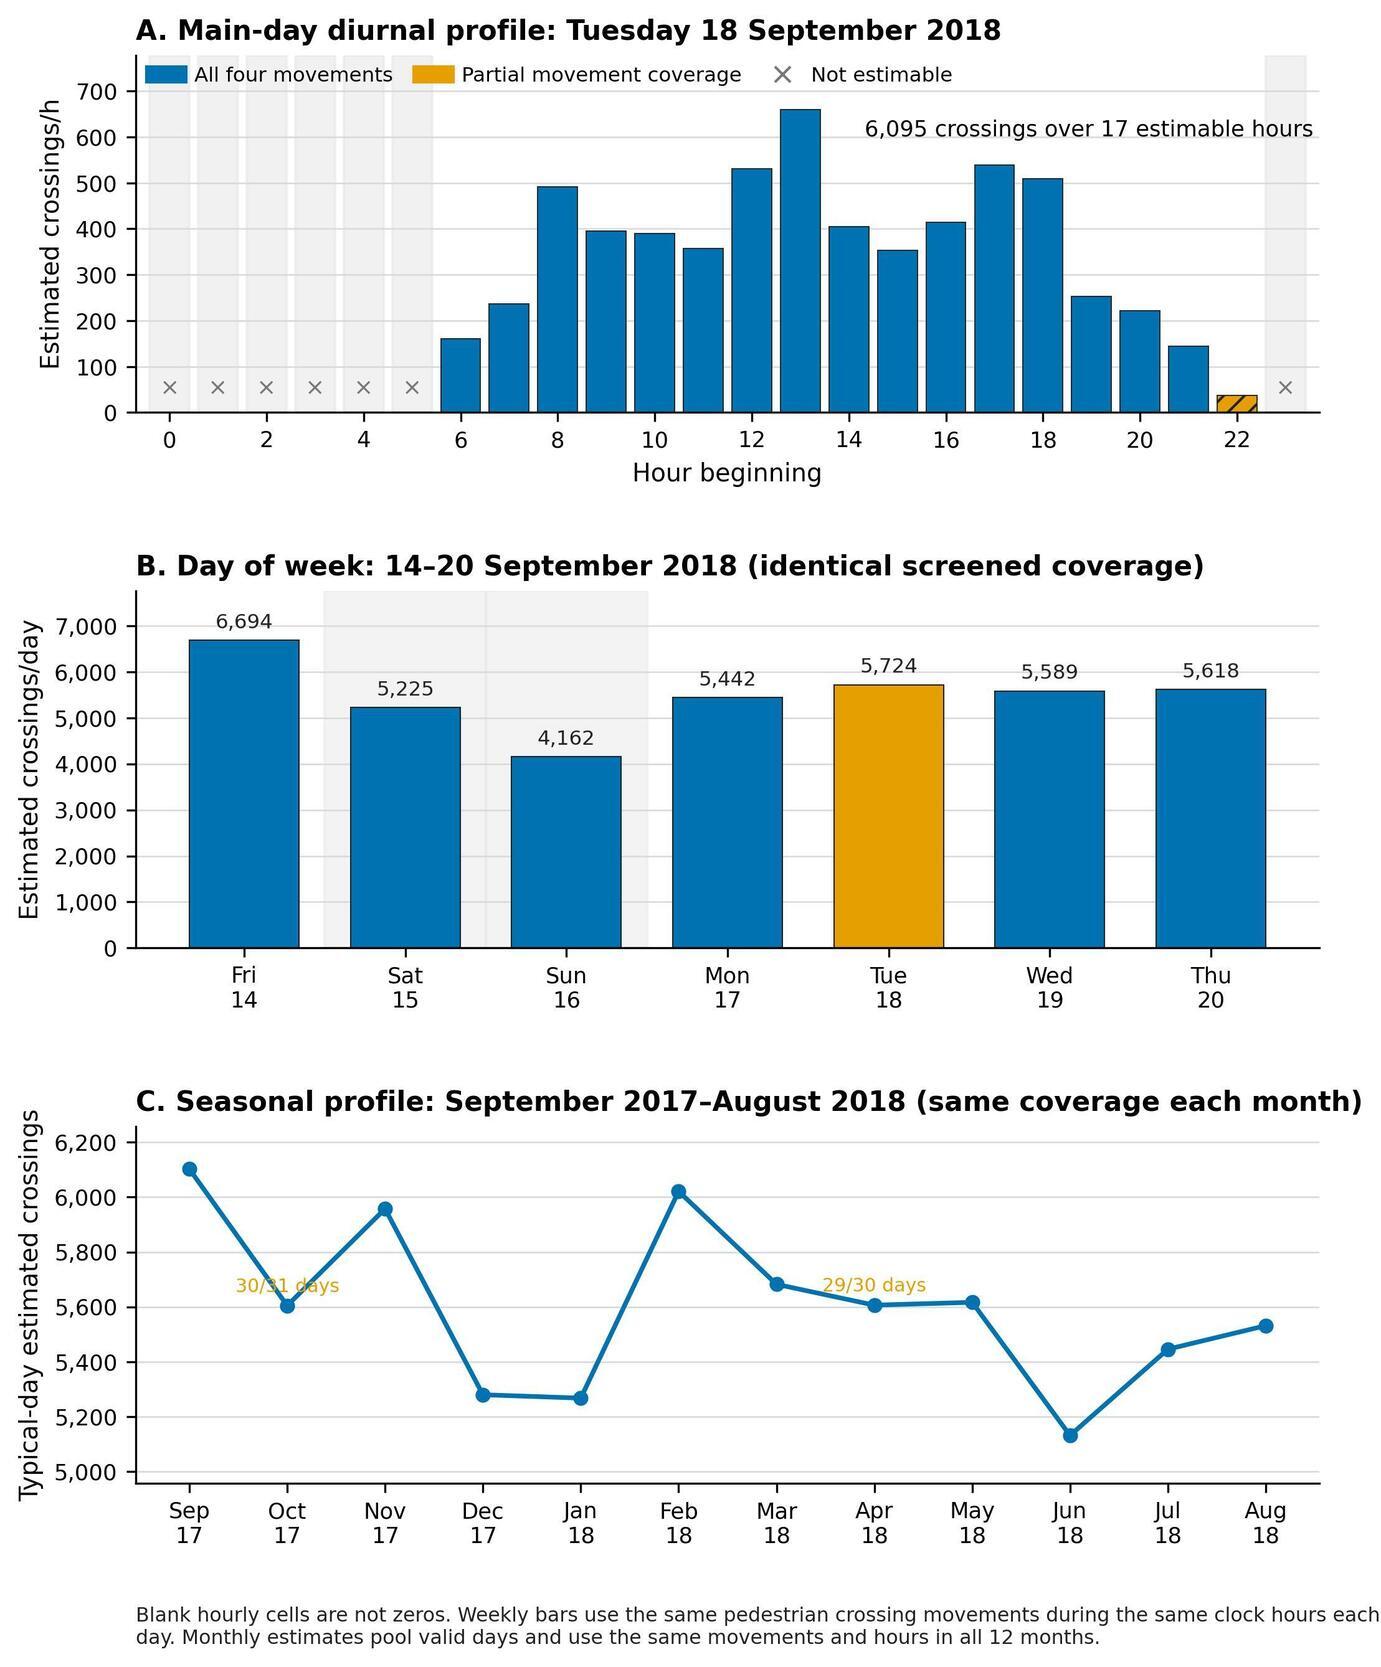
  • Figure 2. Estimated pedestrian crossings at site 516. Panel A shows the 24-hour profile for 18 September 2018. Crosses mark hours that are not estimable under the screening rules; the hatched 22:00 bar uses three of the four pedestrian movements. Panel B compares seven consecutive days using identical screened movement and clock-hour coverage; the Tuesday analysis date is highlighted. Panel C shows monthly typical-day estimates from September 2017 through August 2018 using the same movements and clock hours in every month. Orange labels identify months in which one incomplete date is excluded. Monthly values are typical-day estimates, not monthly totals.
    Download
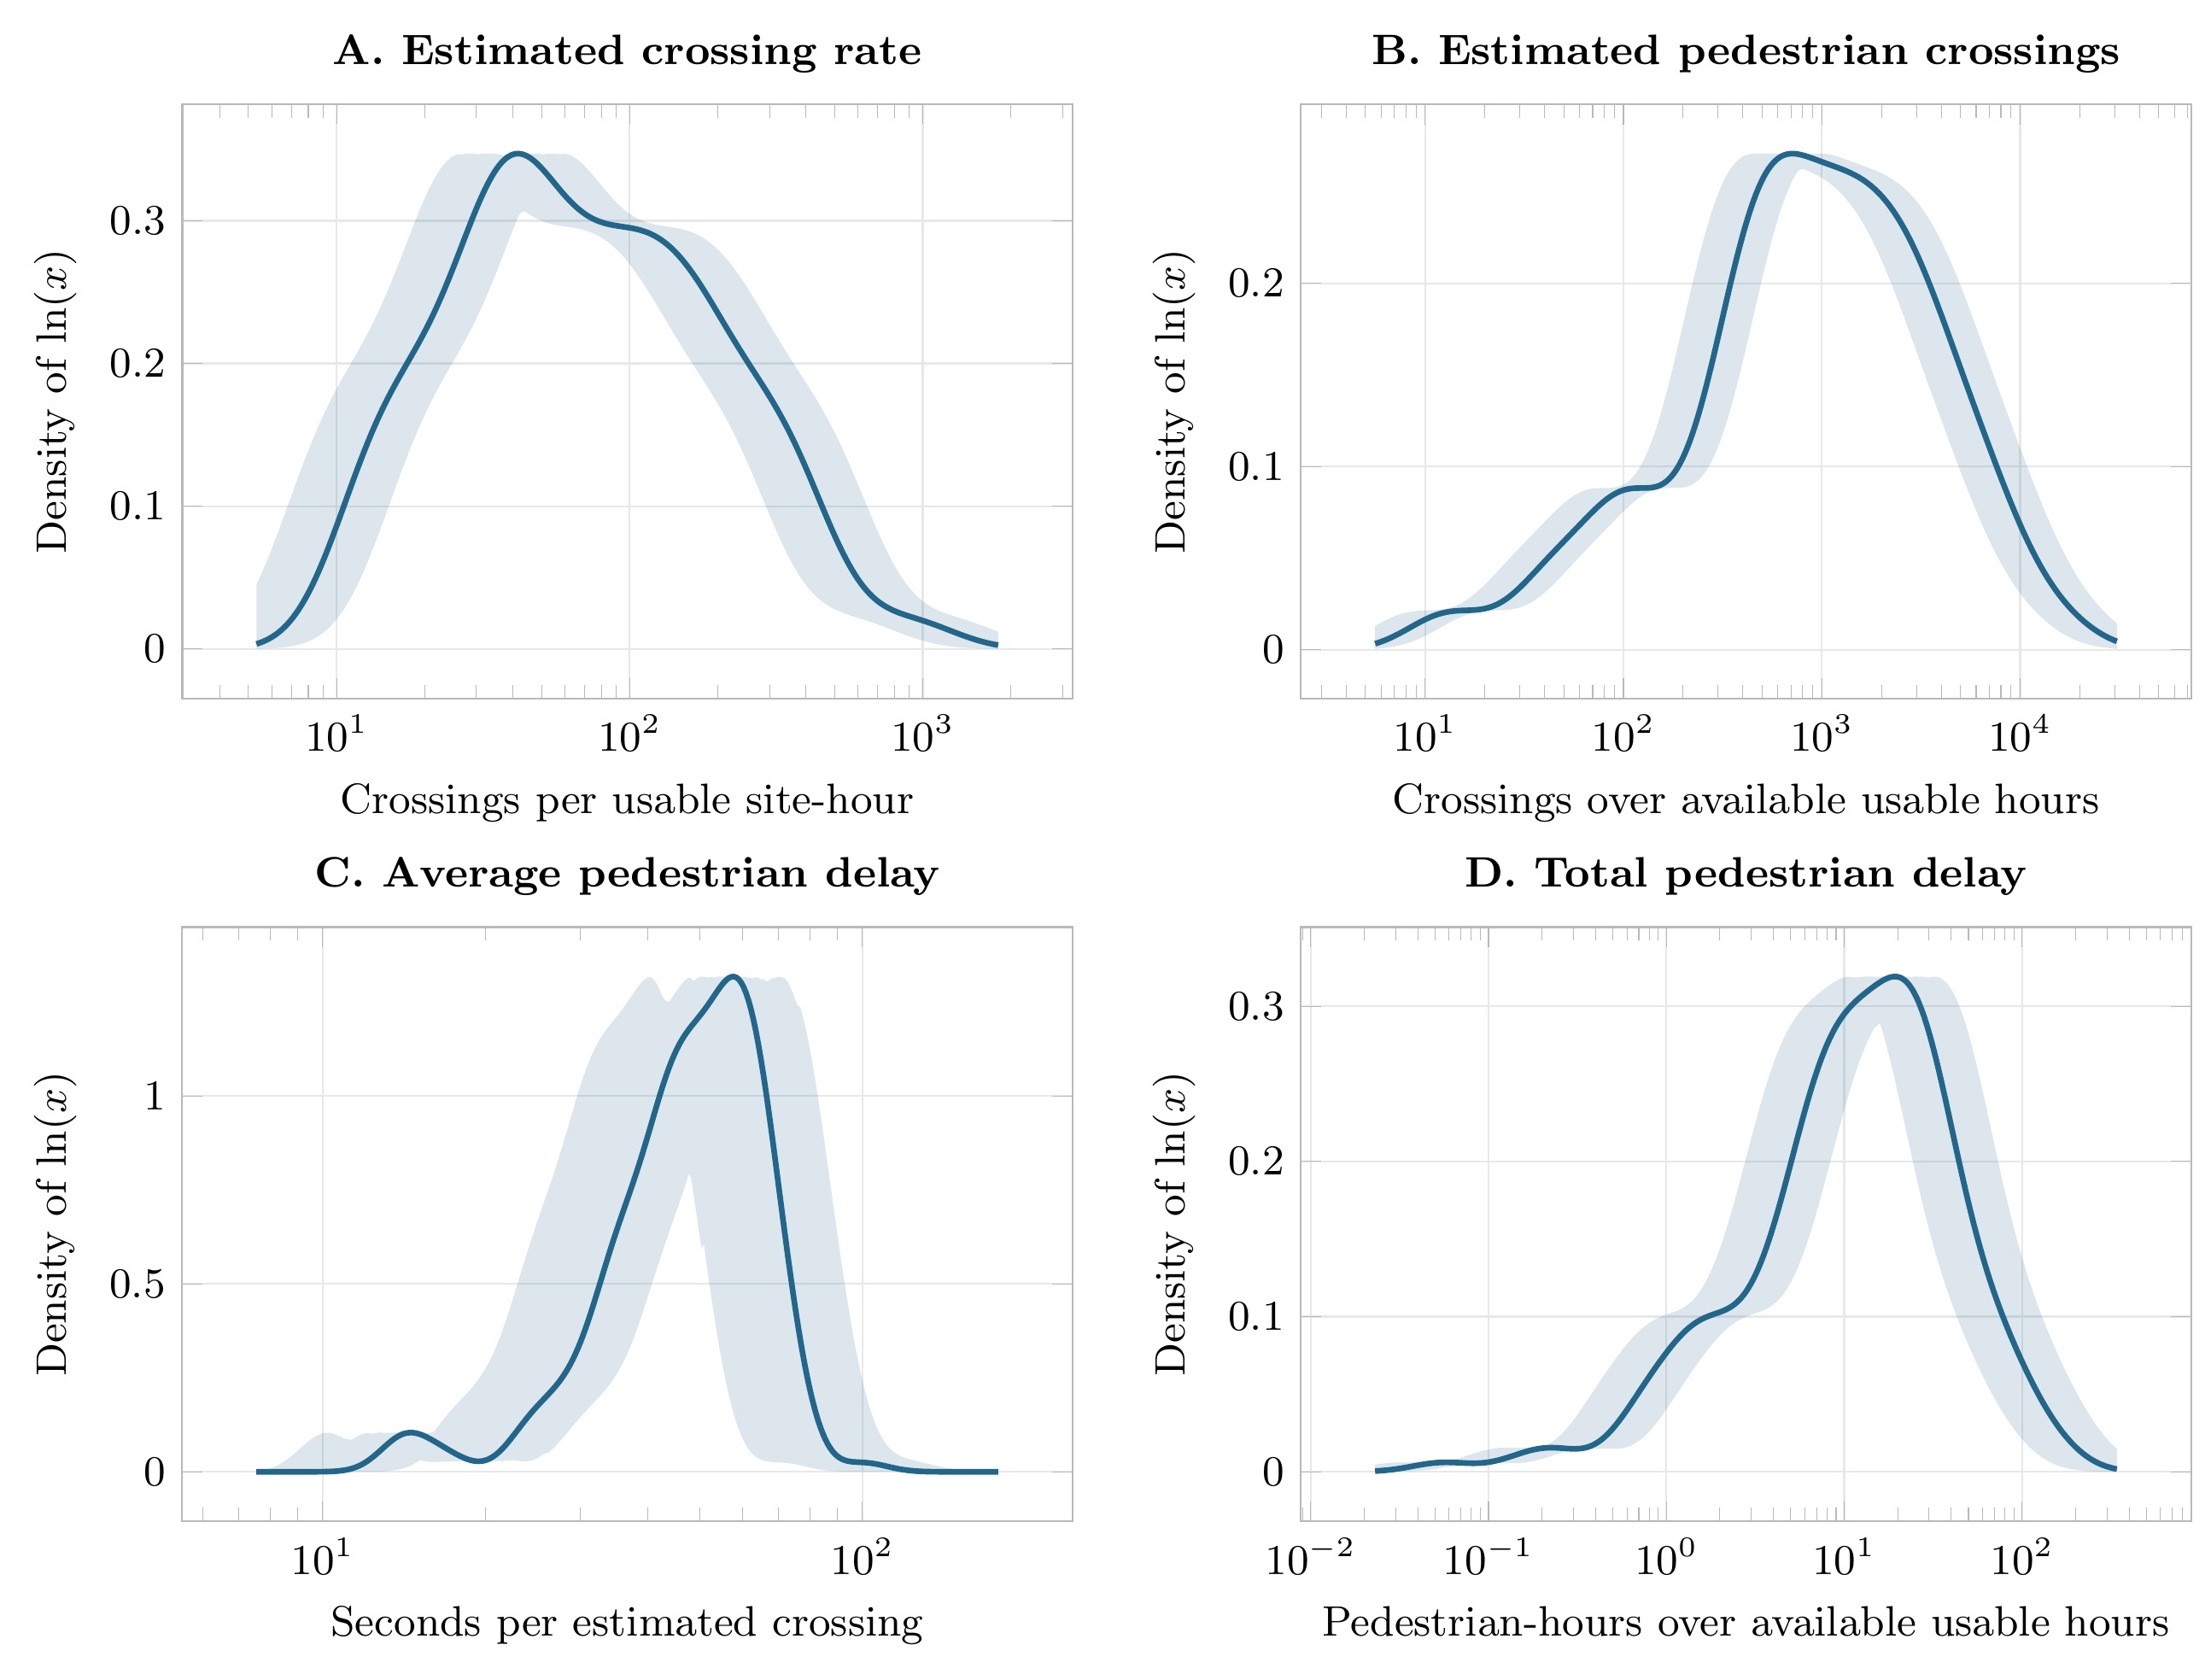
  • Figure 3. Distributions of estimated crossing flow, crossing count, average delay, and total delay across 174 intersections, with each intersection weighted equally. The horizontal axes are logarithmic; the vertical axes show smoothed probability densities of the natural logarithms of the plotted quantities. Peaks indicate values common across intersections. Delay assumes 100% compliance. The solid line uses the mean calibration factors; the shaded band shows the pointwise central 95% range of densities obtained using the individual calibration cases. Supplemental Information describes the calculation.
    Download
  • Supplemental Information: LaTeX source
    Download

Error

Sorry, something went wrong. Please try again.

If this problem reoccurs, please contact Scholastica Support

Error message:

undefined

View more stats

Abstract

Traffic-signal histories record first pedestrian calls but omit subsequent arrivals. We apply a calibrated first-actuation estimator to Sydney histories for 18 September 2018. Screening retains 5,114 movement-hours at 174 sites, yielding an estimated 331,729 crossings. Estimated delay is 3,671.5 pedestrian-hours assuming full compliance and 2,746.3 hours under a transferred behaviour scenario: 39.8 and 29.8 seconds per crossing. Median site flow is 66.5 crossings per usable hour.

1. Questions

The Sydney Coordinated Adaptive Traffic System (SCATS) records a pedestrian service request but generally adds no count for subsequent arrivals before Walk (Transport for NSW 2026). Earlier studies relate controller activity to observed pedestrian volumes (Singleton and Runa 2021; Kothuri et al. 2024; Vahedi Saheli et al. 2026); timing-based estimation instead uses signal events and an arrival model (Li and Wu 2021). We apply a separately calibrated first-actuation estimator (Levinson 2026) to ask how estimated crossings and delay vary across Sydney sites, between full-compliance and behaviour-adjusted scenarios, and over the calibration-factor distribution.

2. Methods

Data

The archive contains 12,000 daily SCATS history files recording traffic-signal controller events in Sydney: one file per control region per day, covering 16 regions and 750 dates from 1 September 2016 through 20 September 2018. We extract records for 229 intersections from these files. This application uses Tuesday, 18 September 2018. Timestamped demand, Flashing-Don’t-Walk and Walk events yield 9,626 candidate movement-hours at 187 sites.

A pedestrian movement is a controller crossing identifier. Unique spatial matches identify crosswalk orientation; counts combine both travel directions within a crosswalk. Individual travel direction is unobserved.

Method

For restrictive cycle i in movement-hour h, Yi is latency from Flashing-Don’t-Walk onset to first actuation and Ci is observed no-actuation exposure. Let Ah and Ch denote actuated and censored cycles, Kh=|Ah|, and Th the clock-time exposure over which events are counted. The Poisson waiting-time estimator is

Lh=∑i∈AhYi+∑i∈ChCi,ˆλh=Kh/Lh,ˆNeh=Thˆλh,ˆNh=ˆαNˆNeh.

Here Lh is likelihood exposure, ˆλh is an event rate, ˆNeh is an event count, and ˆNh estimates crossings.

Let Ri be first-actuation-to-Walk wait. Conditional on Ri and a constant rate, later events number ˆλhRi in expectation and wait Ri/2 on average:

ˆDi=Ri+ˆλhR2i/2,ˆDh=∑i∈AhˆDi,ˆDh,100=ˆαD,100ˆDh,ˆDh,b=ˆαD,bˆDh.

Both terms estimate event-equivalent delay. Separate empirical factors convert counts to crossings and complete delay totals to pedestrian-seconds for each target. Applying the count factor only to later arrivals would change the calibrated estimator (SI-2).

The transferred factors are ˆαN=2.203, ˆαD,100=2.212 and ˆαD,b=1.655 (Levinson 2026). Empirical case-level ranges describe transfer sensitivity. Crossings are held fixed between delay scenarios; ˆκ=ˆαD,b/ˆαD,100. Local compliance and delays before button pressing are unobserved, and calibration transfer is unverified at these sites (SI-7).

Movement-hours require at least five calls, less than 50% zero-latency calls, less than 75% no-actuation cycles, and no excluded controller pattern (SI-3).

We sum retained movements to sites. Flow divides crossings by hours containing at least one retained movement; average delay divides total delay by crossings. Site 516’s weekly comparison holds movement and clock-hour coverage constant across all seven days. Monthly estimates pool matching movements and clock hours across dates, retaining common coverage across September 2017–August 2018 and excluding two incomplete dates (SI-4).

3. Findings

Statistical screens exclude 4,290 candidate movement-hours and controller-pattern screens remove another 222, leaving 5,114 at 174 sites. Ten terminal actuations without subsequent Walk contribute to counts but not delay. Table 1 reports 331,729 estimated crossings and the calibration-transfer range.

Table 1.Count coefficient from Levinson (2026) and network estimate. The factor and crossing ranges propagate the reported calibration-factor distribution.
Calibration source Mean ˆαN Factor range Estimated crossings Crossing range
Separate calibration study 2.203 1.417–3.138 331,729 213,384–472,525

Figure 1 maps site flow and the four crosswalks at site 516 (Willoughby Road/Albany Street, Crows Nest). Site 516 contributes 6,095.4 crossings and 39.7 pedestrian-hours of delay over 17 usable hours, or 358.6 crossings/hour.
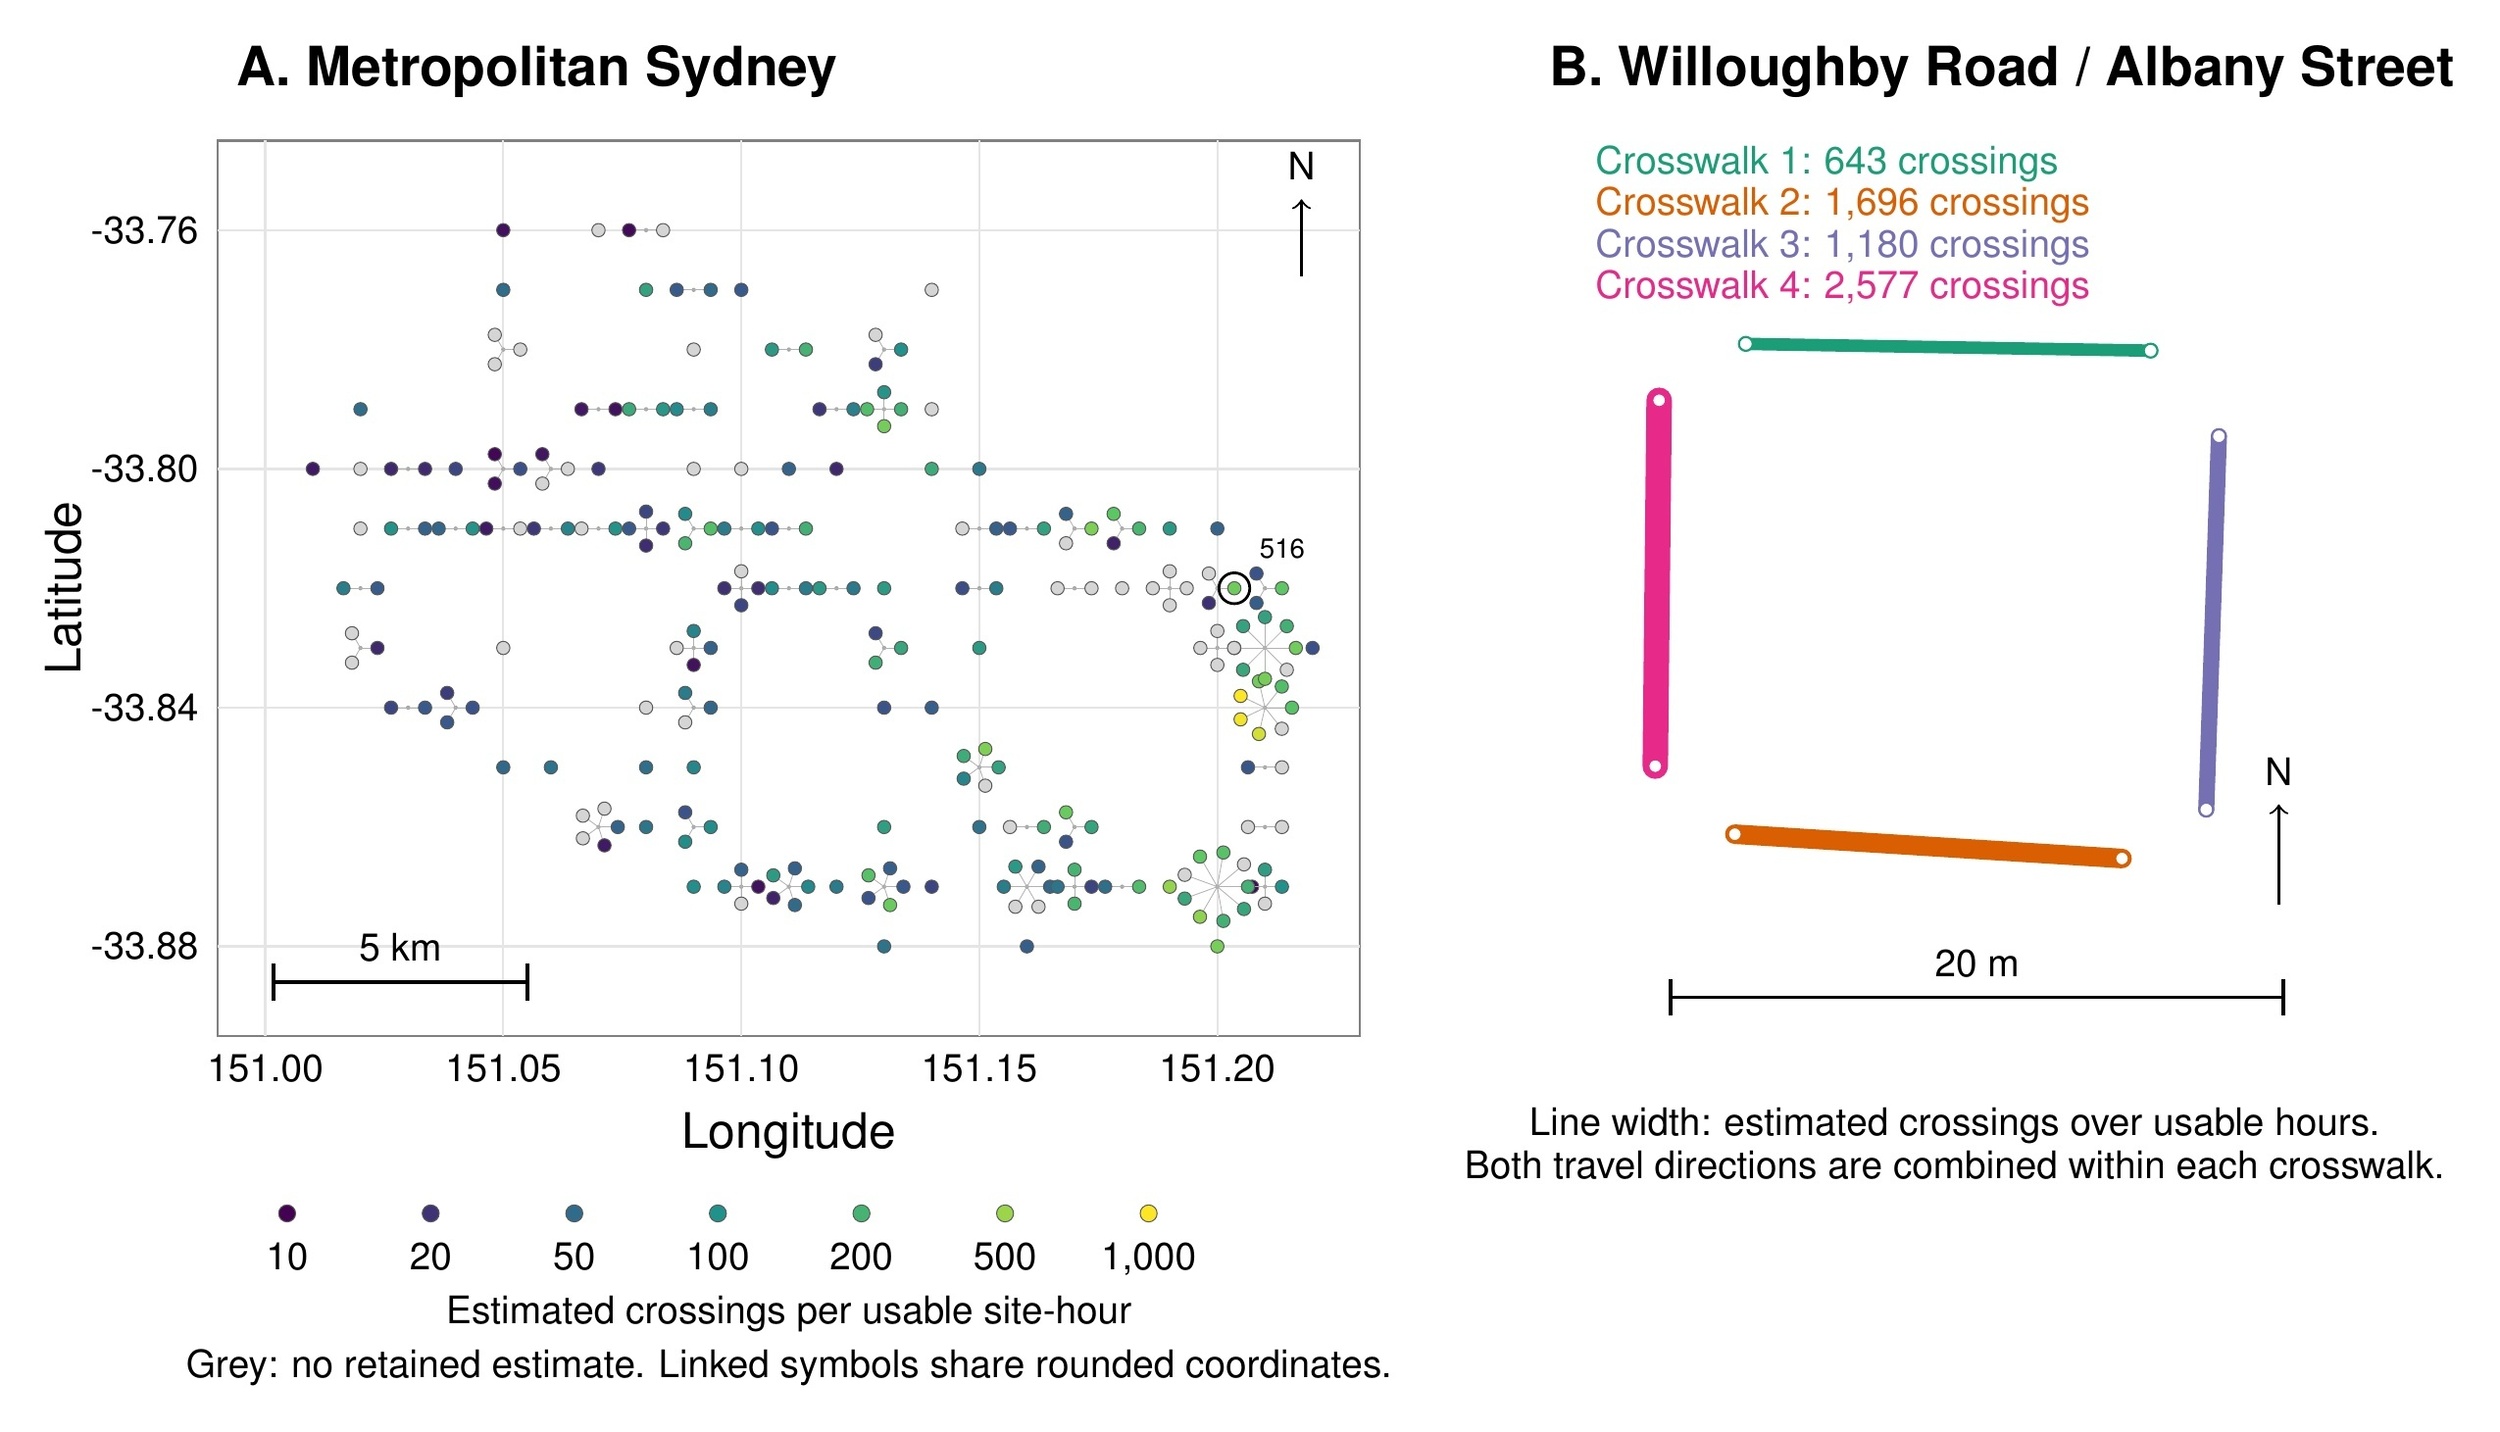
Figure 1
Figure 1.Estimated pedestrian activity on 18 September 2018. Panel A shows the 229-site inventory, with colour indicating estimated crossings per usable site-hour at 174 retained sites; grey symbols indicate sites without retained estimates. The inventory coordinates are rounded to 0.01°. Sites sharing a coordinate are separated by small display offsets and linked to that coordinate; offsets do not indicate precise site locations. The outlined symbol identifies site 516. Panel B shows its four crosswalks; line width indicates estimated crossings over usable hours, combining both travel directions.

Figure 2 shows site 516’s temporal estimates. The main-day peak is 659.1 crossings at 13:00; overnight gaps reflect sparse or absent qualifying records under the screens, independent of calibration clock-hour coverage (SI-3). Comparable daily estimates range from 4,162 on Sunday to 6,694 on Friday; monthly typical-day estimates range from 5,132 in June to 6,102 in September.
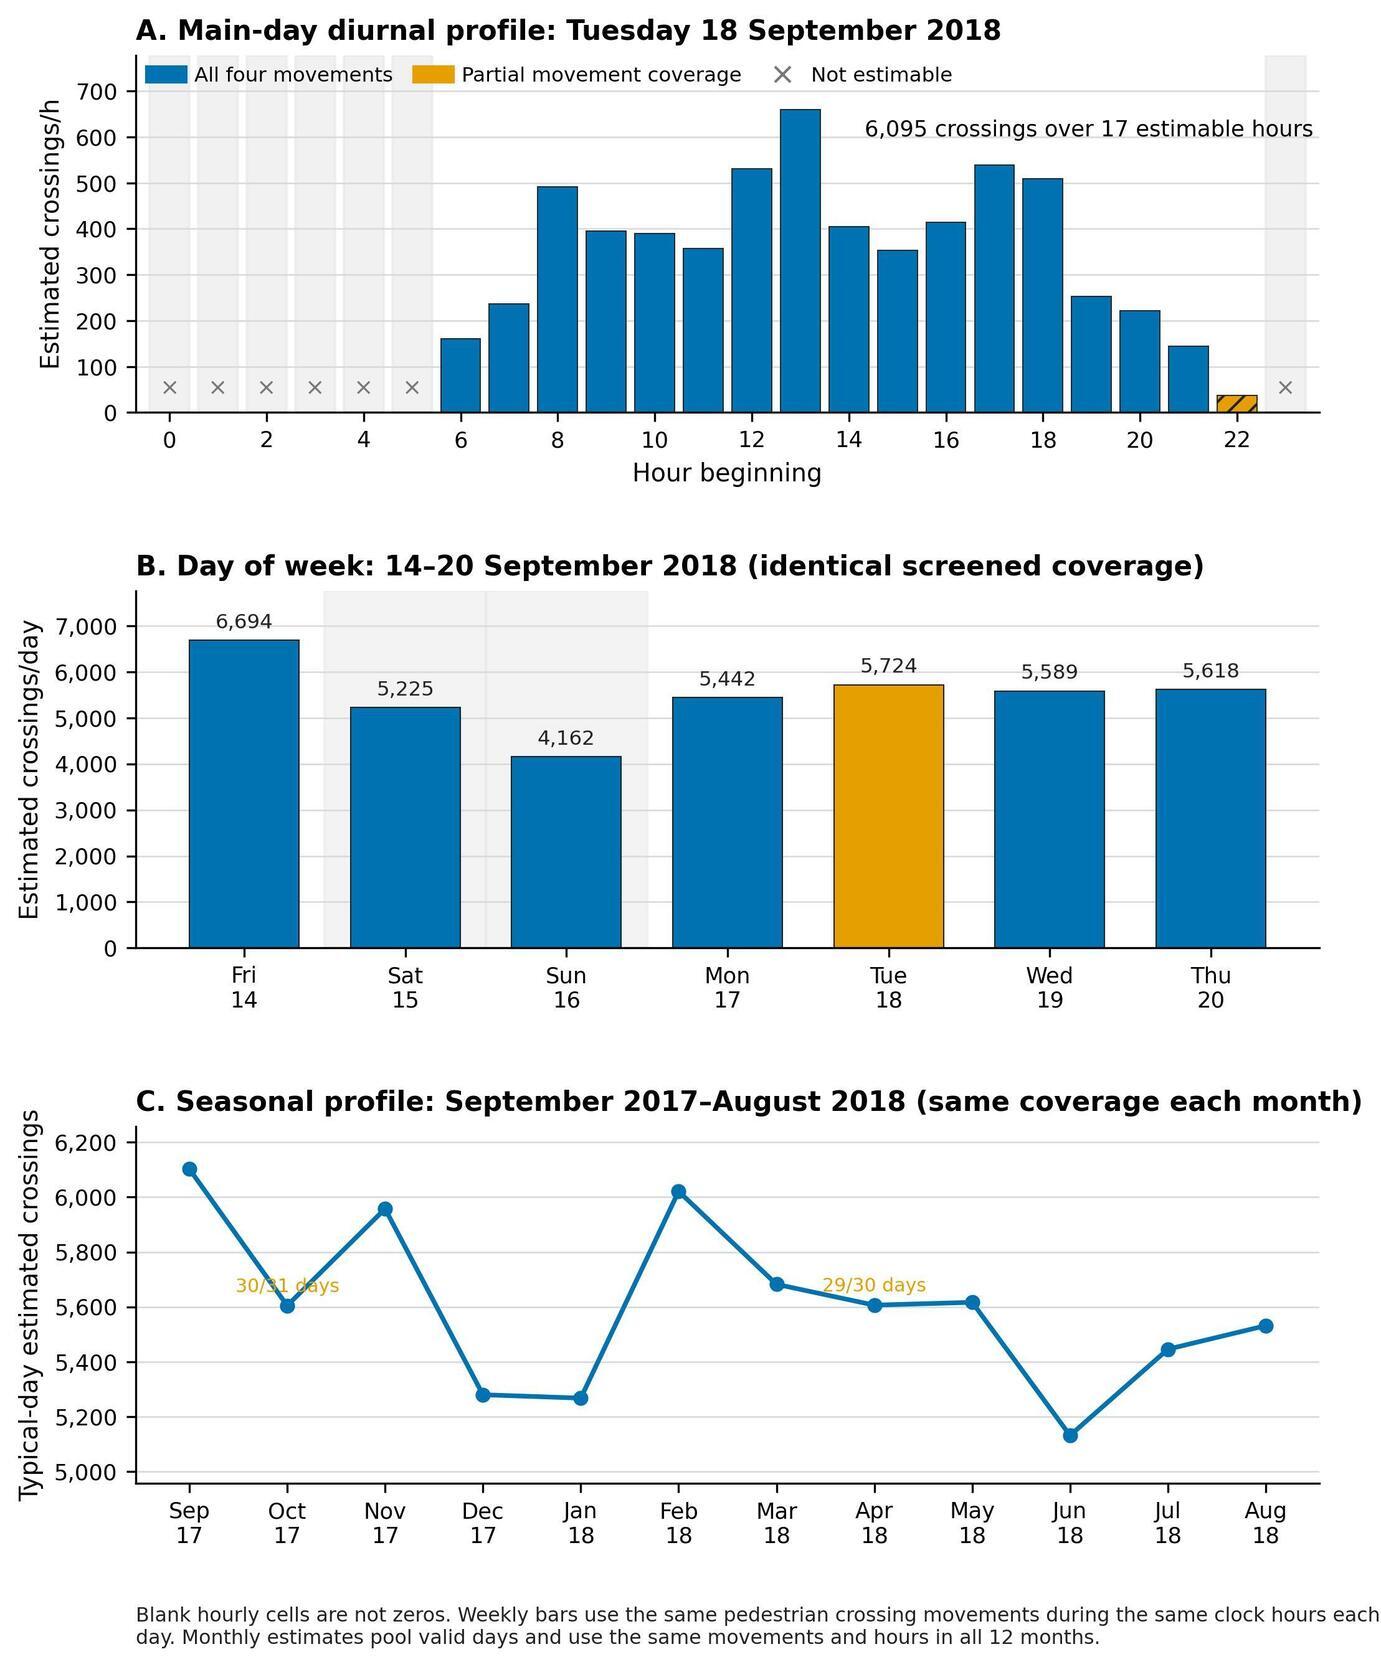
Figure 2
Figure 2.Estimated pedestrian crossings at site 516. Panel A shows the 24-hour profile for 18 September 2018. Crosses mark hours that are not estimable under the screening rules; the hatched 22:00 bar uses three of the four pedestrian movements. Panel B compares seven consecutive days using identical screened movement and clock-hour coverage; the Tuesday analysis date is highlighted. Panel C shows monthly typical-day estimates from September 2017 through August 2018 using the same movements and clock hours in every month. Orange labels identify months in which one incomplete date is excluded. Monthly values are typical-day estimates, not monthly totals.

Table 2 gives 3,671.5 pedestrian-hours assuming full compliance and 2,746.3 under the behaviour-adjusted scenario, or 39.8 and 29.8 seconds per crossing. The reduction is 925.2 hours (25.2%); it is a scenario comparison, not an observed compliance effect.

Table 2.Estimated network delay using the reported calibration coefficients, assuming 100% compliance and under the behaviour-adjusted scenario. Estimated crossings are held fixed as an analytical control.
Delay target Mean ˆαD Factor range Total (h) Total range (h) s/crossing ˆκ
Assuming 100% compliance 2.212 1.217–3.671 3,671.5 2,020.3–6,092.2 39.8 1.000
Behaviour-adjusted 1.655 0.886–2.738 2,746.3 1,470.9–4,544.9 29.8 0.748

Table 3 reports median site flow of 66.5 crossings/hour (interquartile range 32.9–150.7) and median average delay of 48.9 seconds/crossing (39.6–59.9). Figure 3 displays the four distributions and calibration-transfer envelopes. Sites contribute 1–22 usable hours (median 15), totalling 2,307. Crossing-weighting gives the lower network average delay of 39.8 seconds. The behaviour-adjusted site median is 36.6 seconds.

Table 3.Distributions across 174 sites using the reported mean calibration coefficients and assuming 100% compliance
Site metric Median Interquartile range
Estimated crossings per usable site-hour 66.5 32.9–150.7
Estimated crossings over usable hours 927 394–2,414
Average delay (s/crossing) 48.9 39.6–59.9
Total delay (pedestrian-hours) 12.9 5.2–26.9
Figure 3
Figure 3.Distributions of estimated crossing flow, crossing count, average delay, and total delay across 174 intersections, with each intersection weighted equally. The horizontal axes are logarithmic; the vertical axes show smoothed probability densities of the natural logarithms of the plotted quantities. Peaks indicate values common across intersections. Delay assumes 100% compliance. The solid line uses the mean calibration factors; the shaded band shows the pointwise central 95% range of densities obtained using the individual calibration cases. Supplemental Information describes the calculation.

Acknowledgments

Anthropic Claude and OpenAI Codex assisted with code review and manuscript editing; the author is responsible for verifying the analysis and text.

Data and Code Availability

Raw SCATS controller histories cannot be redistributed under the archive terms. Reproducible scripts and derived, nonidentifying movement-hour, site, calibration-factor, and figure-source outputs are available at https://github.com/dlevinson/paper-2026-25-estimating-pedestrian-flows-and-signal-delay-from-sydney-trafficsignal-event-histories.

Funding and Conflict of Interest

The author reports no project-specific funding or conflict of interest.

Submitted: August 12, 2026 AEST

Accepted: October 01, 2026 AEST

References

Kothuri, Sirisha, Patrick Singleton, Mahyar Vahedi Saheli, Elizabeth Yates, and Joseph Broach. 2024. Active Transportation Counts from Existing On-Street Signal and Detection Infrastructure. FHWA-OR-RD-24-03. Oregon Department of Transportation. https:/​/​www.oregon.gov/​odot/​Programs/​ResearchDocuments/​SPR857_ACTIVE-TRANSPORTATION-COUNTS.pdf.
Levinson, David M. 2026. “Testing Pedestrian Flow and Delay Estimation from First-Actuation Latency.” Findings. https:/​/​doi.org/​10.32866/​001c.166369.
Google Scholar
Li, Xiaofeng, and Yao-Jan Wu. 2021. “Real-Time Estimation of Pedestrian Volume at Button-Activated Midblock Crosswalks Using Traffic Controller Event-Based Data.” Transportation Research Part C: Emerging Technologies 122: 102876. https:/​/​doi.org/​10.1016/​j.trc.2020.102876.
Google Scholar
Singleton, Patrick A., and Ferdousy Runa. 2021. “Pedestrian Traffic Signal Data Accurately Estimates Pedestrian Crossing Volumes.” Transportation Research Record 2675 (6): 429–40. https:/​/​doi.org/​10.1177/​0361198121994126.
Google Scholar
Transport for NSW. 2026. “Who We Are.” Sydney Coordinated Adaptive Traffic System. https:/​/​scats.nsw.gov.au/​who-we-are.
Vahedi Saheli, Mahyar, Elizabeth O’Neill Yates, Patrick Singleton, Sirisha Kothuri, and Joseph Broach. 2026. “Pedestrian Volumes from Push-Button Traffic Signal Data in Oregon: Estimating Models and Assessing Model Transferability.” Journal of Transportation Engineering, Part A: Systems 152 (9). https:/​/​doi.org/​10.1061/​JTEPBS.TEENG-9266.
Google Scholar

Attachments

Powered by Scholastica, the modern academic journal management system