
1. Questions
Parks and green spaces are highly valued in urban contexts, given their health, social, and environmental benefits (Ugolini et al. 2022). Accordingly, municipalities are developing strategies to understand factors driving park use to ultimately promote it. A substantive body of research has studied park use (Endalew Terefe and Hou 2024), with most approaching the question through the lens of visit frequency. We argue that park use is inherently more complex than visit frequency alone, as individuals differ in not only the frequency, but also their travel behaviors and visit habits (e.g. type and number of parks visited).
In this context, we pose two research questions:
-
Are there identifiable visitor behavior profiles among adult park users?
-
Do these visit-based profiles differ by socio-demographic characteristics or accessibility to parks?
2. Methods
Data used in this study comes from a survey disseminated through an online market research panel in 2021 based on a representative sample of respondents (gender and age) from the City of Montréal, Canada. The final sample included 638 adults aged 18 and older. The survey included questions about socio-demographics, travel behavior, and park use. Respondents were asked to report the parks that they most frequently visited in Montreal, up to a maximum of three. More survey details are available in previous studies (Cournoyer et al. 2026; El Murr et al. 2023; 2025).
To answer our research questions, we used k-prototype clustering (Szepannek 2019), which can consider both numerical and categorical variables. We included variables related to park visit behavior, accessibility and transport characteristics (Table 1). Visit behavior was derived using k-means clustering based on the frequencies (1 to 5) of the four visit contexts (alone, pets, groups, and children), each centered relative to the respondent’s mean frequency across the four contexts. The final k-prototype clustering process was run five times using different random seeds and results were compared to assess stability and repeatability.
Table 2 presents descriptive statistics. Variables treated as continuous in the clustering analysis (minimum distance, maximum distance, park visit frequency, and number of different parks visited) were standardised (z-scores) prior to clustering. All remaining variables were treated as categorical. The k-prototype analysis used clustMixType’s default estimated lambda. The elbow method (Szepannek 2019), together with profile interpretability, was used to select the number of clusters.
An exploratory analysis was then conducted to assess how socio-demographic and accessibility variables vary across clusters. Statistical tests including ANOVA, Tukey’s HSD, and chi-squared were applied to identify significant inter-cluster differences for sociodemographic and accessibility variables. Table 3 presents the variables that were considered. Three calculated accessibility measures were based on a 15-minute walk: (1) quality (CIPQAY index), (2) number, and (3) park surface area. The CIPQAY index considers 17 features of all parks accessible within a 15-minute walk from the individual’s residence. Although it was initially developed for youth, it has been positively associated with adults’ perceived accessibility and satisfaction (El Murr et al. 2023). Respondents also declared their perceived accessibility to parks based on four distinct statements.
3. Findings
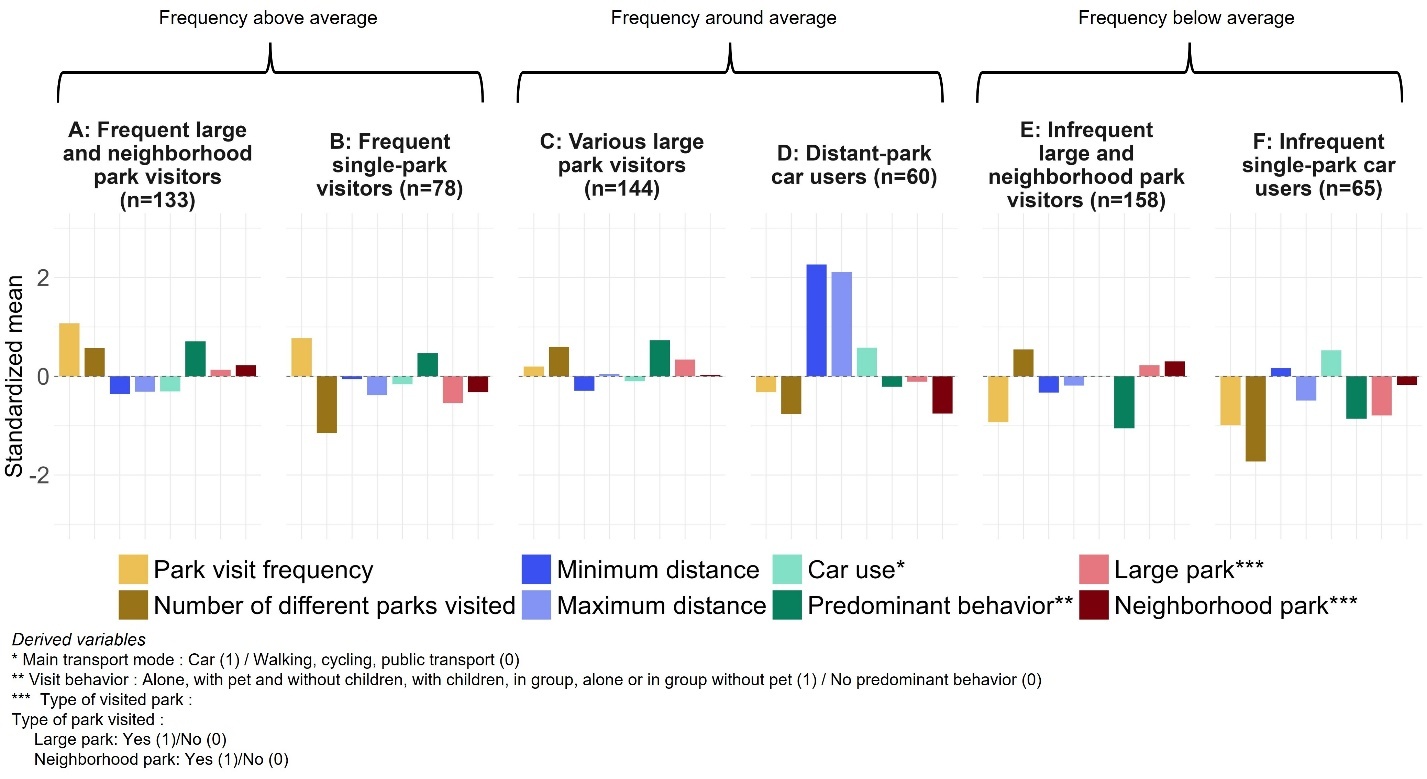
Figure 1 presents the variables’ standardized values (z-scores) for the six identified visitor profiles. For the categorical variables, scores for derived variables are presented to facilitate interpretation (see Figure 1 legend). Also, it is important to note that a negative z-score does not indicate a negative variable value, given that all variable means are above 0. For example, a negative z-score for the number of different parks visited (mean of 2.55; Table 2) indicates that the corresponding profile mean is below the overall sample mean.
Results are compared by pairs of clusters based on frequencies (above average, average, and below average). Clusters A and B (above average) tend to visit parks close to their residential location, by active and public transport modes (low car use), and exhibit a predominant behavior. However, findings reveal an important distinction in terms of habits: individuals in Cluster B typically visit a single park (always the same), whereas Cluster A visit different parks. Clusters C and D, with an average frequency, are different in most respects. Individuals in Cluster C visit large parks, close to their residential location, using active and public transport modes. Conversely, Cluster D reflects car users that visit distant parks. Finally, Clusters E and F exhibit the lowest park visit frequency with the latter including a larger share of car users. Another difference is the types and number of different parks visited: individuals in Cluster F typically visit only one park, while those in Cluster E visit multiple different parks, including both large and neighborhood parks.
.jpeg)
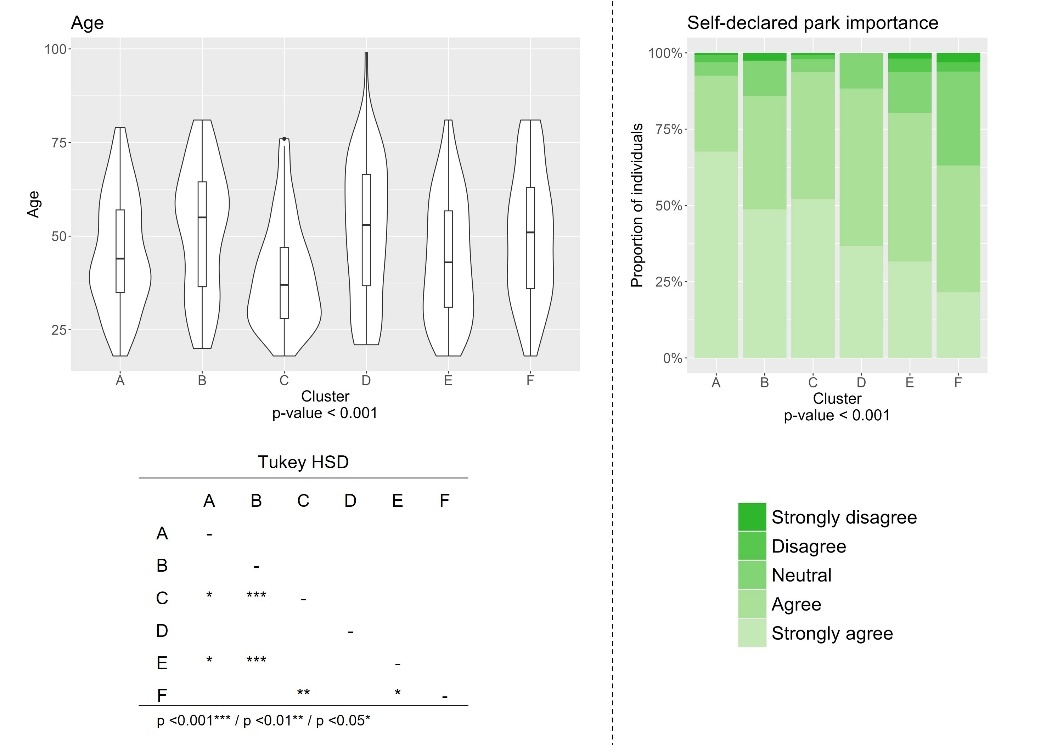
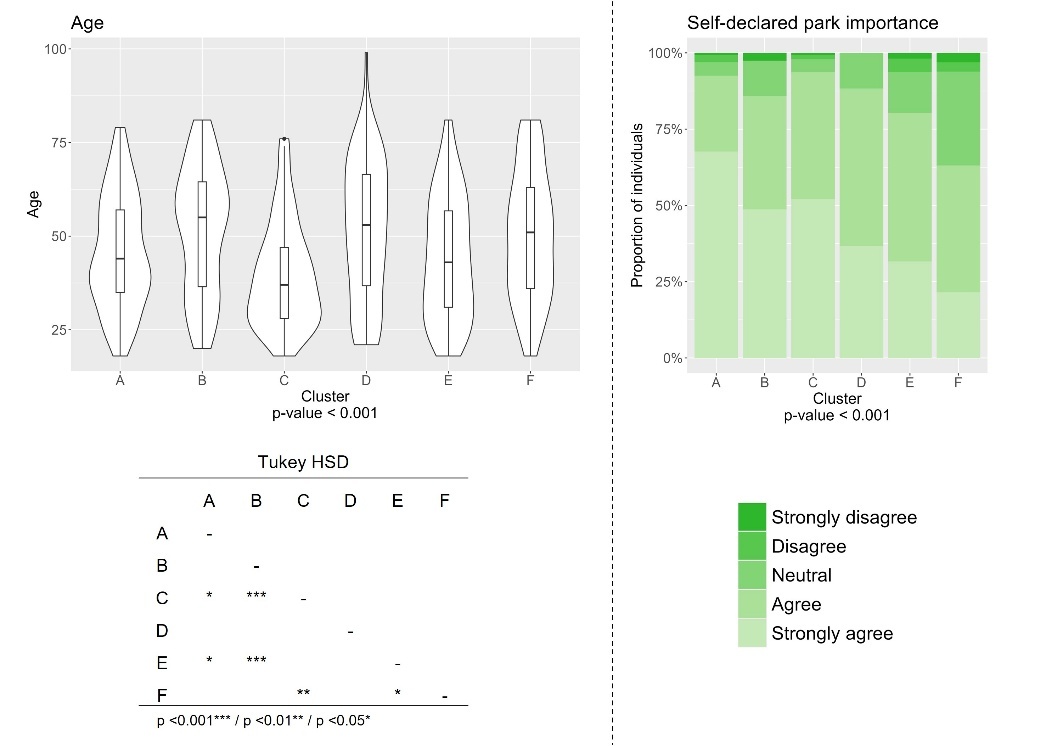
We then explore the relationship between visitor profiles and socio-demographic and attitude variables, with statistically significant results presented in Figure 2. Of eight variables tested, two are statistically significant: age and self-declared park importance. Clusters C and E exhibit a statistically lower age than Clusters A, B and D. As for the self-declared importance of parks, we observe significant discrepancies between clusters, with agreement dropping from the highest-frequency cluster (A) to the lowest-frequency cluster (F).
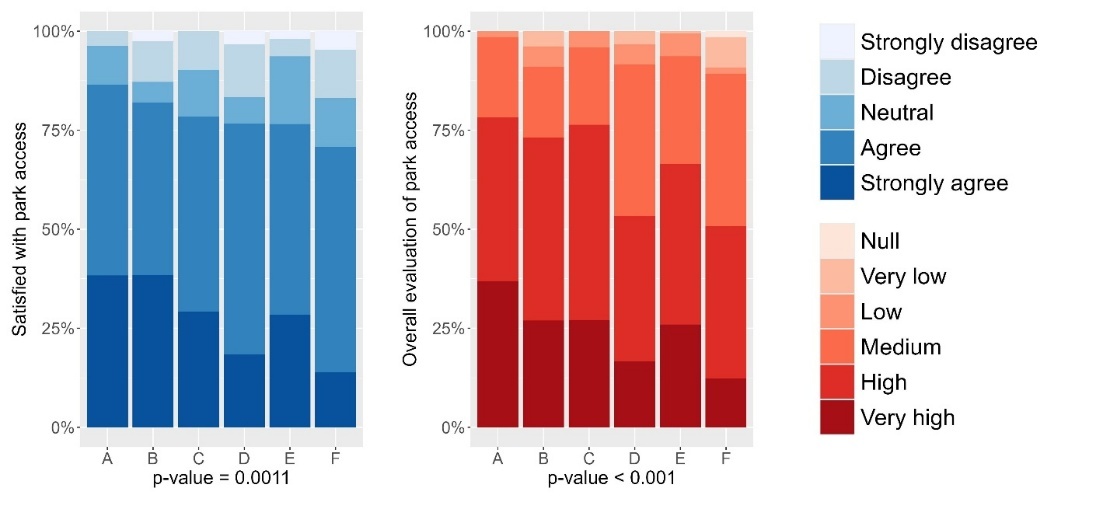
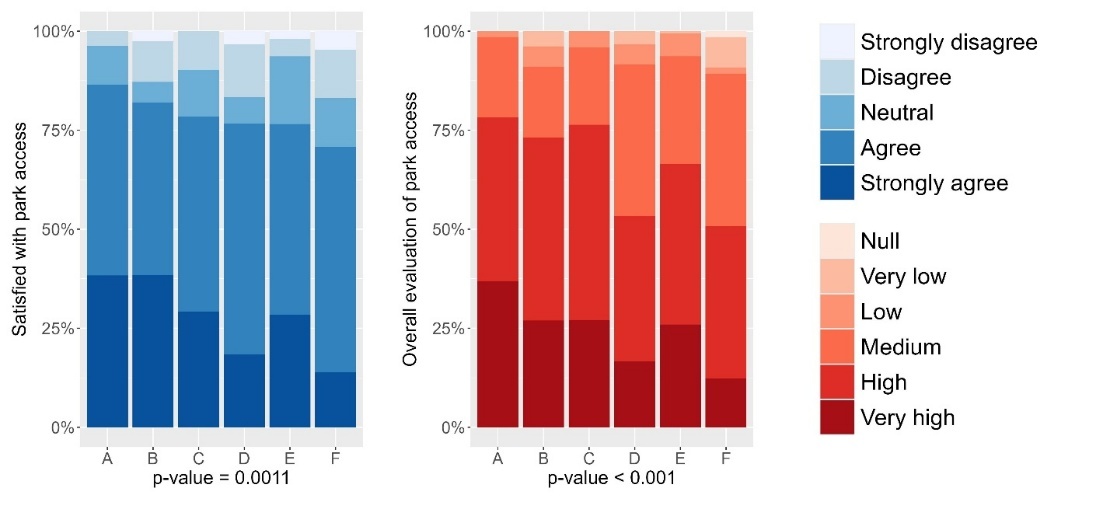
In exploring the relationship between our visitor profiles and both calculated and perceived accessibility levels, two (of four) perceived accessibility variables show statistically significant coefficients (Figure 3), whereas the three calculated accessibility measures do not reveal statistically significant differences. The two perceived measures shown follow similar trends (Figure 3). Globally, perceived accessibility decreases as frequency decreases (from A to F), apart from Cluster D. Notably, Clusters D and F follow similar patterns, in that they both display the lowest perceived accessibility levels and highest car use (Figure 1).
We conclude that distinct visit-based profiles exist among adult park users, even when considering similar park visit frequency. Two cluster pairs (A-B and E-F) display similar visit frequencies but differ in terms of travel distance, number and types of parks visited, and perceived accessibility. Further, among the socio-demographic variables examined, only age showed a statistically significant association with clusters, while the calculated accessibility measures did not differ significantly across the six profiles. These observations demonstrate that park use is inherently multi-dimensional, as individuals with similar visit frequencies may exhibit markedly different travel and visit patterns. To study park use behavior, future research should go beyond park visit frequency alone and look into perceptions, preferences, and needs of park users.
Acknowledgments
The authors would like to thank the Ville de Montréal, Montréal en commun, the Laboratoire de l′innovation urbaine de Montréal for supporting this research, and Ella Osdoba for her help in reviewing the paper. Thanks also to the anonymous reviewers for their constructive feedback.