Loading [Contrib]/a11y/accessibility-menu.js
Skip to main content
null
Findings
  • Menu
  • Articles
    • Energy Findings
    • Resilience Findings
    • Safety Findings
    • Transport Findings
    • Urban Findings
    • All
  • For Authors
  • Editorial Board
  • About
  • Blog
  • covid-19
  • search

RSS Feed

Enter the URL below into your favorite RSS reader.

https://findingspress.org/feed
Transport Findings
September 11, 2020 AEST

Low Traffic Neighbourhoods, Car Use, and Active Travel: Evidence from the People and Places Survey of Outer London Active Travel Interventions

Rachel Aldred, Anna Goodman,
low traffic neighbourhoodactive travelcar usecar ownershipmotor traffic reduction
Copyright Logoccby-sa-4.0 • https://doi.org/10.32866/001c.17128
Findings
Aldred, Rachel, and Anna Goodman. 2020. “Low Traffic Neighbourhoods, Car Use, and Active Travel: Evidence from the People and Places Survey of Outer London Active Travel Interventions.” Findings, September. https:/​/​doi.org/​10.32866/​001c.17128.
Save article as...▾
Download all (3)
  • Figure 1: new cycle track, Kingston (Rachel Aldred)
    Download
  • Figure 2: modal filter, Waltham Forest (Rachel Aldred)
    Download
  • Figure 3: intervention and control areas, Wave 3
    Download

Sorry, something went wrong. Please try again.

If this problem reoccurs, please contact Scholastica Support

Error message:

undefined

View more stats

Abstract

This paper reports on analysis of impacts of active travel interventions in Outer London between 2016-19. We find larger effects (decreased car ownership and use, increased active travel) in intervention areas where Low Traffic Neighbourhoods (LTNs) were introduced. Decreased car ownership and use is only found in such areas. Sample size for LTN areas is small and hence uncertainty about effect magnitude is large, but effect direction is consistent. This suggests that to reduce car use as well as increase active travel, LTNs are an important part of the intervention toolbox.

Research Questions

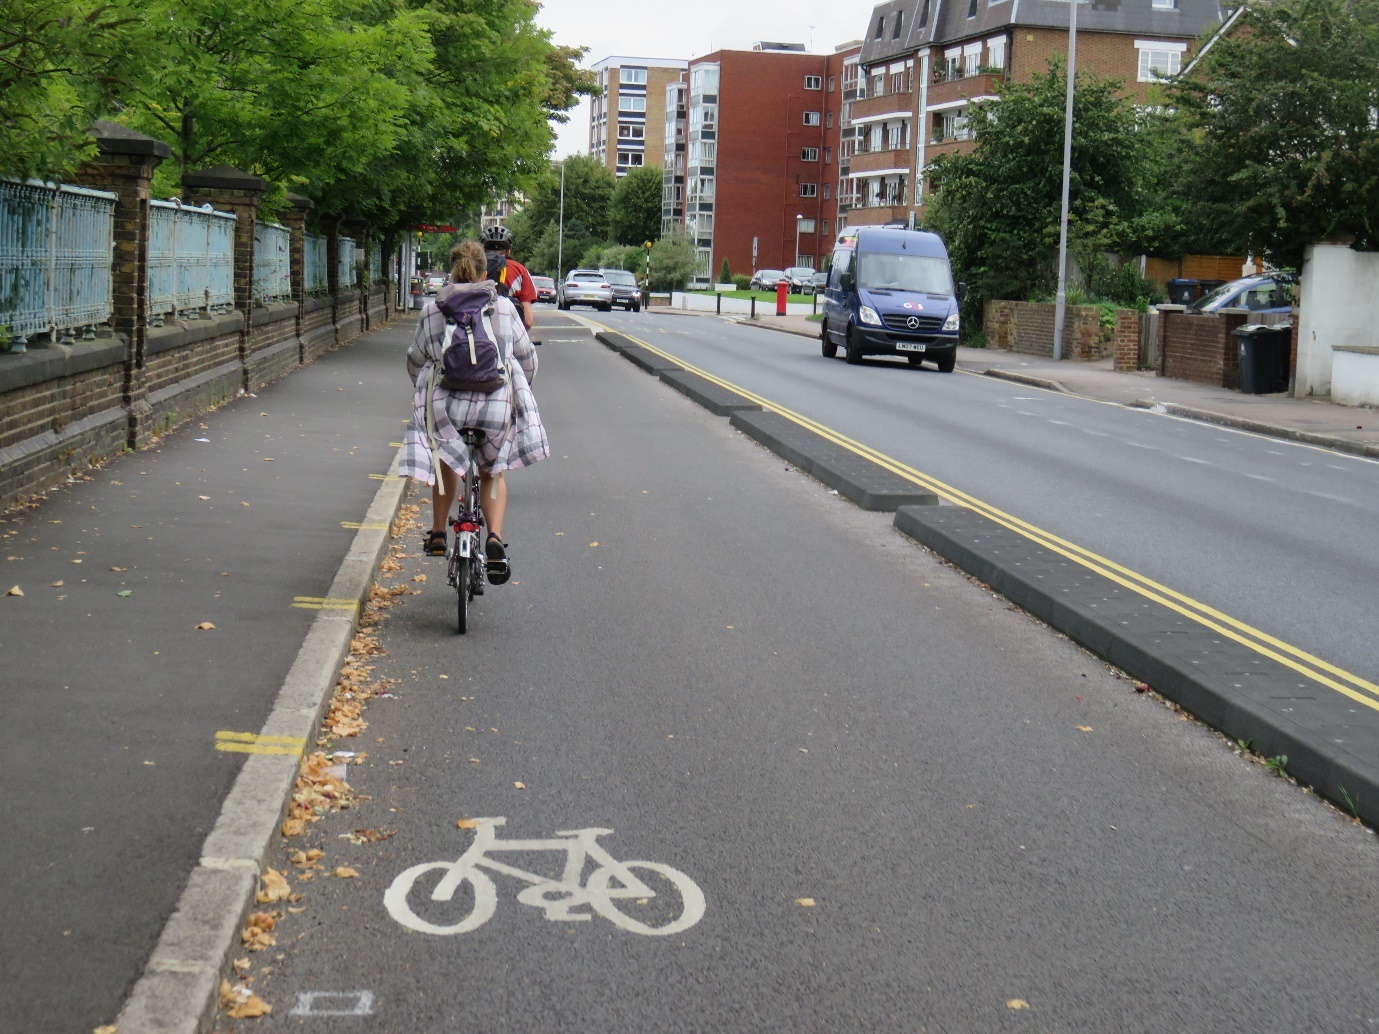
Announced in 2014, the £100 million mini-Holland programme of active travel interventions is funded by Transport for London and continues until 2021.[1] Built environment measures include new cycle tracks, motor traffic calming and reduction, and pedestrian routes. Figure 1 and Figure 2 show two examples.

Figure 1
Figure 1:new cycle track, Kingston (Rachel Aldred)
Figure 2
Figure 2:modal filter, Waltham Forest (Rachel Aldred)

While the focus of the programme was active travel (walking and cycling), here we additionally examine how interventions affected car ownership and use. We also examine the impact of living in a ‘Low Traffic Neighbourhood’ (LTN), i.e. an area-based intervention that removes through motor traffic from the area’s residential streets (e.g. via modal filters restricting through motor traffic, Figure 2). In 2020, LTNs are being implemented across the UK, especially London, through Covid-related emergency active travel funding to support safe walking and cycling and discourage unnecessary car use.

Here we answer the following:

  1. Was change in car ownership and car use associated with living in an LTN?

  2. Was change in walking and cycling associated with living in an LTN?

  3. How did any observed effects compare with non-LTN intervention areas?

Methods and Data

The People and Places study is a longitudinal study that treats the mini-Hollands programme as a ‘natural experiment’. Data here covers baseline (2016) and three follow-up waves (2017-9). Participants (adults resident in Outer London) were recruited via random household cluster sampling and recruitment from two Transport for London customer databases, with response rates of ~1-2%. We constructed survey weights for each wave to allow for differences in sample composition between the survey sources. For more on sampling see Aldred et al (2019). The survey was administered annually using Qualtrics software in early May to mid-June. Participants provided demographic and social-economic information, plus a past-week travel diary with minutes of walking, cycling, and car use. The diary did not collect trip-level data.

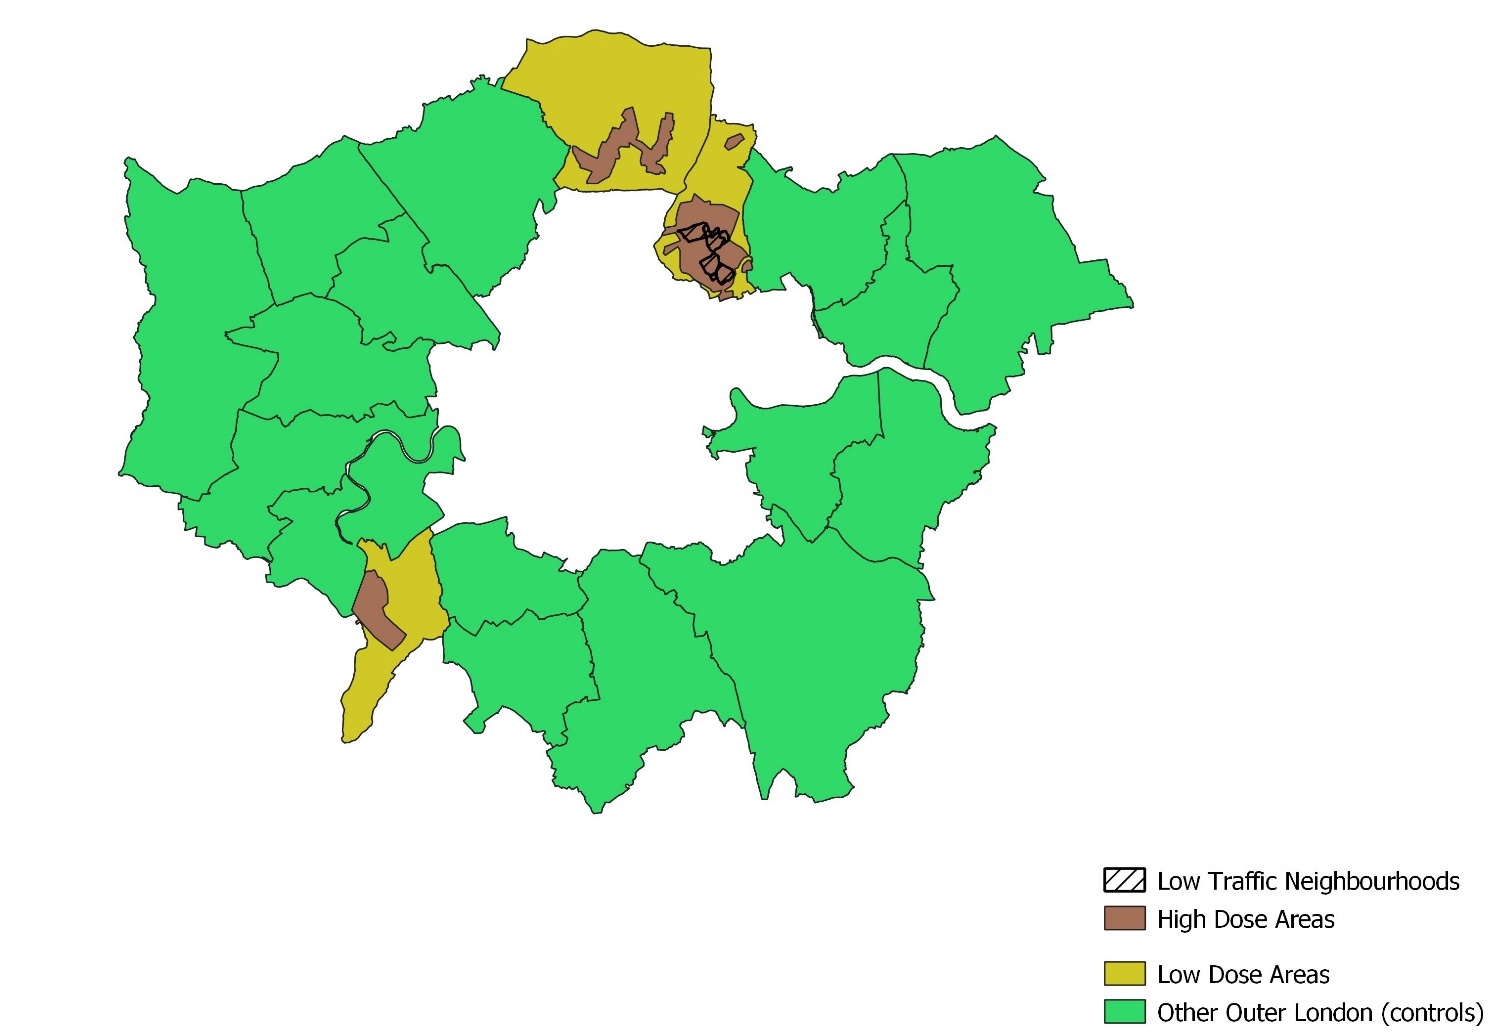
We restricted our analysis to people living in the same area throughout the period 2016-19, thereby avoiding self-selection bias from in-movers (e.g. if the LTN areas attracted non-car owners). Our ‘control’ group consists of residents of the 17 other Outer London boroughs. In previous analyses we have subdivided the intervention boroughs between ‘low dose’ individuals not living near any interventions versus those living in a ‘high-dose’ area where stakeholders identified relevant interventions during the wave in question. In this analysis we additionally subdivided the ‘high dose’ area by identifying the extent of any LTNs within the high-dose areas at each wave. Figure 3 shows (i) the three mini-Holland boroughs, Enfield, Kingston, and Waltham Forest, (ii) ‘high-dose’ areas near active travel interventions, and (iii) LTN areas within these. Only Waltham Forest implemented LTNs during our study, so a small proportion of our sample lived in LTNs, particularly in Wave 1 (Table 1).

Figure 3
Figure 3:intervention and control areas, Wave 3
Table 1:Sample sizes
Sample size for analyses of % with a car or doing any past week travel of a given mode Sample size for analyses of average minutes of past week travel
Wave 1 Non-mini-Holland 962 914
Low dose 460 440
High dose, non-LTN 241 234
High dose, LTN 49 46
Wave 2 Non-mini-Holland 902 811
Low dose 413 366
High dose, non-LTN 232 209
High dose, LTN 63 58
Wave 3 Non-mini-Holland 830 830
Low dose 346 346
High dose, non-LTN 256 256
High dose, LTN 66 66

We used Poisson regression with robust standard errors for binary outcomes (Zou 2004), because many of our binary outcomes are common. We used linear regression for our continuous outcomes. Our primary exposure of interest was type of area (control / low dose / high dose, non-LTN / high dose, LTN). All regression analyses adjust for the corresponding measure at baseline, with baseline measures of past-week travel entered as linear terms, alongside quadratic terms if statistically significant. We also adjust for car ownership at baseline (using the baseline value as car ownership at follow-up may mediate some effects),[2] and for other demographic and socio-economic characteristics as measured at follow-up. For further details on our analysis methods see Aldred et al (2019; forthcoming).

Findings

There is a consistent trend towards people in the LTN area becoming less likely to own a car, with the point estimate growing larger and more statistically significant in each follow-up wave (see Table 2 for adjusted regression analyses). By Wave 3, the rate ratio (RR) of 0.80 corresponds to a 20% decrease in the adjusted probability of car ownership. There was no evidence of change in other intervention groups.

Table 2:Car-related outcomes: Adjusted rate ratios/regression coefficients (95% confidence interval)
% with a household car % with any car use in the past week Minutes of car use in the past week
Wave 1 Non-mini-Holland 1 1 0
Low dose 1.01 (0.99, 1.03) 0.98 (0.93, 1.02) 4.6 (-14.5, 23.6)
High dose, non-LTN 0.98 (0.93, 1.03) 0.93 (0.84, 1.02) -2.7 (-25.8, 20.3)
High dose, LTN 0.92 (0.82, 1.03) 0.91 (0.77, 1.09) -9.9 (-51.2, 31.5)
Wave 2 Non-mini-Holland 1 1 0
Low dose 1.02 (0.99, 1.06) 1.02 (0.97, 1.07) -6.7 (-34.6, 21.3)
High dose, non-LTN 0.98 (0.93, 1.03) 0.96 (0.88, 1.05) -3.1 (-37.2, 30.9)
High dose, LTN 0.89 (0.77, 1.02)† 0.78 (0.63, 0.96)* -43.3 (-74.8, -11.9)**
Wave 3 Non-mini-Holland 1 1 0
Low dose 1.02 (0.98, 1.05) 1.05 (0.99, 1.10) 15.3 (-12.5, 43.1)
High dose, non-LTN 0.96 (0.90, 1.02) 0.93 (0.86, 1.02) -0.3 (-31.3, 30.6)
High dose, LTN 0.80 (0.68, 0.95)* 0.81 (0.64, 1.02)† -17.1 (-56.2, 22.0)

†p<0.10, *p<0.05, **p<0.01, ***p<0.001, for difference from the non-mini-Holland group. Analyses adjust for the baseline measure of the outcome in question and the baseline number of cars in the household, plus gender, age, ethnicity, disability, household type and employment type at follow-up.

Likewise, for any past week car use, the largest decrease was the LTN group, with the effect significant in Wave 2 (RR 0.78, p=0.02) and borderline significant in Wave 3 (RR 0.81, p=0.08). There was a suggestion of a trend towards less past week car use in the high-dose, non-LTN group (RRs 0.93 to 0.96), but the point estimate was always smaller and never close to p<0.05.

As for minutes of past week car use, the point estimate in the LTN group was always negative and lower than other groups. The central point estimates were for a decrease of 10 minutes/week in Wave 1, 43 minutes/week in Wave 2, and 17 minutes/week in Wave 3. The confidence intervals were wide, however, and only in Wave 2 statistically significant (p=0.007). Still, to some extent this counteracts a concern sometimes raised about LTNs that longer car journeys (due to restrictions on through motor traffic) will increase total volumes of car driving and pollution.

In summary, there was a consistent trend towards reduced car use among LTN residents for all three measures, with the effects particularly large in Waves 2 and 3. Confidence intervals were always wide, particularly for minutes of car use, but three of the six results from Waves 2 and 3 reached statistical significance and a further two were borderline significant. Despite small sample sizes, and uncertainty about the magnitude of the change, the overall trend is unlikely to be due to chance.

We also looked at our active travel outcomes for these sub-groups. In 16 of the 18 contrasts (Table 3) the point estimate was largest in the LTN area. Typically, the second largest was the high-dose, non-LTN area. In addition, many results for the LTN area reached statistical significance (4/6 for walking; 3/6 for cycling; 5/6 for active travel combined). The consistent pattern is therefore of the largest active travel benefits in LTN areas. We cannot make definite statements given wide confidence intervals, but the results seem most consistent with some but not all of this LTN increase in active travel in reflecting mode shift away from car use.

Table 3:Active travel outcomes: adjusted rate ratios/regression coefficients (95% confidence interval)
% doing any walking in the past week Minutes of walking in the past week % doing any cycling in the past week Minutes of cycling in the past week % doing any active travel in the past week Minutes of active travel in the past week
Wave 1 Non-mini-Holland 1 0 1 0 1 0
Low dose 1.03 (0.98, 1.08) 10.8 (-12.1, 33.8) 1.11 (0.91, 1.35) 1.6 (-8.3, 11.4) 1.03 (0.98, 1.07) 12.1 (-12.5, 36.7)
High dose, non-LTN 1.00 (0.94, 1.06) 26.4 (-8.0, 60.9) 1.20 (0.95, 1.51) 6.7 (-6.4, 19.8) 1.02 (0.97, 1.07) 33.1 (-3.5, 69.6)†
High dose, LTN 1.14 (1.07, 1.21)*** 76.4 (8.4, 144.4)* 1.46 (1.12, 1.91)** 14.5 (-6.2, 35.3) 1.11 (1.05, 1.18)*** 93.5 (20.4, 166.5)*
Wave 2 Non-mini-Holland 1 0 1 0 1 0
Low dose 1.01 (0.96, 1.06) 12.8 (-12.4, 37.9) 0.99 (0.80, 1.23) -1.5 (-10.9, 8.0) 1.00 (0.96, 1.05) 10.3 (-15.9, 36.4)
High dose, non-LTN 1.03 (0.97, 1.09) 43.8 (8.6, 78.9)* 1.00 (0.76, 1.32) -7.7 (-18.1, 2.8) 1.03 (0.99, 1.08) 37.0 (-0.1, 74.0)†
High dose, LTN 1.02 (0.94, 1.11) 47.9 (-10.0, 105.8) 1.36 (1.00, 1.84)* 16.6 (-10.4, 43.5) 1.01 (0.94, 1.10) 64.8 (1.4, 128.2)*
Wave 3 Non-mini-Holland 1 0 1 0 1 0
Low dose 1.00 (0.95, 1.05) -1.0 (-32.3, 30.2) 1.00 (0.78, 1.29) -1.6 (-11.1, 8.0) 0.99 (0.94, 1.04) -1.6 (-33.9, 30.7)
High dose, non-LTN 1.03 (0.97, 1.08) 10.3 (-24.6, 45.3) 1.28 (1.02, 1.61)* 12.2 (-1.9, 26.2)† 1.03 (0.98, 1.08) 22.1 (-14.8, 59.0)
High dose, LTN 1.11 (1.05, 1.17)*** 115.2 (20.7, 209.8)* 1.68 (1.19, 2.37)** 20.3 (0.2, 40.5)* 1.09 (1.04, 1.15)** 134.2 (38.2, 230.2)**

†p<0.10, *p<0.05, **p<0.01, ***p<0.001, for difference from the non-mini-Holland group. Analyses adjust for the baseline measure of the outcome in question and the baseline number of cars in the household, plus gender, age, ethnicity, disability, household type and employment type at follow-up.

This research contributes to a growing evidence base for built environment interventions to increase active travel (Kärmeniemi et al. 2018; Smith et al. 2017; Stappers et al. 2018; Sun, Oreskovic, and Lin 2014; Yang et al. 2010). Unusually, the research also provides evidence on change in driving, and on Low Traffic Neighbourhoods, an increasingly used but controversial active travel intervention in the UK.


  1. https://tfl.gov.uk/modes/cycling/routes-and-maps/cycle-mini-hollands

  2. This is different to Aldred et al (2019; forthcoming), where we have adjusted for car ownership at follow-up. Hence some numbers presented below differ very slightly for the low-dose mini-Holland group. In other respects, we are using an identical analysis method as Aldred et al (2019; forthcoming).

Submitted: September 01, 2020 AEST

Accepted: September 09, 2020 AEST

References

Aldred, R., A. Goodman, and J. Woodcock. Forthcoming. “Major Investment in Active Travel in Outer London: Impacts on Travel Behaviour, Physical Activity, and Health.” Under peer review.
Aldred, Rachel, Joseph Croft, and Anna Goodman. 2019. “Impacts of an Active Travel Intervention with a Cycling Focus in a Suburban Context: One-Year Findings from an Evaluation of London’s in-Progress Mini-Hollands Programme.” Transportation Research Part A: Policy and Practice 123 (June):147–69. https:/​/​doi.org/​10.1016/​j.tra.2018.05.018.
Google Scholar
Kärmeniemi, Mikko, Tiina Lankila, Tiina Ikäheimo, Heli Koivumaa-Honkanen, and Raija Korpelainen. 2018. “The Built Environment as a Determinant of Physical Activity: A Systematic Review of Longitudinal Studies and Natural Experiments.” Annals of Behavioral Medicine 52 (3): 239–51. https:/​/​doi.org/​10.1093/​abm/​kax043.
Google Scholar
Smith, Melody, Jamie Hosking, Alistair Woodward, Karen Witten, Alexandra MacMillan, Adrian Field, Peter Baas, and Hamish Mackie. 2017. “Systematic Literature Review of Built Environment Effects on Physical Activity and Active Transport - an Update and New Findings on Health Equity.” International Journal of Behavioral Nutrition and Physical Activity 14 (1): 158. https:/​/​doi.org/​10.1186/​s12966-017-0613-9.
Google ScholarPubMed CentralPubMed
Stappers, N.E.H., D.H.H. Van Kann, D. Ettema, N.K. De Vries, and S.P.J. Kremers. 2018. “The Effect of Infrastructural Changes in the Built Environment on Physical Activity, Active Transportation and Sedentary Behavior - A Systematic Review.” Health & Place 53 (September):135–49. https:/​/​doi.org/​10.1016/​j.healthplace.2018.08.002.
Google Scholar
Sun, Guibo, Nicolas M Oreskovic, and Hui Lin. 2014. “How Do Changes to the Built Environment Influence Walking Behaviors? A Longitudinal Study within a University Campus in Hong Kong.” International Journal of Health Geographics 13 (1): 28. https:/​/​doi.org/​10.1186/​1476-072x-13-28.
Google ScholarPubMed CentralPubMed
Yang, L., S. Sahlqvist, A. McMinn, S. J. Griffin, and D. Ogilvie. 2010. “Interventions to Promote Cycling: Systematic Review.” BMJ 341 (oct18 2): c5293–c5293. https:/​/​doi.org/​10.1136/​bmj.c5293.
Google ScholarPubMed CentralPubMed
Zou, G. 2004. “A Modified Poisson Regression Approach to Prospective Studies with Binary Data.” American Journal of Epidemiology 159 (7): 702–6.
Google Scholar

This website uses cookies

We use cookies to enhance your experience and support COUNTER Metrics for transparent reporting of readership statistics. Cookie data is not sold to third parties or used for marketing purposes.

Powered by Scholastica, the modern academic journal management system