
1. Question
The relationship between road transport and economic activity has been long investigated in the literature (indicatively, see Iacono and Levinson 2016). Askitas and Zimmermann (2013) developed a “toll index” in Germany as an indicator having the power to predict near-term economic activity and business cycles based on high-frequency highway traffic data. Following this paradigm, we employ a large dataset to calculate a “toll index” for Greece, representing the traffic intensity of truck vehicles across urban and interurban highway toll stations of the country. Subsequently, we use Autoregressive Distributed Lag (ARDL) and error-correction models (ECM) to address whether there is a significant short-run (SR) and long-run (LR) correlation of road freight traffic with manufacturing activity in Greece.
2. Methods
The ARDL model of Pesaran and Shin (1999) is expressed as:
Yt=c+p∑j=1λj⋅Yt−j+q∑i=0bi⋅Xt−i+ut
where c contains deterministic factors (e.g., a constant term and a trend) and u is the serially uncorrelated error term. This model allows for estimation of SR and LR effects of X (toll index) on Y (economic activity) in one-step efficiently, and for SR causality of Y on X. Employed variables can be either I(0) or I(1), but they must not be second-order integrated I(2). Co-integration is tested with the bounds testing procedure of Pesaran et al. (2001), as extended by Bertsatos et al. (2022; 2023). We use logarithms to estimate the responses of the manufacturing index (MAN) on the toll index (TOLL):
logMANt=c+m⋅t+n⋅t2+p∑j=1λj⋅logMANt−j+q∑i=0bi⋅logTOLLt−i+ut
The time period spans the historically unprecedentedly long and persistent recession of the Greek economy from May 2008 to April 2016, encompassing 96 monthly observations. We allow up to 12 lags and, for lag selection, we use the Schwarz (SIC) or Akaike (AIC) information criteria and drop the first 12 observations.
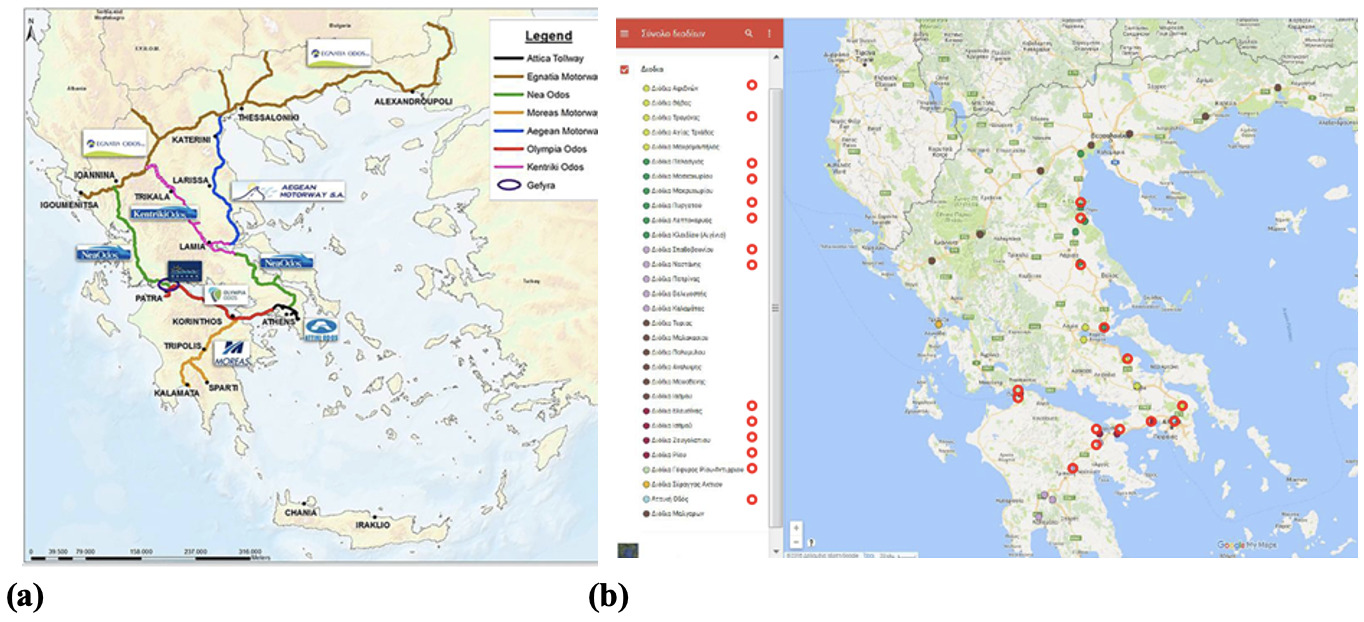
The observations count the number of trucks passing through toll stations at suburban (Attica’s peripheral ‘Attiki Odos’) and interurban highways spanning the main development axis of mainland Greece (the Patras-Athens-Thessaloniki corridor). The toll stations are located across six NUTS-2 regions, covering a wide geographical area of the mainland country (Figure 1). The truck traffic refers to Category 3 for 2-axle and 3-axle goods vehicles and Category 4 for 4-(and more) axle goods vehicles. The number of goods vehicles is summed using weights equal to 40% for Category 3 and 60% for Category 4, based on apportioning the average payload of each category, following the conversion of mixed traffic into passenger car unit/equivalent in transport engineering practice. This process accounts for the disproportionate impact that larger, heavier vehicles have on road capacity and traffic flow, compared to smaller, lighter ones (Frantzeskakis and Giannopoulos 2005; EPA 2016).
_illustration_of_the_highway_network_and_(b)_location_of_the_toll_stations_for_data_col.png)
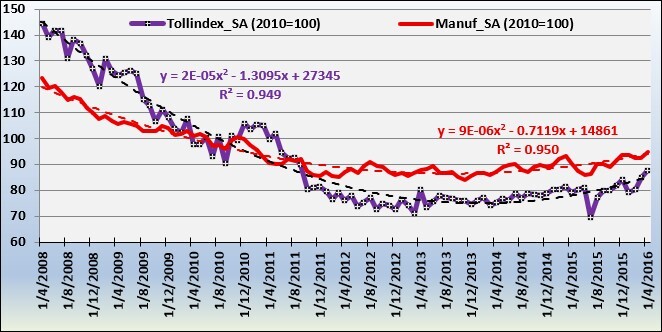
We construct: (i) the Toll index, i.e., a composite index composed of 14 weighted toll indices in Greece, linearly adding and standardizing highway traffic volume (2010=100), and (ii) the Manufacturing index, expressed as the monthly gross value added of manufacturing (2010=100). Each index is seasonally adjusted, controlling for seasonal variations, working days and calendar effects. The indices are highly correlated, have a similar trend and significantly fit a quadratic polynomial function (Figure 2), following an initial period of contraction, the persistent recession and, finally, a slight gradual recovery.
__2008-2016._source__minist.jpeg)
3. Findings
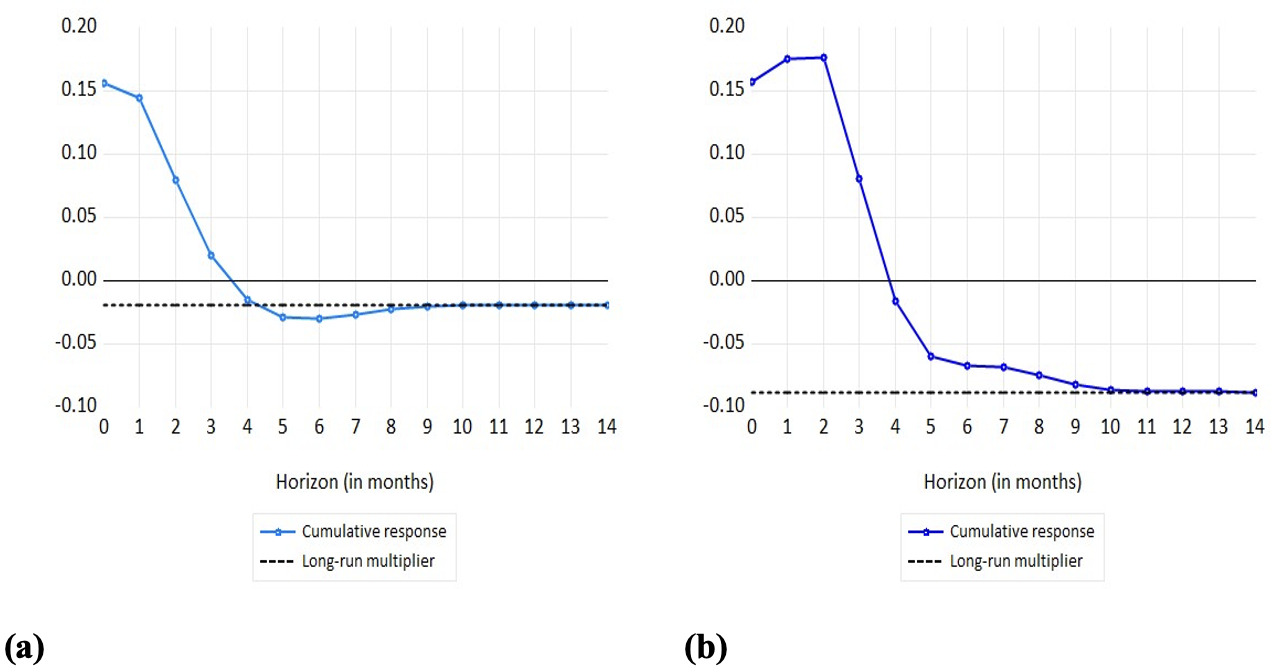
The Augmented Dickey-Fuller (ADF) (1979) tests with intercept (𝑐), linear (𝑐,𝑡) and quadratic trend (𝑐, 𝑡, 𝑡2) are employed for robustness. These tests produce similar outcomes and verify no evidence of I(2) variables using either SIC or AIC. After estimating the ARDL model in levels using the logarithm of manufacturing activity (LOGMAN) as dependent variable (Table 1), we test and find no evidence for serial correlation. Moreover, there is evidence of normally distributed errors according to Jarque-Bera test. Even if the LR effect of TOLL is found to be statistically insignificant, there are significant SR effects of the toll index on manufacturing activity that could be framed as near-term predictive correlations. Specifically, 1% increase in TOLL today suggests an increase of 0.156% in MAN at and an increase of 0.144% at However, for the effect becomes statistically insignificant (Figure 3a).
_sic_and_(b)_aic.png)
Next, we estimate the ARDL model in error-correction form (Table 2). The error-correction term is -0.372 and significant, implying a speed of adjustment equal to 37.2% to any disequilibrium in TOLL within the first month. By employing the bounds testing procedure (Bertsatos et al. 2022; 2023), we test the existence of a co-integrating relationship running from TOLL to MAN. We find that MAN(-1) and TOLL(-1) are jointly significant at 1%, with or without the deterministic trends [Fyx test]. The error-correction term is also significant at 1% [ty test], but TOLL(-1) is insignificant [tx test] Moreover, we find evidence of degenerate co-integration, as the LR multiplier of TOLL on MAN is insignificant at -0.02
Similar results are obtained for the dynamic multiplier effects of LOGTOLL on LOGMAN when using the AIC criterion for the lag structure. An ARDL (3,3) specification is eventually selected. Specifically, a 1% increase in TOLL today could imply a 0.157% increase in MAN at a 0.175% increase at and a 0.176% increase at whilst for the effect becomes statistically insignificant (Figure 3b).
These findings suggest a considerably fast adjustment of manufacturing activity in a two-month period, as 61% of any disequilibrium gap is closed, while it takes approximately 10 months to close 99% of this gap. Hence, the results demonstrate the potential usefulness of the toll index for early nowcasting or near-term forecasting of manufacturing activity. The insignificant LR response could arguably signify the increasingly adopted practices of firms -especially during crisis periods- to rapidly reorganize production strategies and delivery plans to reduce warehousing cost due to the demand shortage. The highway traffic data used here are largely of interregional scale and, hence, cannot be used to test relationships between road freight traffic and economic activity in individual regions (van Ruth 2014). Alternative inland freight transport options do not affect the model utility given that, according to Eurostat (modal split of inland freight transport), in Greece, the modal split for trucks has remained steadily near or above 98%.