
1. QUESTIONS
We sought to identify research priorities to support the potential benefits of shared micromobility in the US.
2. METHODS
We conducted a Delphi study (Jorm 2025) with micromobility experts from government, industry, and advocacy. Delphi studies have been used previously to identify and compare research priorities on transportation-related topics across multiple stakeholder types (Mistry et al. 2025; Prince et al. 2023). Of 110 experts recruited using convenience and snowball sampling through our professional contacts, 64 completed at least one of two online surveys (nsurvey1 = 50; nsurvey2 = 50); 31 completed both. Government stakeholders represented the US Department of Transportation, state and local agencies, and public transit operators. Industry stakeholders represented for-profit micromobility operators, non-profit service operators, consultants, bike registry and mobility data aggregator companies, and micromobility vehicle manufacturers. Advocates included staff at non-profit active transportation organizations and one transportation journalist. Stakeholders were assigned to a sector based on their employer (collected in the first survey or discerned from contact information). Respondents represented at least 12 states, though California was overrepresented, particularly among government stakeholders.
The first survey asked, “In your professional opinion, what is the most important question for research on micromobility services (bikes, e-bikes, or e-scooters that are shared, loaned, or leased)?” We conducted an inductive thematic analysis of responses aimed at articulating an exhaustive and mutually exclusive set of research topics. The lead author coded all responses (parent-child structure), the second author reviewed, and they conferred until consensus was reached. The parent codes and their definitions became the research topic titles and descriptions presented in the second survey for stakeholders to rank (by dragging and dropping the topics into highest-to-lowest priority order), and to further comment on the topics. We computed average rankings and top-five scores (percentage of respondents who ranked each priority in their top five) and tested for differences in average rankings between stakeholder groups.
3. FINDINGS
We articulated 10 research topics based on stakeholders’ first survey responses. Abridged summaries, which include minor elaborations based on stakeholder comments in the second survey, are as follows:
Identify Infrastructure Needs
Identify high-priority locations (e.g., road types) for micromobility street facilities (e.g., bike lanes) and types of facilities required; document facility usage patterns and analyze the value of facility types for micromobility uptake and safety.
Identify and Analyze Financing Models
Explore greater public investment, e.g.: What should government subsidy look like? What is the return-on-investment compared to other transportation subsidies? How do we create viable private-public partnerships with affordable services? What funding models can support multiple types of micromobility services?
Best Practices for Regulation
Develop standards/templates for local ordinances related to operating hours and areas, parking and road use, ADA compliance, speed, user education, licensing and insurance, pricing, and integrating payment with public transit; consider the costs of regulations to providers and implications for service affordability.
Focus on Equity
Analyze service accessibility, service impacts, and user requirements among disadvantaged communities, including travelers with disabilities, equity priority, and lower-density communities; analyze efficacy of equity programs; consider how services can address racialized transportation inequities.
Focus on Safety
Document safety issues (e.g., accident and injury rates, including severity), for riders and pedestrians, and contributing factors and solutions (e.g., presence and type of street facilities, traffic volumes, speed, vehicle design, safety courses).
Estimate Societal Impacts
Evaluate/estimate potential environmental and social impacts of micromobility (e.g., VMT, lifecycle GHG emissions, consumer health and quality of life), including analyzing usage patterns as predictors (e.g., trip purposes, mode shift).
Identify Public Service Models
Identify frameworks for public management or incentivization of micromobility services. How can these services be integrated with public transit? What are the barriers (e.g., institutional management challenges) and solutions?
Multimodality
Research micromobility in the broader context of other alternative modes like microtransit, four-wheeled neighborhood electric vehicles, and privately owned e-bikes and e-scooters; e.g., regarding the respective roles of these alternatives and of different service models versus traditional ownership.
Best Practices for Service Design
Identify service design features (e.g., vehicle type, service model, docked v. dockless, fare structures) that contribute to successful programs in terms of uptake and achieving societal benefits; leverage operators’ data.
Understand and Influence Consumer Adoption
Investigate consumer awareness, needs, preferences, and choices, and factors that influence adoption (e.g., pricing, incentives, and user requirements); including applied research on strategies to promote consumer adoption.
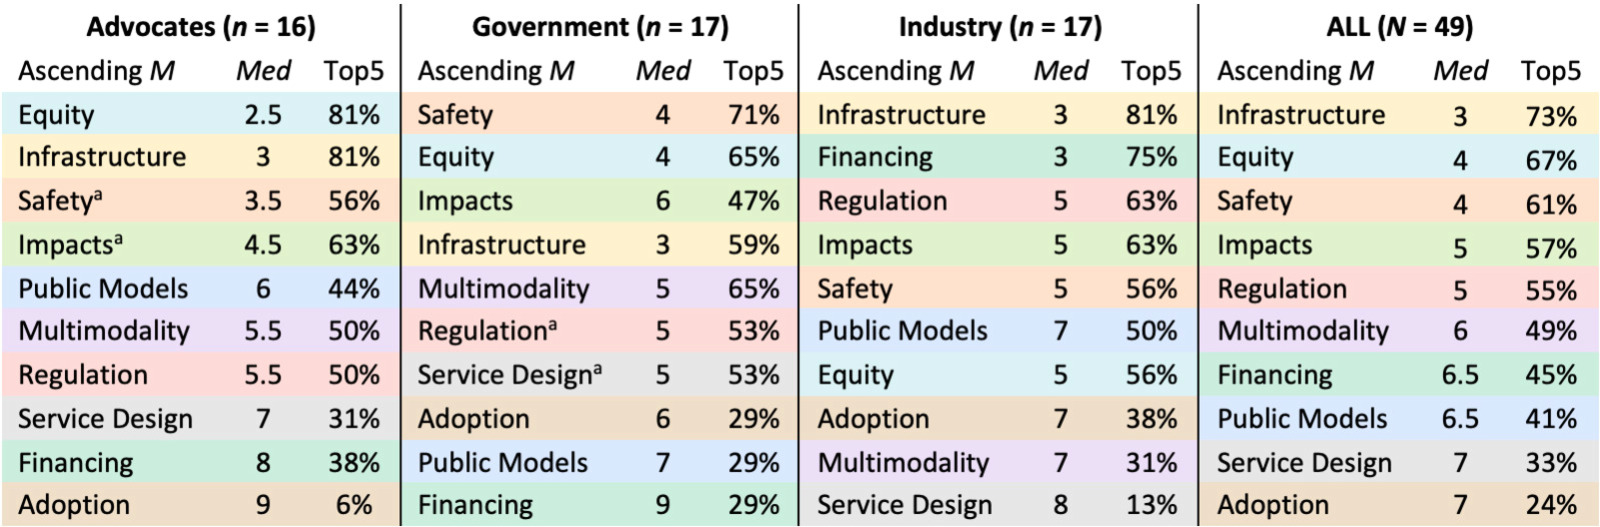
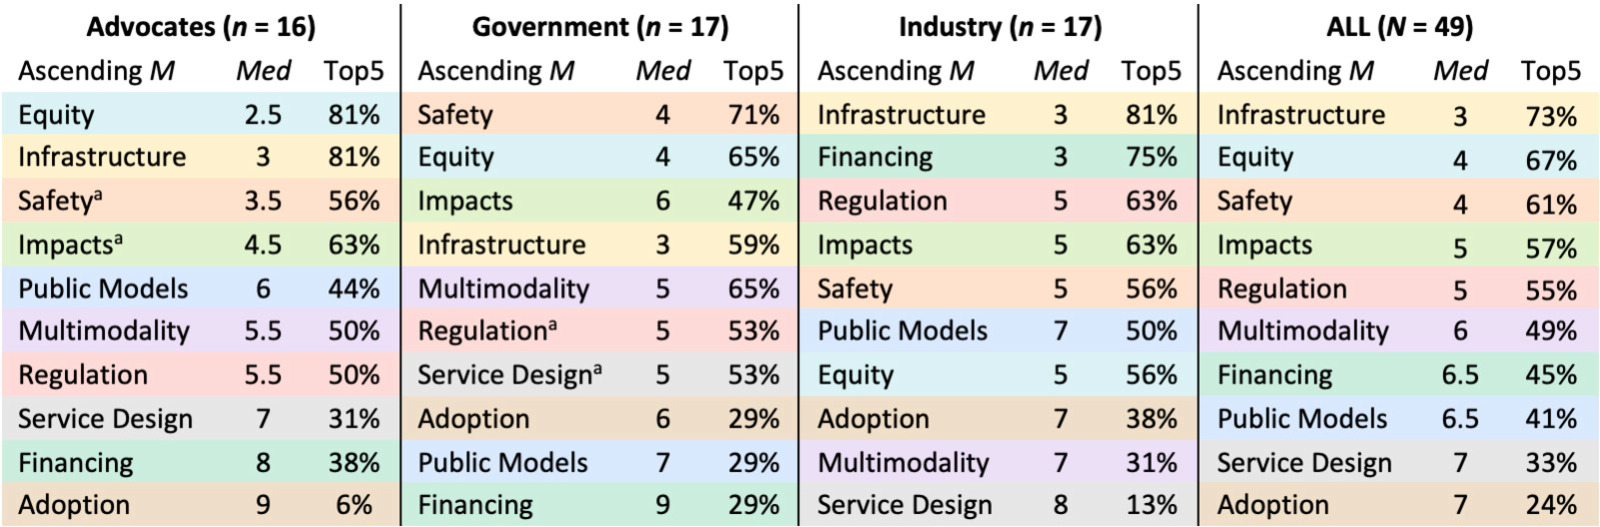
Table 1 presents stakeholders’ research priority rankings in ascending order of mean ranking (i.e., highest-to-lowest priorities), also denoting the median rankings and top-five scores. In terms of top-five scores, consensus was highest for Infrastructure among both the overall group (73%) and the industry group (81%, followed by Financing at 75%). Infrastructure tied with Equity in top-five scores among advocates (81%). Government stakeholders had the highest consensus (71%) on Safety as a top-five priority.
The rankings were not normally distributed, so we used the Kruskal-Wallis test to identify significant differences in median rankings across stakeholder groups. There were significant differences for Financing (χ2 = 8.8, p = .012), Equity (χ2 = 9.3, p = .010), and Adoption (χ2 = 9.6, p = .008). Post-hoc pairwise comparisons using Dunn’s test with a Bonferroni correction showed that industry stakeholders ranked Financing higher priority than did government (z = -2.8, p =.016) and advocates (z = -2.2, p =.074; marginally significant). Advocates ranked Equity higher priority than did industry (z = -3.1, p =.007). Advocates ranked Adoption lower priority than did government (z = 2.9, p =.012) and industry (z = 2.5, p = .041), perhaps because most advocates were focused more broadly on active transportation and had less of an agenda to promote micromobility specifically.
ACKNOWLEDGMENTS
Study funding was provided by the University of California Institute of Transportation Studies from the State of California through the Public Transportation Account and the Road Repair and Accountability Act of 2017 (Senate Bill 1). The contents of this report reflect the views of the authors, who are responsible for the facts and accuracy. The State of California assumes no liability for the contents or use thereof. Nor does the content necessarily reflect the official views or policies of the State of California.