Loading [Contrib]/a11y/accessibility-menu.js
Findings
  • Menu
  • Articles
    • Resilience Findings
    • Transport Findings
    • Urban Findings
    • All
  • For Authors
  • Editorial Board
  • About
  • Blog
  • search

    Sorry, something went wrong. Please try your search again.
    ×

    • Articles
    • Blog posts

RSS Feed

Enter the URL below into your favorite RSS reader.

https://findingspress.org/feed
×
Transport Findings
September 02, 2020 AEST

The Impact of Implementing Public Bicycle Share Programs on Bicycle Crashes

Michael Branion-Calles, Kate Hosford, Meghan Winters, Lise Gauvin, Daniel Fuller,
difference in differences crashes natural experiment bicycling safety bicycle share
Copyright Logoccby-sa-4.0 • https://doi.org/10.32866/001c.16724
Photo by Anthony Fomin on Unsplash
Findings
Branion-Calles, Michael, Kate Hosford, Meghan Winters, Lise Gauvin, and Daniel Fuller. 2020. “The Impact of Implementing Public Bicycle Share Programs on Bicycle Crashes.” Findings, September. https://doi.org/10.32866/001c.16724.
Save article as...▾
  • PDF
  • XML
  • Citation (BibTeX)
Data Sets/Files (4)
Download all (4)
  • Table 1. Weighted characteristics of crashes in which a participant fell of their bike in the past 3 months, pooled.
    Download
  • Table 2. Weighted characteristics of bicyclists within the IBICCS sample, 2012-2014 (n weighted=4,484).
    Download
  • Table 3. Weighted difference in differences logistic regression models
    Download
  • Figure** **1. Predicted probability of a crash for participant defined by median of continuous covariates and mode of categorical covariates but differ in City PBSP Status and Year. PBSPs were implemented in 2013 for “Newly Implemented” cities.
    Download

Sorry, something went wrong. Please try again.

If this problem reoccurs, please contact Scholastica Support

Error message:

undefined
×

View more stats

Abstract

A docked public bicycle share program (PBSP) makes bicycles available to the public. There is limited evidence on the impact of PBSPs on safety. We estimated the impacts of implementing a PBSP on the likelihood of bicycle crashes using a difference in differences approach with repeated cross-sectional survey data (self-reported crashes) collected in 8 Canadian and US cities, from 2012-2014. Relative to control cities (Detroit, Philadelphia, Vancouver), we found that the odds of reporting a bicycling crash did not change after implementing a PBSP (New York, Chicago) and were lower in cities that had existing PBSPs (Boston, Montreal, Toronto).

Research Question

A docked public bicycle share program (PBSP) make bicycles available to the public throughout a service area, and can lead to increased bicycling within a population (Fishman 2016; Hosford et al. 2018, 2019). There is currently limited evidence on the population-level impacts of PBSPs in terms of bicycling crashes and injuries (Fishman, 2016; Fishman & Schepers, 2018; Martin et al., 2016). The International Bikeshare Impacts on Cycling and Collisions Study (IBICCS) collected data from over 20,000 participants in 8 major Canadian and US cities from 2012 – 2014 (Fuller et al., 2014). Here, we use the IBICCS data to estimate the impacts of implementing a PBSP on the likelihood of self-reporting a bicycling crash.

Methods and Data

IBICCS is a quasi-experimental non-equivalent groups study designed to evaluate the health and traffic safety impacts of PBSPs. The study protocol is published elsewhere (Fuller et al. 2014). Residents (aged 18+ years) in cities that either had implemented a new PBSP in 2013 (Chicago, New York), had an existing PBSP (Boston, Montreal, Toronto), or had no PBSP during the study period (Detroit, Philadelphia, Vancouver) were sampled. Cities with existing PBSPs included Boston (implemented 2011), Montreal (implemented 2009), and Toronto (implemented 2011) (Hosford et al. 2019). Cross-sectional data were collected in each city in the fall of 2012, 2013, and 2014. Data collected included information on bicycling behaviour, bicycling crashes, sociodemographic characteristics, and residential location.

We used a difference in differences approach to evaluate the impact of implementing PBSPs on the likelihood of reporting a bicycling incident (Fuller et al. 2013). This analysis focuses on changes in self-reported bicycling crashes over time for bicyclists in cities with a newly implemented PBSP, or an existing PBSP, compared to bicyclists in cities with no PBSP (control cities). We used census data to apply age and sex post-stratification weights to adjust the sample to better represent the general population. Survey weights were truncated at 0.2 and 10 (Hosford et al. 2019).

We used weighted logistic regression models to ascertain whether or not the likelihood of reporting a crash changed over time for bicyclists in a newly implemented or existing PBSP city, relative to those in control cities. To quantify the impact of implementing a PBSP on the likelihood of self-reporting a crash we used a model that includes year (2012 [baseline], 2013, 2014), city type (No PBSP [control], newly implemented PBSP, or existing PBSP) and additional covariates to adjust for characteristics of participants. We use an interaction term between year and city type to quantify the effect of PBSPs on the likelihood of a bicyclist self-reporting a crash within newly implemented or existing PBSP city, relative to those in control cities. We selected additional covariates based on bicyclist characteristic and environmental factors that have previously been identified as risk factors for a bicyclist crash (Branion-Calles et al. 2020; Degraeuwe et al. 2015; Fuller et al. 2013; Poulos et al. 2015; Tin Tin, Woodward, and Ameratunga 2013; Vanparijs et al. 2015). This included a measure of how much participants bicycle (average weekly bicycling hours in the past 30 days), age (18-24, 25-34, 35-44, 45-54, 55-64, 65+ years), sex (woman, man), educational attainment (high school or less, at least some college or university), perceived safety of bicycling (dangerous, neither safe nor unsafe, safe), and helmet use (never, seldom, often, always). We also used Walk Score® of a participants’ neighbourhood as a proxy for favourability of within-city built environment conditions (Walk Score 2020).

Findings

Across cities and survey periods there were 4,484 participants (weighted total) who indicated they bicycled at least once in the previous month and provided complete data. Of these, 934 participants (20.8%) reported at least one crash in the previous 3 months. Amongst the 934 participants who reported a crash, 38.6% indicated that the most recent crash resulted in injury and 18.6% involved a visit to the emergency room (Table 1). The number of participants who reported bicycling in the previous month increased from 1,074 at baseline in 2012 to 1,721 at two-year follow-up in 2014 (Table 2). There was a considerable change in the perception of bicycling safety with the proportion who view bicycling as dangerous in their city decreasing from 29.9% in 2012 to 23.5% in 2014.

Table 1.Weighted characteristics of crashes in which a participant fell of their bike in the past 3 months, pooled.
Weighted n (%)a
Participants that have experienced a crashed in the past 3 months…
For any reason 934.0 (100.0)
Involving a car-door 299.4 (32.1)
Involving a motor vehicle 168.9 (18.1)
Involving another cyclist 195.0 (20.9)
Involving a pedestrian 186.9 (20.0)
Involving a road hazard (tracks, pothole, curb) 428.1 (45.1)
Involving personal distraction 330.1 (35.3)
Involving another reason not listed 185.9 (19.9)
In their most recent collision, participants that …
Were injured 360.7 (38.6)
Visited an emergency room 174.1 (18.6)
Riding a bike share bicycle 179.7 (19.2)

a Categories are not mutually exclusive, participants were able to select multiple reasons for a crash. As such categories will not add up to 100%.

Table 2.Weighted characteristics of bicyclists within the IBICCS sample, 2012-2014 (n weighted=4,484).
Fall 2012 Fall 2013 Fall 2014
(Baseline) (1-year follow-up) (2-year follow-up)
weighted n (%) weighted n (%) weighted n (%)
Total 1073.9 (100.0) 1689.2 (100.0) 1720.8 (100.0)
Crash
No Crash 898.4 (83.7) 1297.5 (76.8) 1354.1 (78.7)
Crash 175.5 (16.3) 391.7 (23.2) 366.7 (21.3)
City PBSP status
No PBSP (control) 385.6 (35.9) 603.3 (35.7) 658.7 (38.3)
Newly implemented PBSP 237.4 (22.1) 446.1 (26.4) 433.0 (25.2)
Existing PBSP 450.9 (42.0) 639.8 (37.9) 629.1 (36.6)
Total weekly bicycling hours, mean (sd) 2.9 (4.7) 4.2 (7.8) 3.9 (7.2)
Walk Score, mean (sd) 83.8 (19.9) 73.0 (26.4) 81.9 (21.6)
Age
18-24 165.7 (15.4) 294.2 (17.4) 314.0 (18.2)
25-34 309.2 (28.8) 454.5 (26.9) 487.3 (28.3)
35-44 218.4 (20.3) 285.2 (16.9) 283.6 (16.5)
45-54 198.5 (18.5) 252.9 (15.0) 262.5 (15.3)
55-64 131.0 (12.2) 309.7 (18.3) 254.9 (14.8)
65+ 51.1 (4.8) 92.7 (5.5) 118.4 (6.9)
Sex
Women 453.9 (42.3) 688.3 (40.7) 717.8 (41.7)
Men 620.0 (57.7) 1001.0 (59.3) 1003.0 (58.3)
Education
High school or less 77.4 (7.2) 208.0 (12.3) 183.5 (10.7)
College or University 996.5 (92.8) 1481.2 (87.7) 1537.3 (89.3)
Helmet use
Never 212.6 (19.8) 310.9 (18.4) 326.6 (19.0)
Seldom 131.5 (12.2) 168.6 (10.0) 175.5 (10.2)
Often 136.5 (12.7) 288.5 (17.1) 259.4 (15.1)
Always 593.4 (55.3) 921.2 (54.5) 959.3 (55.7)
Safety perception of bicycling
Dangerous 320.9 (29.9) 358.4 (21.2) 403.8 (23.5)
Neither safe nor unsafe 147.8 (13.8) 215.3 (12.7) 253.5 (14.7)
Safe 605.2 (56.4) 1115.5 (66.0) 1063.5 (61.8)

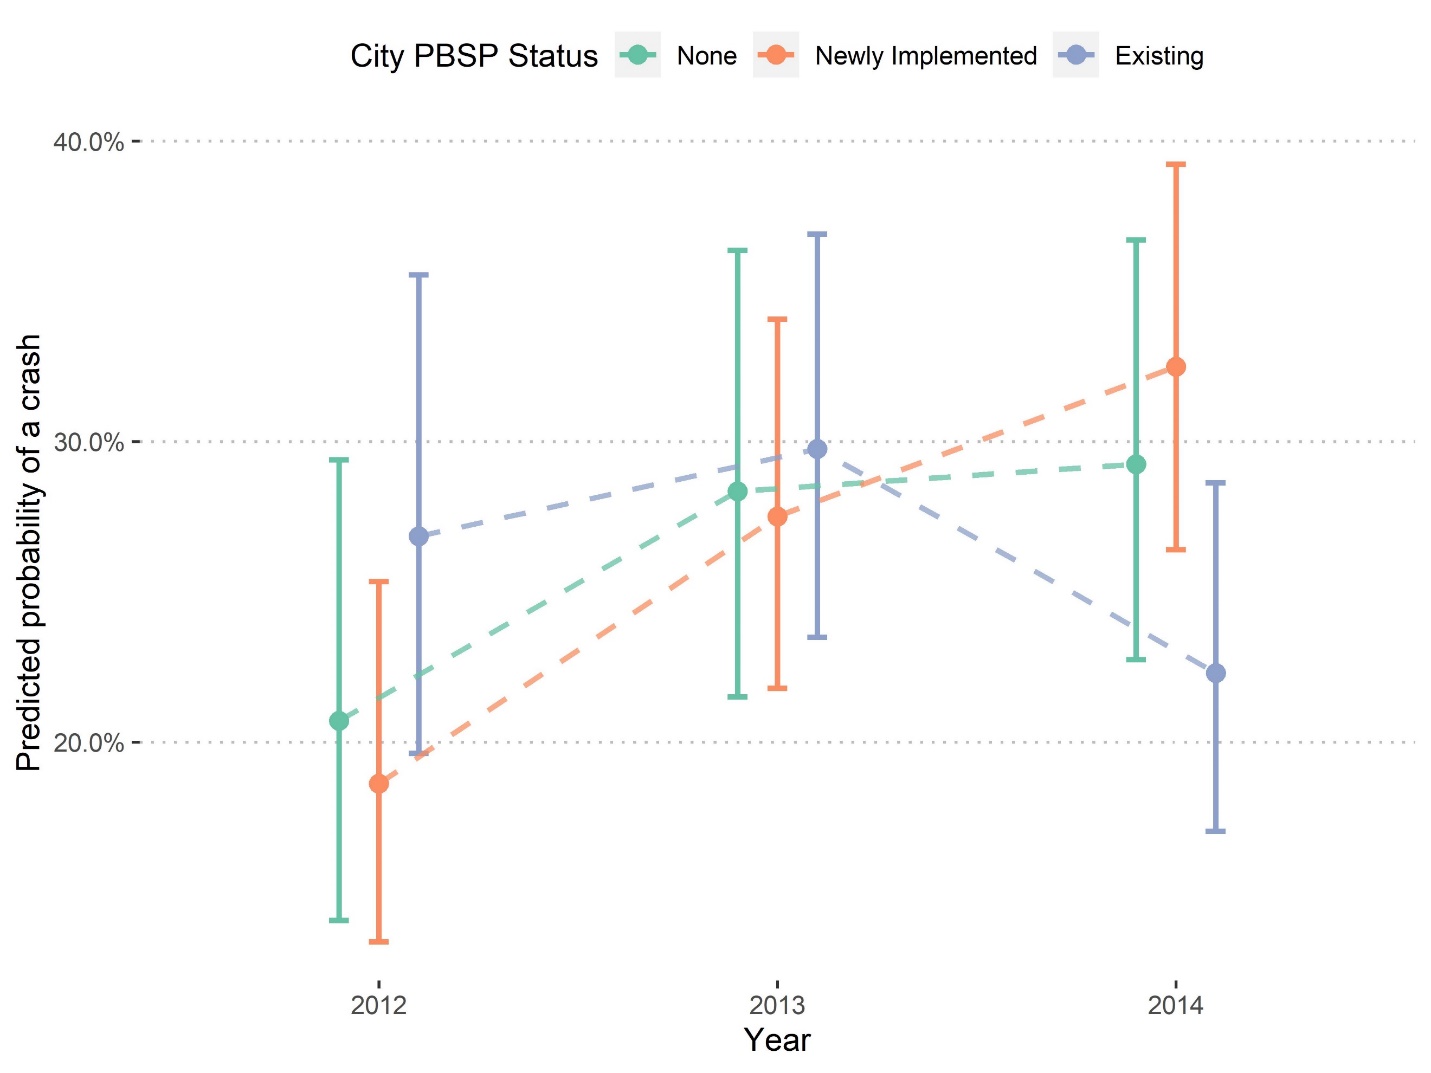
In the logistic regression models, the interaction term (Year \(\times\) City PBSP Status) is the estimated difference in the likelihood of a bicycling crash over time in cities that have a newly implemented or existing PBSP, relative to change over time in cities without a PBSP (Table 3). Relative to the change in likelihood of a crash in cities without a PBSP (and after adjustment for bicycling exposure, sociodemographic characteristics, and Walk Score), there was no statistically significant difference in the odds of reporting a bicycling crash for cities with newly implemented PBSPs after 1-year (Odds Ratio [OR]: 1.09; 95% Confidence Interval [CI]: 0.57, 2.10), and after 2-years (OR: 1.33; 95% CI: 0.71, 2.50). Relative to the change in the likelihood of a crash in cities without a PBSP, for cities with existing PBSPs there was a significant decrease in likelihood of a crash after 2-year follow-up (OR: 0.49; CI: 0.25, 0.98). Figure 1 illustrates the model-based estimates of changes in the predicted probability of a crash from 2012 to 2014 for participants across cities with existing, newly implemented, or no PBSPs.

Table 3.Weighted difference in differences logistic regression models
Simplea Adjustedb
OR (95% CI) t p-value OR (95% CI) t p-value
Year × City PBSP statusc
2013 × Newly Implemented 1.26 (0.68 - 2.32) 0.74 0.46 1.09 (0.57 - 2.10) 0.27 0.79
2013 × Existing 0.95 (0.50 - 1.80) -0.16 0.87 0.76 (0.38 - 1.52) -0.77 0.44
2014 × Newly Implemented 1.62 (0.89 - 2.93) 1.59 0.11 1.33 (0.71 - 2.50) 0.89 0.38
2014 × Existing 0.69 (0.36 - 1.32) -1.13 0.26 0.49 (0.25 - 0.98) -2.01 0.04
Year
2013 1.42 (0.90 – 2.23) 1.50 0.13 1.52 (0.91 - 2.52) 1.60 0.11
2014 1.34 (0.87 – 2.08) 1.33 0.19 1.58 (0.97 - 2.58) 1.84 0.07
City PBSP status
Newly Implemented 0.72 (0.44 - 1.18) -1.32 0.19 0.88 (0.51 – 1.50) -0.48 0.63
Existing 1.12 (0.67 - 1.89) 0.44 0.66 1.41 (0.79 – 2.49) 1.17 0.24

PBSP = Public bike share program; OR = Odds ratio; 95% CI = 95% Confidence interval
a Simple model examines interaction between Year and City PBSP status, adjusting for bicycling exposure
b Adjusted model examines interaction between Year and City PBSP status, adjusting for bicycling exposure, age, gender, educational attainment, helmet use, perceptions of bicycling safety, and Walk Score in residential neighbourhood
c Cities included in the “Newly Implemented” category include Chicago and New York (implemented PBSPs in 2013). Cities included in the “Existing” category are those that had PBSPs implemented prior to 2012 and include Boston, Montreal, and Toronto.

Figure** **1
Figure** **1.Predicted probability of a crash for participant defined by median of continuous covariates and mode of categorical covariates but differ in City PBSP Status and Year. PBSPs were implemented in 2013 for “Newly Implemented” cities.

In this study of population-level bicycling across 8 large cities, we observed that bicycle safety outcomes in cities with a newly implemented PBSP were no different from other cities in terms of safety. PBSPs may be associated with positive impacts on safety over longer time periods, as implied by the decreased odds of a crash in cities that had an existing PBSP at baseline. There are very few studies that evaluate the impact of PBSPs on bicycling safety outcomes. Bicycling crashes are vastly underreported in administrative data (Langley et al. 2003; Winters and Branion-Calles 2017). Although fatalities are consistently recorded, they are, fortunately, very rare (Beck, Dellinger, and O’Neil 2007; Teschke et al. 2013). The IBICCS study provided a large multi-city sample of self-reported bicycling crashes, overcoming data gaps in administrative data, and further, allowed for a quasi-experimental study. Confidence intervals were wide, limiting conclusive evidence on the impacts of implementing PBSPs on bicycling safety.

References

Beck, L. F., A. M. Dellinger, and M. E. O’Neil. 2007. “Motor Vehicle Crash Injury Rates by Mode of Travel, United States: Using Exposure-Based Methods to Quantify Differences.” American Journal of Epidemiology 166 (2): 212–18. https://doi.org/10.1093/aje/kwm064.
Google Scholar
Branion-Calles, Michael, Thomas Götschi, Trisalyn Nelson, Esther Anaya-Boig, Ione Avila-Palencia, Alberto Castro, Tom Cole-Hunter, et al. 2020. “Cyclist Crash Rates and Risk Factors in a Prospective Cohort in Seven European Cities.” Accident Analysis & Prevention 141 (June): 105540. https://doi.org/10.1016/j.aap.2020.105540.
Google Scholar
Degraeuwe, B., Bas de Geus, I. Thomas, G. Vandenbulcke, Romain Meeusen, and Luc Int Panis. 2015. “Cycling Behaviour and Accident Risk of Utilitarian Cyclists in Belgium.” In Cycling Futures. From Research into Practice. Routledge.
Google Scholar
Fishman, Elliot. 2016. “Bikeshare: A Review of Recent Literature.” Transport Reviews 36 (1): 92–113. https://doi.org/10.1080/01441647.2015.1033036.
Google Scholar
Fuller, Daniel, Lise Gauvin, Anne-Sophie Dubé, Meghan Winters, Kay Teschke, Elizabeth T Russo, Andi Camden, Carol Mee, and Steven Marc Friedman. 2014. “Evaluating the Impact of Environmental Interventions across 2 Countries: The International Bikeshare Impacts on Cycling and Collisions Study (IBICCS) Study Protocol.” BMC Public Health 14 (1): 1103. https://doi.org/10.1186/1471-2458-14-1103.
Google ScholarPubMed CentralPubMed
Fuller, Daniel, Lise Gauvin, Patrick Morency, Yan Kestens, and Louis Drouin. 2013. “The Impact of Implementing a Public Bicycle Share Program on the Likelihood of Collisions and near Misses in Montreal, Canada.” Preventive Medicine 57 (6): 920–24. https://doi.org/10.1016/j.ypmed.2013.05.028.
Google Scholar
Hosford, Kate, Daniel Fuller, Scott A. Lear, Kay Teschke, Lise Gauvin, Michael Brauer, and Meghan Winters. 2018. “Evaluation of the Impact of a Public Bicycle Share Program on Population Bicycling in Vancouver, BC.” Preventive Medicine Reports 12 (May): 176–81. https://doi.org/10.1016/j.pmedr.2018.09.014.
Google ScholarPubMed CentralPubMed
Hosford, Kate, Meghan Winters, Lise Gauvin, Andi Camden, Anne-Sophie Dubé, Steven Marc Friedman, and Daniel Fuller. 2019. “Evaluating the Impact of Implementing Public Bicycle Share Programs on Cycling: The International Bikeshare Impacts on Cycling and Collisions Study (IBICCS).” International Journal of Behavioral Nutrition and Physical Activity 16 (1): 107. https://doi.org/10.1186/s12966-019-0871-9.
Google ScholarPubMed CentralPubMed
Langley, J D, N. Dow, S. Stephenson, and K. Kypri. 2003. “Missing Cyclists.” Injury Prevention 9 (4): 376–79. https://doi.org/10.1136/ip.9.4.376.
Google ScholarPubMed CentralPubMed
Poulos, R.G., J. Hatfield, C. Rissel, L.K. Flack, S. Murphy, R. Grzebieta, and A.S. McIntosh. 2015. “An Exposure Based Study of Crash and Injury Rates in a Cohort of Transport and Recreational Cyclists in New South Wales, Australia.” Accident Analysis & Prevention 78 (May): 29–38. https://doi.org/10.1016/j.aap.2015.02.009.
Google Scholar
Teschke, Kay, M. Anne Harris, Conor C. O. Reynolds, Hui Shen, Peter A. Cripton, and Meghan Winters. 2013. “Exposure-Based Traffic Crash Injury Rates by Mode of Travel in British Columbia.” Canadian Journal of Public Health 104 (1): e75–79. https://doi.org/10.1007/bf03405659.
Google ScholarPubMed CentralPubMed
Tin Tin, Sandar, Alistair Woodward, and Shanthi Ameratunga. 2013. “Incidence, Risk, and Protective Factors of Bicycle Crashes: Findings from a Prospective Cohort Study in New Zealand.” Preventive Medicine 57 (3): 152–61. https://doi.org/10.1016/j.ypmed.2013.05.001.
Google Scholar
Vanparijs, Jef, Luc Int Panis, Romain Meeusen, and Bas de Geus. 2015. “Exposure Measurement in Bicycle Safety Analysis: A Review of the Literature.” Accident Analysis & Prevention 84 (November): 9–19. https://doi.org/10.1016/j.aap.2015.08.007.
Google Scholar
Walk Score. 2020. “Walk Score.” https://www.walkscore.com/methodology.shtml.
Winters, Meghan, and Michael Branion-Calles. 2017. “Cycling Safety: Quantifying the under Reporting of Cycling Incidents in Vancouver, British Columbia.” Journal of Transport & Health 7 (Part A): 48–53. https://doi.org/10.1016/j.jth.2017.02.010.
Google Scholar

Powered by Scholastica, the modern academic journal management system