
1. QUESTIONS
Activity-based travel models represent daily schedules through participation, duration, timing, and travel (T. A. Arentze and Timmermans 2004; Bowman and Ben-Akiva 2001), calibrated at one date. Forecasting travel demand in an aging society therefore rests on scenarios that assume how older adults’ activity durations and timing will change (T. Arentze et al. 2008). Measured change over twenty years gives such scenarios an empirical reference. Long travel-survey series identify participation changes across cohorts (Susilo et al. 2019); repeated time-use diaries add the duration of every activity, including those at home, and its within-day distribution. Korea provides a leading case: its 65+ population share rose from 8.7% in 2004 to 19.2% in 2024 — among the most compressed aging transitions in the OECD — with a time-use survey at five-year intervals. We ask:
-
How did older adults’ daily activity durations and time-of-day distributions change in this fast-aging society, and how much of the change is behavioral rather than compositional?
-
Did timing change track duration change, and how did weekday and Sunday patterns differ?
2. METHODS
The data originate from the five survey years (2004–2024) of the Korean Time Use Survey, Statistics Korea’s nationally representative repeated cross-sectional diary survey. Each survey draws a stratified two-stage cluster sample of households (12,435 in 2019) from census enumeration areas; household members aged 10 and over complete diaries on two designated consecutive days. Each diary records one primary activity in 144 ten-minute slots, an instrument unchanged across the five surveys. The analytic sample comprises 3,240–7,886 weekday and 1,042–2,678 Sunday diaries of adults 65+ per survey year; weights apply throughout. Saturday results are in the Supplemental Information (SI): the five-day workweek, phased in from 2004, turned Saturday from partial workday to rest day, so Saturday changes mix institutional and behavioral shifts.
Raw activity codes were harmonized into 18 activities observed in every survey year and grouped into non-discretionary, maintenance, discretionary, and travel categories (adapted from Ås 1978); classification revisions are reconciled through this crosswalk (SI). School and out-of-school study average no more than 2.6 minutes and are omitted, leaving 16 activities; participation activities, redrawn and broadened by the 2019 revision, and survey-response residuals are excluded as non-comparable (SI). For each activity, survey year, and day type, we calculate weighted daily minutes (duration) and slot participation rates, the weighted share of the 65+ sample engaged. Timing change is measured with the Index of Dissimilarity (Duncan and Duncan 1955):
D=12144∑s=1|p2024(s)−p2004(s)|,
where each activity’s slot rates are normalized to sum to one. D is the share of an activity’s normalized daily distribution that would have to shift to other times of day for the 2004 and 2024 profiles to coincide (0 = identical, 1 = disjoint), holding total minutes constant. Direction is summarized by the participation-weighted timing center; the sleep center is descriptive as sleep crosses midnight. Figures 1, S2, and S3 alone use circular Gaussian smoothing (30-minute sigma). Minute changes are tested with weighted z-tests and D with year-label permutation tests (999 draws), Benjamini–Hochberg adjusted (Benjamini and Hochberg 1995); identifiers are not retained, so a conservative variant treats each respondent’s two diaries as one observation (SI). To separate behavior from composition, 2024 diaries are reweighted to the 2004 age–sex composition. Spearman’s correlation compares absolute minute and center changes across 12 non-sparse activities.
Microdata: Statistics Korea’s Microdata Integrated Service (https://mdis.kostat.go.kr). The crosswalk and derived results are in the SI. Anthropic Claude and OpenAI Codex assisted with drafting, code, and consistency checks; the authors independently verified all analytical decisions, code, and interpretations.
3. FINDINGS
_and_sundays_(right)__2004_(.png)
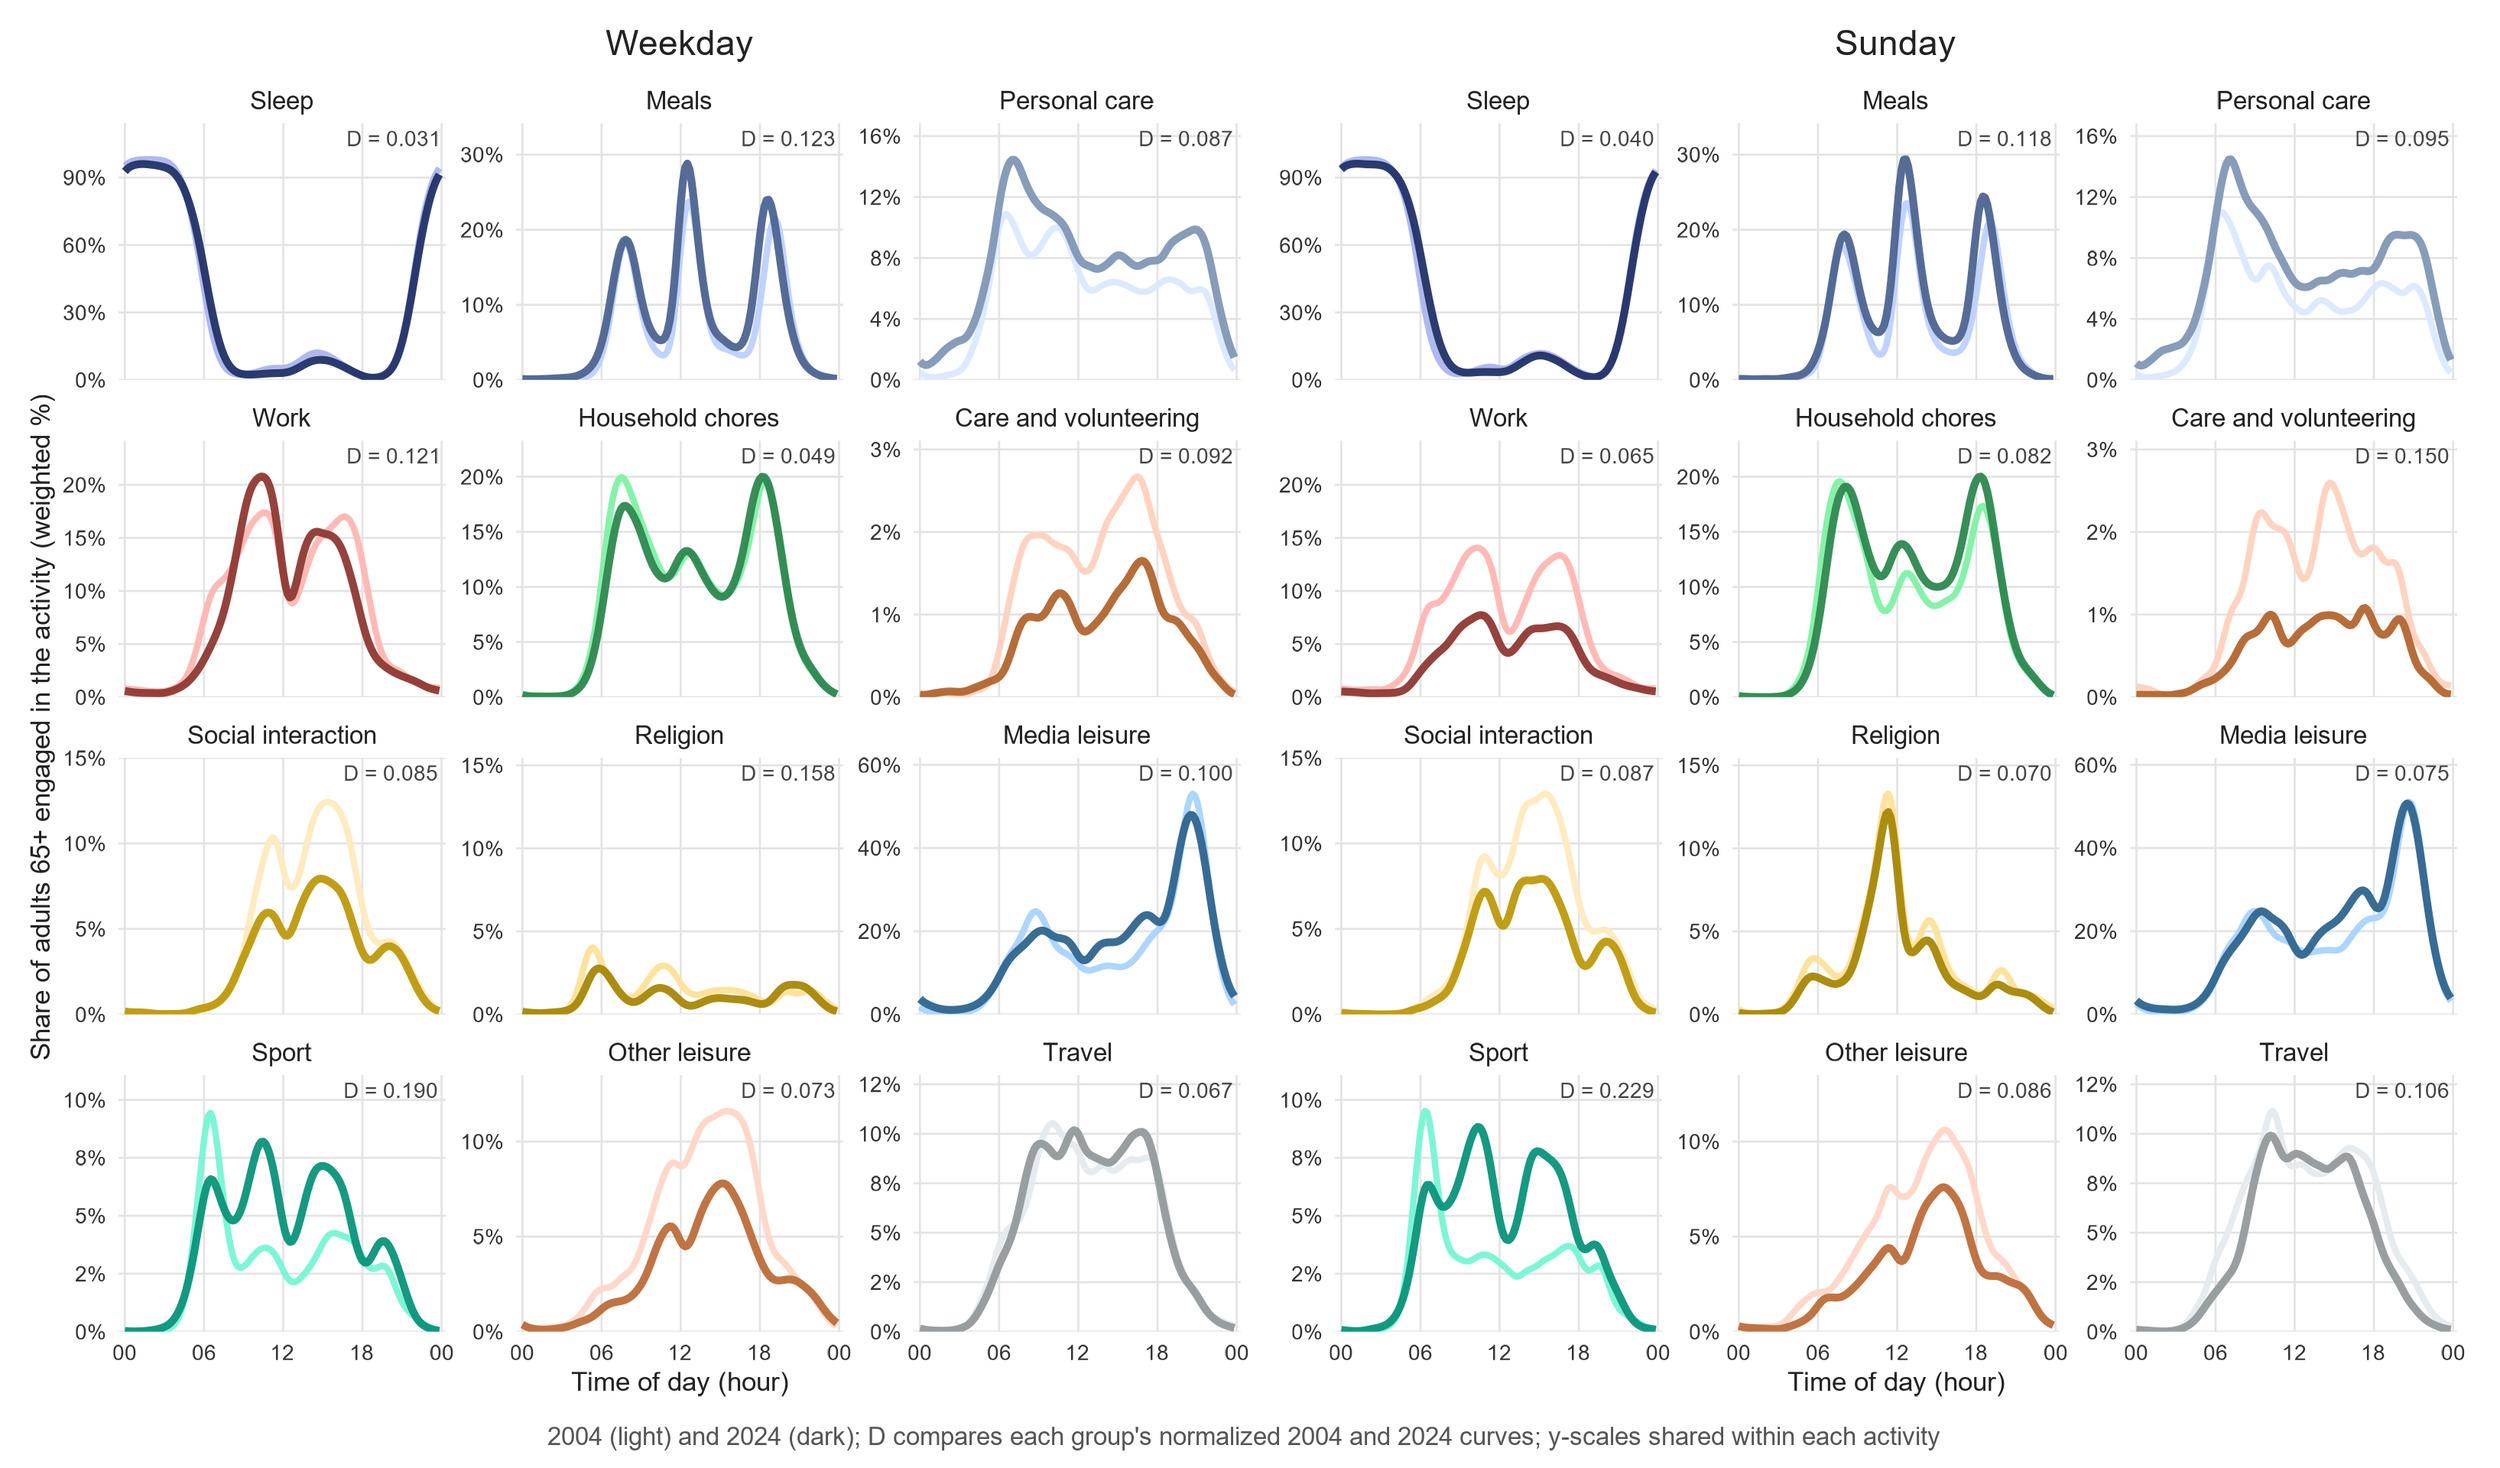
Figure 1 shows the 2004 and 2024 participation curves of 12 activity groups on weekdays and Sundays, covering 98.0–99.0% of time (all five years: Figures S2–S3, SI); Table 1 reports all 16 activities.
In duration, personal care, media leisure, meals, and sport gained the most weekday minutes, while other leisure and social interaction declined; all p < 0.001 under the conservative test. Sunday duration changes were parallel and mostly larger (Table 1). Weekday work fell from 116.6 minutes (2004) to 92.9 (2014), then rose to 107.9 (2024), so its 2004–2024 difference is not significant; Sunday work fell 42.9 minutes and weekly average work 19.5.
Travel was different: weekday travel time barely moved (71.5 minutes in 2004, 72.8 in 2024), Saturday and weekly averages were equally flat (SI), and only Sunday travel fell (−11.5).
The 65+ population itself aged: the weighted share 75+ rose from 30% to 41%. Under the 2004 age–sex composition, the personal care (+27.2), sport (+14.0), and social interaction (−20.8) changes persist — mainly behavioral — while roughly half of the media-leisure increase and most of the weekday work decline reflect composition (SI).
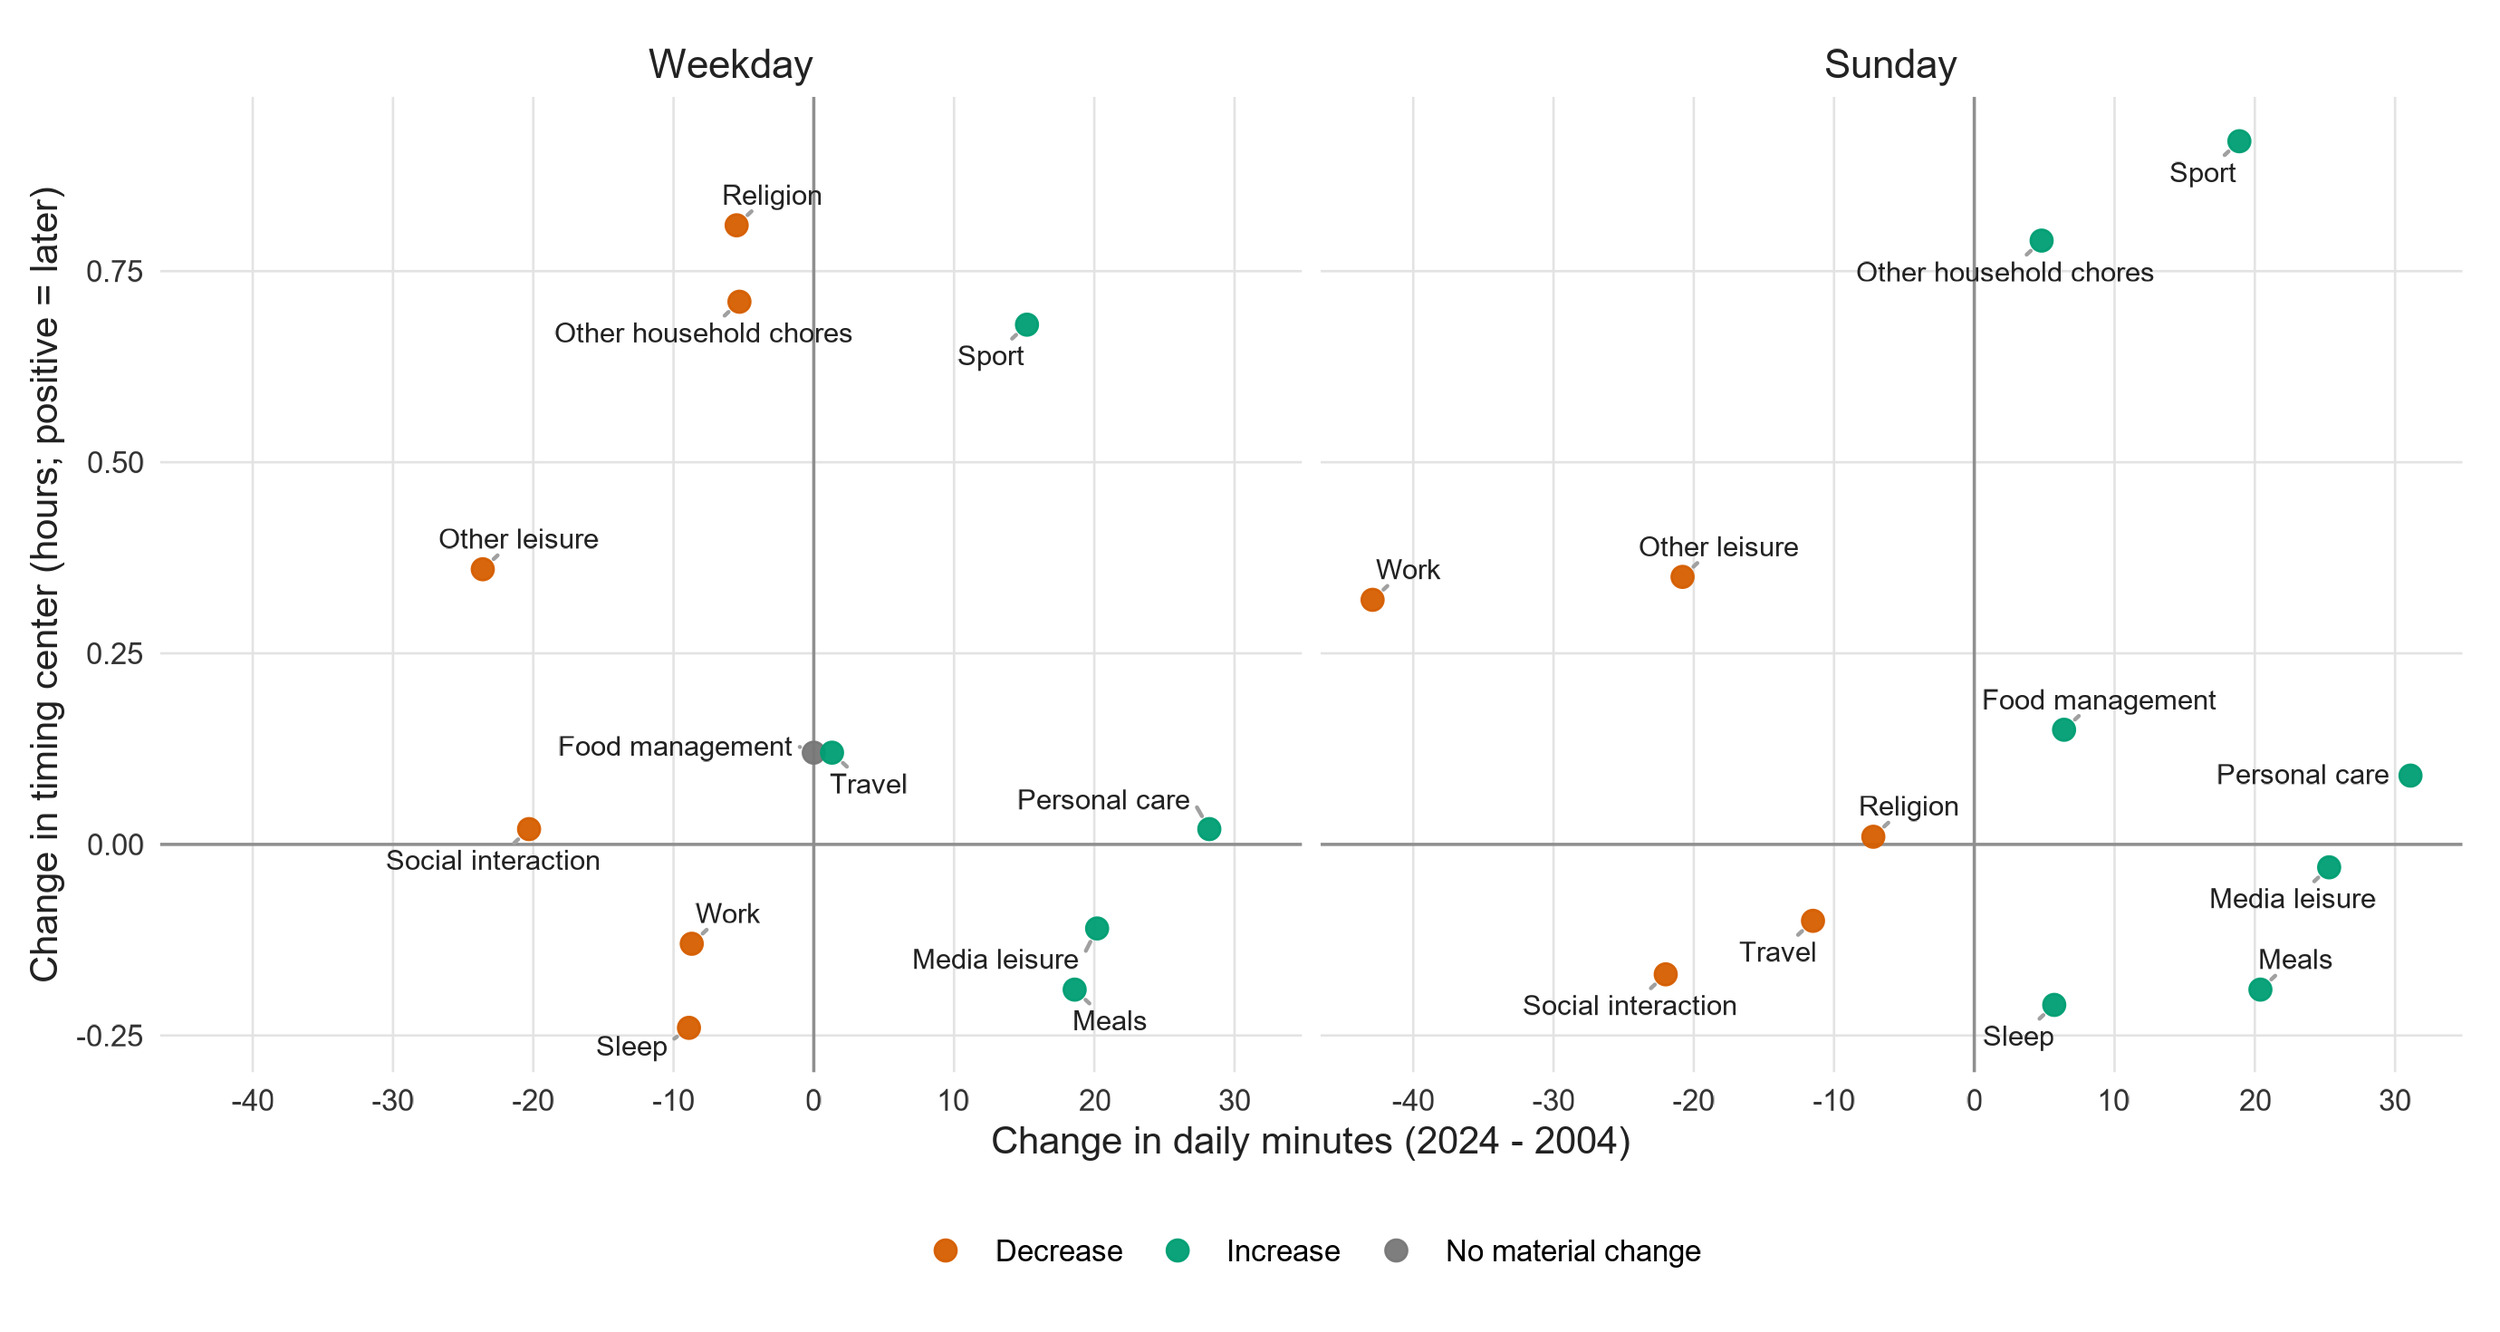
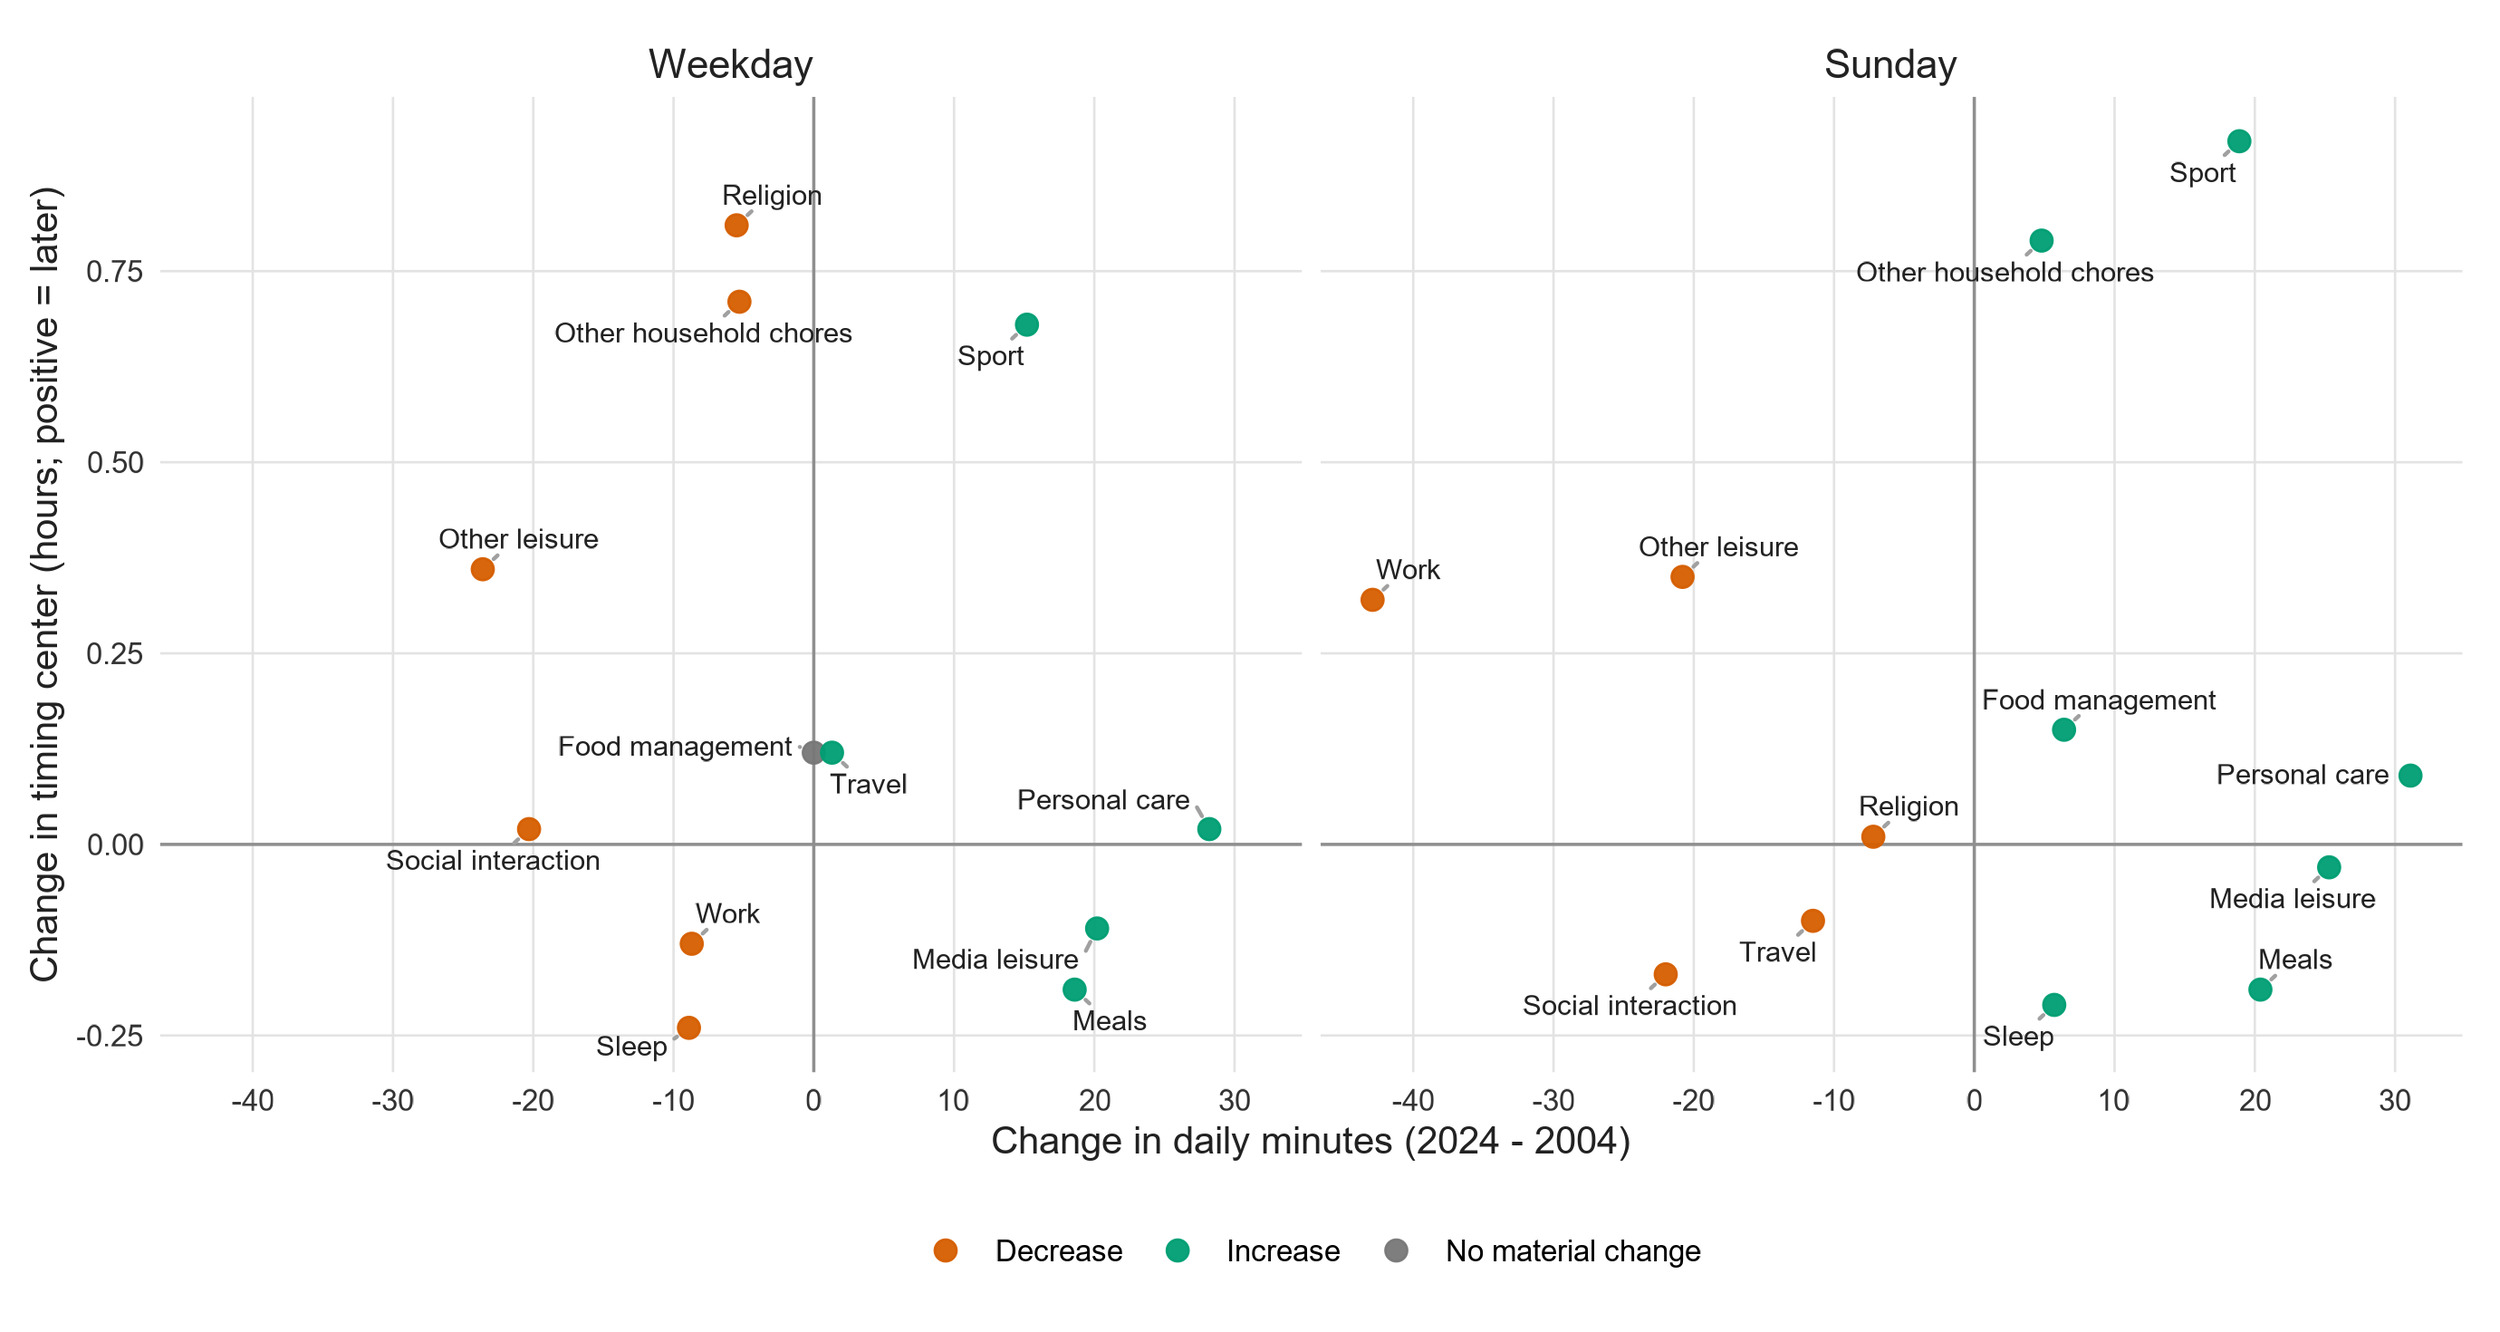
Figure 2 locates each activity on the two dimensions; distinct profiles emerge. Sport changed on both (+15.2 minutes, center +0.68 hours), personal care and social interaction changed in duration only (+28.2, −20.3 minutes; centers ±0.02 hours), religion and other household chores moved later with little duration change (+0.81, +0.71 hours), and sleep and travel changed little on either. Duration change did not significantly predict center change on either day type (Spearman ρ = −0.35 weekday, −0.17 Sunday; p ≥ 0.26). Weekday D is significant under permutation for 13 of 16 activities; all exceptions are sparse (descriptive).
Most of the Sunday work decline persists under the 2004 composition (SI). Timing diverged more on Sundays for sport, other household chores, and food management, with Sunday D above weekday D and significant under permutation (Table 1, SI); sport shifted later further on Sundays (+0.92 hours), and religion re-timed only on weekdays (D = 0.158 versus 0.070), its worship peak holding (Figure 1).
These results provide calibration and validation targets for the duration and time-of-day components of activity-based models. For scenario studies of elderly travel demand, they offer an empirical reference for duration-side and timing-side assumptions. Less social interaction, more self-care time, and a Sunday-only travel decline connect directly to senior-mobility and social-isolation policy in an aging society — and none registers in a single-date calibration. Repeated time-use surveys make the same two targets observable in other aging societies.
Conflict of Interest
The authors declare no conflict of interest.