Loading [Contrib]/a11y/accessibility-menu.js
Skip to main content
null
Findings
  • Menu
  • Articles
    • Energy Findings
    • Resilience Findings
    • Safety Findings
    • Transport Findings
    • Urban Findings
    • All
  • For Authors
  • Editorial Board
  • About
  • Blog
  • covid-19
  • search

RSS Feed

Enter the URL below into your favorite RSS reader.

https://findingspress.org/feed
Transport Findings
September 10, 2020 AEST

Comparing Spatial Associations of Commuting versus Recreational Ridership Captured by the Strava Fitness App

Jaimy Fischer, Trisalyn Nelson, Meghan Winters,
urban planningstravamobilitybig databicyclingbias correctionactive transportation
Copyright Logoccby-sa-4.0 • https://doi.org/10.32866/001c.16710
Photo by Tiplada Mekvisan on Unsplash
Findings
Fischer, Jaimy, Trisalyn Nelson, and Meghan Winters. 2020. “Comparing Spatial Associations of Commuting versus Recreational Ridership Captured by the Strava Fitness App.” Findings, September. https:/​/​doi.org/​10.32866/​001c.16710.
Save article as...▾
Download all (2)
  • Figure 1. Strava commute BKT compared to the pooled sample (quintiles) in DAs (n = 534).
    Download
  • Figure 2. Strava recreational BKT compared to the pooled sample (quintiles) in DAs (n = 534).
    Download

Sorry, something went wrong. Please try again.

If this problem reoccurs, please contact Scholastica Support

Error message:

undefined

View more stats

Abstract

Strava Metro data are used in bicycle planning, but there are concerns it overrepresents fitness activity. The data include a commute label, but spatial patterns of commuting versus recreational ridership are underexplored. Using spatial regression, we compare associations of Strava ridership by trip type. Commuting was associated with areas with more on-street infrastructure, universities, and higher bicycle crash density. Recreational ridership was higher in areas with older populations, more hills and major roads, and lower intersection density. Both trip purposes tended to be in areas with regional trails, off-street infrastructure, higher bicycle mode share, bridges, and proximity to the ocean.

Research Question and Hypothesis

Strava Metro data are being used in bicycling research but are critiqued for bias—both in demographic and trip type—related to who and how the app is used. How well Strava ridership reflects overall bicycle ridership depends on locational factors, for example, how busy a street is, if bicycling infrastructure exists, and safety (Livingston et al. 2020; Nelson et al. 2020). Bias can be addressed by using models that link Strava ridership to counts of all bicyclists, and adjusting for geographic covariates (Jestico, Nelson, and Winters 2016; Roy et al. 2019). Strava data also include a commute label, which may better align with overall ridership. However, there is limited understanding of how Strava trips labelled as commute versus recreation differ in terms of representativeness. Our goal is to understand how the commute label impacts data representativeness by comparing geographic covariates associated with Strava commute and recreational ridership. We hypothesize that commute and recreational ridership samples will be associated with different areas of a city and anticipate that, compared to recreational ridership, Strava data labelled as commute trips better represent overall ridership.

Methods and Data

Study area

The study area is the census metropolitan area (CMA) of Victoria, British Columbia, Canada, with a population of ~367,770 (Statistics Canada 2016) and a bicycle mode share of 6.6%, the highest among Canada’s CMAs (Statistics Canada 2017). Victoria has over 200 km of bicycling infrastructure including ~100 km of regional trails. These paths are the backbone of the bicycling network and are heavily used for both commuting and recreation.

Data and Analysis

We used spatial regression to identify associations between sociodemographic, network, and built and natural environment characteristics for each trip type, and for the pooled sample. The Strava Metro data are from January 1, 2016 - September 30, 2017, and include a spatial file representing the street network and tabular data with aggregate activity counts for each segment. An attribute provided by Strava Metro identifies the count of activities on each segment that were commute trips. We also had area-level summary statistics on the number of unique app users, age-gender distribution, and trip characteristics.

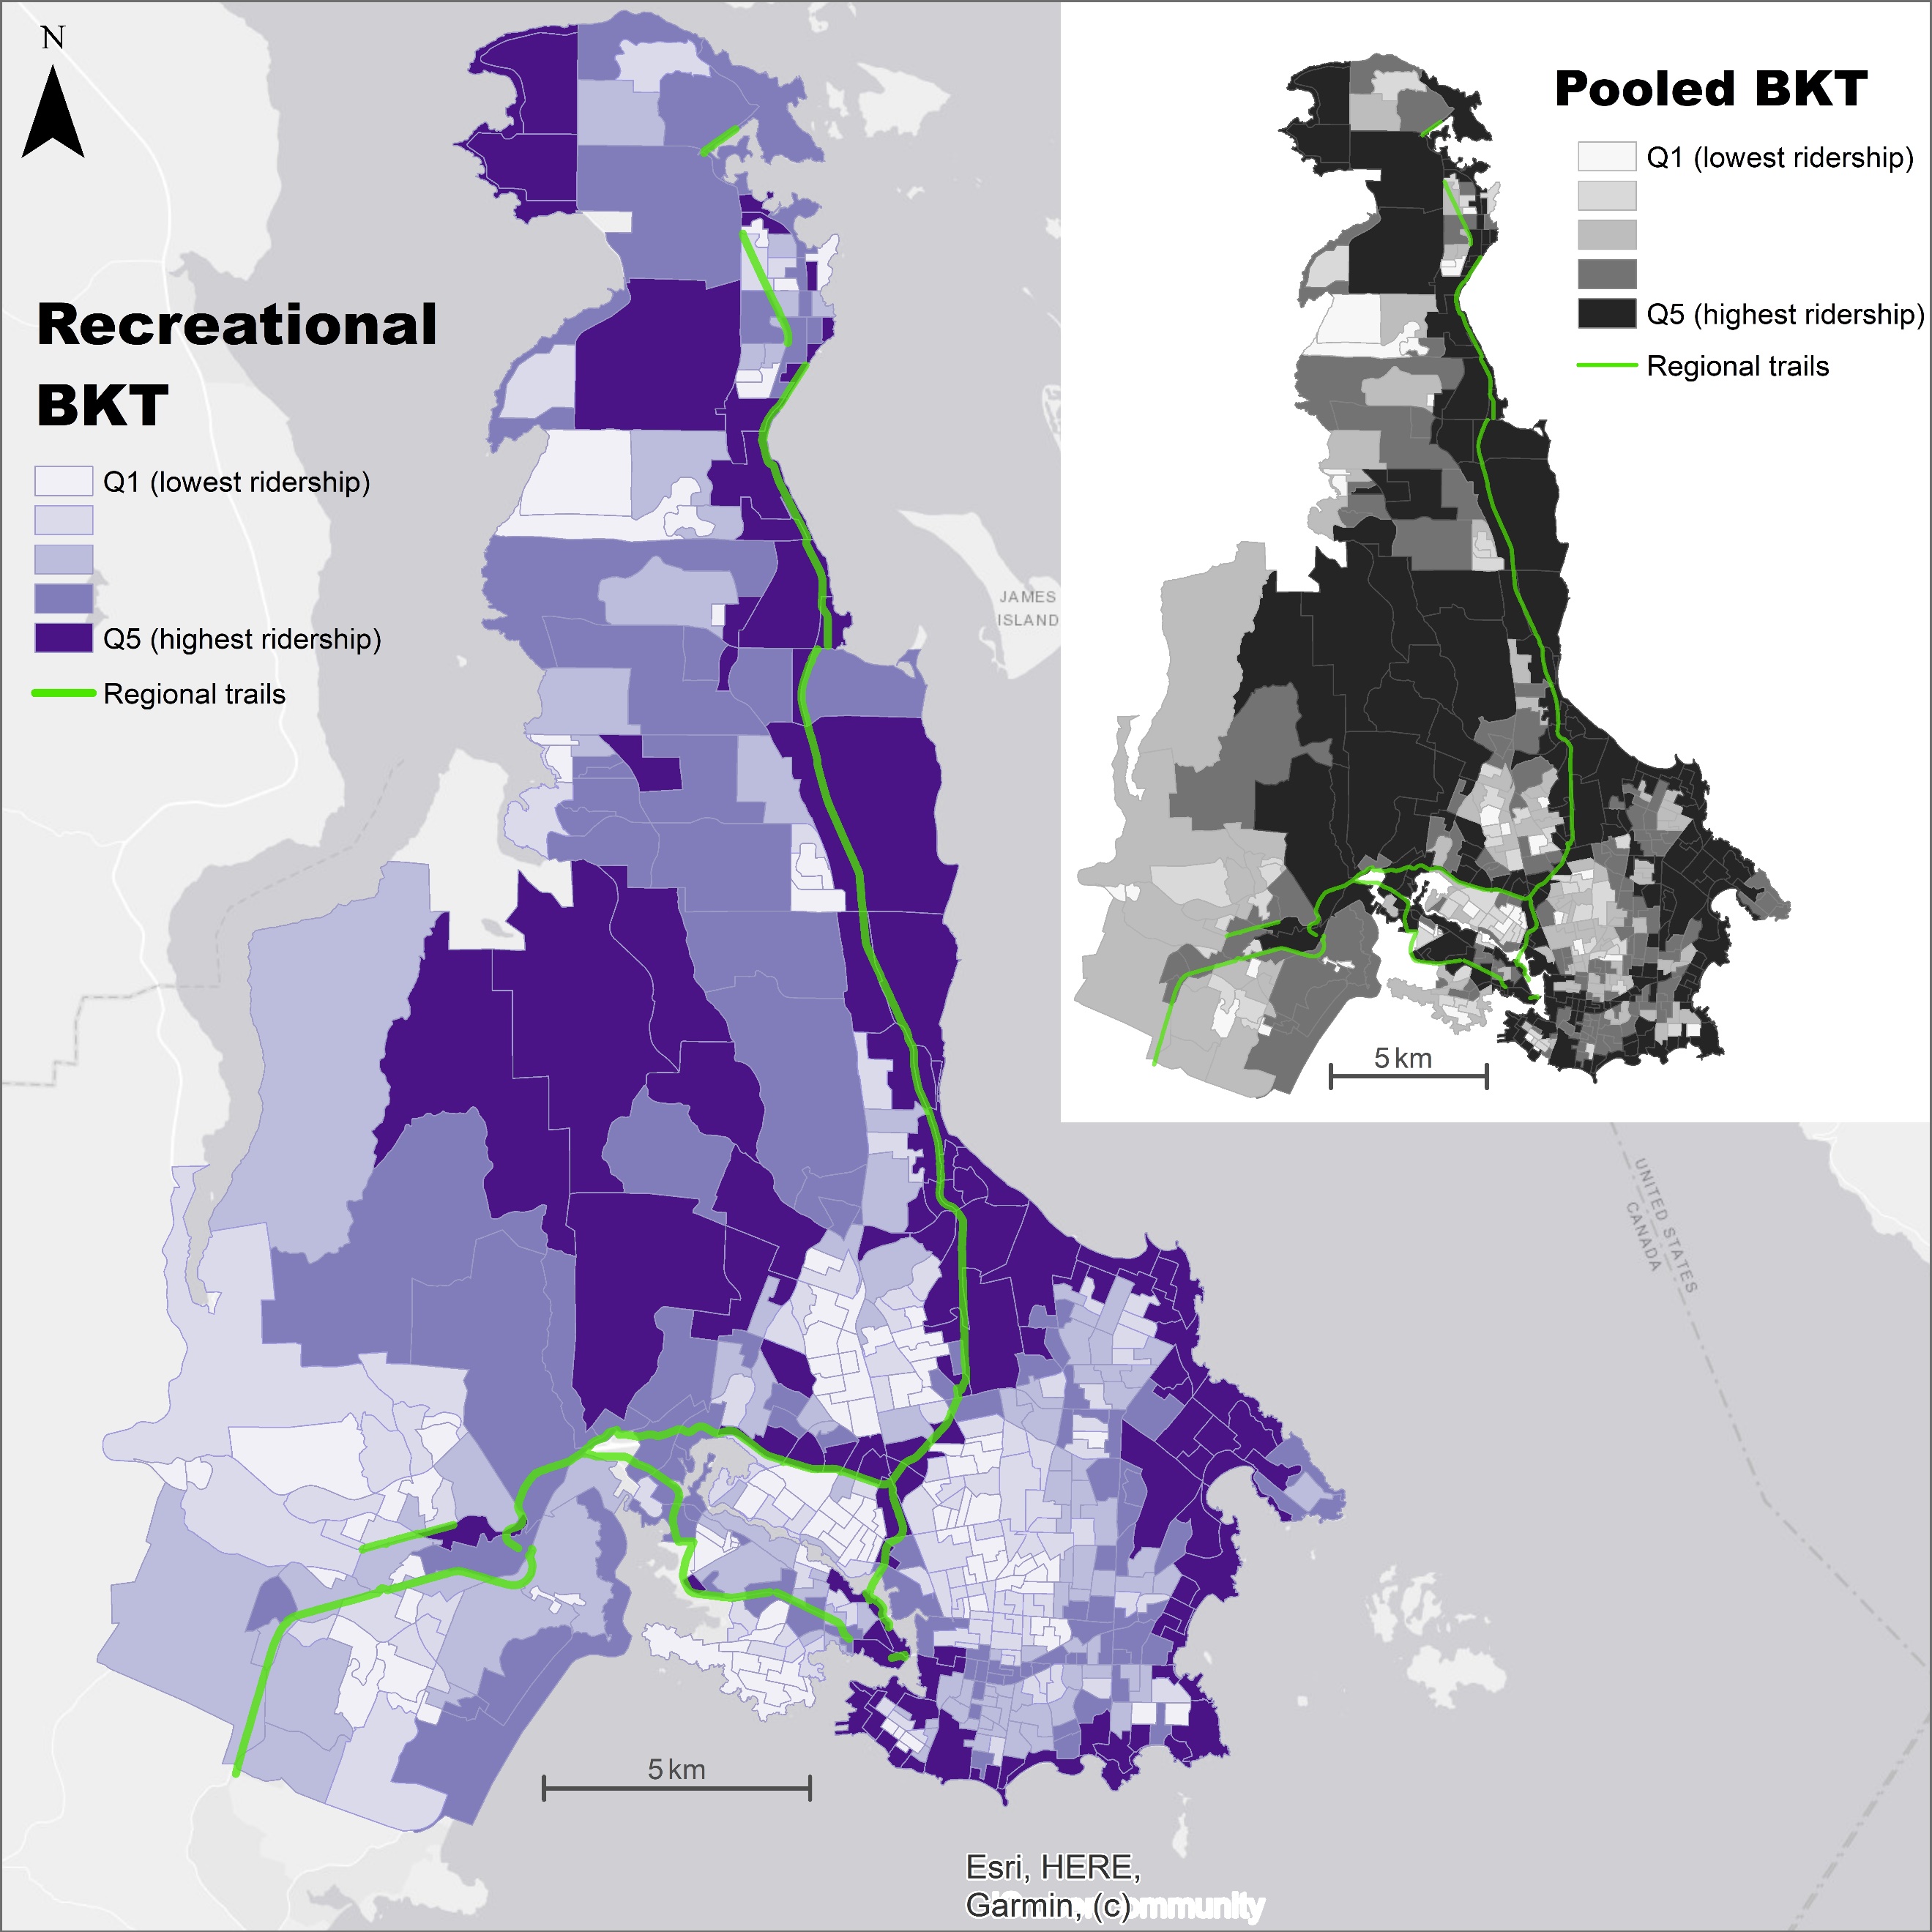
The geographical unit of analysis was the Statistics Canada Dissemination Area (DA; 400-700 people; n = 534). We operationalized Strava ridership as bicycle kilometers traveled (BKT), calculated by multiplying the activity count on each road segment by the segment length and summing the products for each DA (Hochmair, Bardin, and Ahmouda 2019). We standardized BKT by DA total road length and mapped results for each trip type compared to the pooled sample (Figures 1 and 2). Geographic covariates were identified based on previous studies using Strava data, relevance in bicycling studies using conventional data, or local importance to bicycling (Table 1).

Table 1.Geographic covariates used to model Strava bicycle kilometers travelled (BKT) at the dissemination area (DA) level
Variable Operationalization Relevance Source
Sociodemographic
Bike commuters % of the population who bicycle to work Crowdsourced ridership patterns may be similar in areas where more people bicycle to work (Conrow et al. 2018) Statistics Canada 2016 Census
Male population % of the population who is male Men associated with higher levels of bicycling (Aldred, Woodcock, and Goodman 2016) and Strava app usership Statistics Canada 2016 Census
Median household income Quintile Higher and lower income associated with more bicycling (Pucher and Buehler 2006; Winters et al. 2007) Statistics Canada 2016 Census
Post-secondary education % of the population with a post-secondary degree or diploma Those with higher education more likely to bicycle (Winters et al. 2010) Statistics Canada 2016 Census
Under 15 years % of the population under age 15 Children and older adults associated with lower rates of bicycling (Aldred, Woodcock, and Goodman 2016; Pucher et al. 2011) Statistics Canada 2016 Census
Over 65 years % of the population over age 65 Statistics Canada 2016 Census
Visible minority % of the population who is a visible minority Higher neighborhood % of whites associated with more bicycling (Chen, Zhou, and Sun 2017); lower rates of bicycling investment in high % visible minority neighborhoods (Braun, Rodriguez, and Gordon-Larsen 2019) Statistics Canada 2016 Census
Network
Arterial, collector, local roads % of the total neighborhood road network in each functional road class Road class and density influence bicycling safety and route choice (Fraser and Lock 2011; Winters et al. 2010) Capital Regional District
On-street bicycle infrastructure % of the total neighborhood road network with on-street infrastructure Bicycling infrastructure associated with higher rates of bicycling (Fraser and Lock 2011); off-street paths associated with Strava ridership (Hochmair, Bardin, and Ahmouda 2019) Capital Regional District
Off-street bicycle infrastructure % of the total neighborhood road network with off-street infrastructure Capital Regional District
Regional trail Binary variable, 1 if regional trail network passes through DA Important cycling infrastructure in the Victoria region Capital Regional District
Intersection density Count of intersections in 1 km of DA centroid Higher intersection density associated with more bicycling (Winters et al. 2010) Canadian Active Living Environments (Can-ALE)
Built & natural environment
Bridge Binary variable, 1 if DA has a major bridge Bridges are important links between different parts of a street network (Boss et al. 2018; Hochmair, Bardin, and Ahmouda 2019) Capital Regional District
Distance to university Distance from DA centroid to nearest university Bicycling is higher around major destinations like universities (Krizek, Barnes, and Thompson 2009) British Columbia Open Data Catalogue
Steep slopes % of roads with maximum slope >5% (steep) Steep slopes impact route choice in utilitarian cycling and linked to more Strava bicycling (Winters et al. 2010; Lee and Sener 2019) GeoBC
Distance to shore Distance from DA centroid to shoreline Water bodies associated with more bicycling and Strava ridership (Chen, Zhou, and Sun 2017; Hochmair, Bardin, and Ahmouda 2019) Statistics Canada 2016 Census
Safety
Bicycle crash density # of crashes divided by road length Route choice affected by perceptions of safety (Winters et al. 2012) Insurance Corporation of British Columbia

We constructed three spatial error models using GeoDa 1.14 (Anselin 2019) and defined spatial neighbors using queen contiguity. The spatial error models use a Maximum Likelihood approach and treat spatially correlated residuals as a nuisance variable (Anselin 2009). The first and second models predicted DA commute and recreational BKT and the third predicted BKT for the pooled Strava sample.

Spatial analyses of areal data are often influenced by spatial autocorrelation (SAC)—the tendency for neighboring areas to have similar values. In ordinary least squares regression, spatial effects can lead to unreliable results as standard assumptions are violated (Anselin 2009). Spatial regression approaches include spatial lag and spatial error models, and model diagnostics indicate which is appropriate (Anselin 2009). We quantified SAC using Moran’s Ii, and used the Robust Lagrange Multiplier (LM) statistic to select the appropriate spatial regression model; the rule of thumb is to choose the model (lag or error) with the most significant LM test statistic (Anselin 2009). We also considered model fit (R2 and AIC).

Findings

In Victoria, there were 12,971 unique Strava app users and 315,200 activities; 49% (n = 155,252) of activities were identified as commutes. Men accounted for 74.9% (n = 9226) of app users, and 64% of users (n = 7,958) were under age 55. Table 2 shows BKT descriptive statistics. Notably, BKT for recreational trips comprised nearly two-thirds of the total BKT (63.5%); so, while there were approximately equal numbers of commute and recreational activities, the recreational trips tended to be longer in distance.

Table 2.Descriptive statistics for Strava ridership volumes (bicycle kilometers traveled, BKT) in 534 dissemination areas (DA)
Activity Type Mean Median SD Min Max Total
Commute BKT 776.1 529.7 853.9 14.6 12,041.1 414,456.5
Recreational BKT 1,354.2 821.9 1,610.4 46.0 12,454.6 723,148.5
Pooled BKT 2,130.4 14,114.1 2,308.7 67.9 24,495.7 1,137,605.0
Figure 1
Figure 1.Strava commute BKT compared to the pooled sample (quintiles) in DAs (n = 534).
Figure 2
Figure 2.Strava recreational BKT compared to the pooled sample (quintiles) in DAs (n = 534).
Table 3.Spatial regression estimates of DA Strava ridership (bicycle kilometers traveled, BKT) for trips labeled commute, recreation, and the pooled sample (all data combined).
Outcome Commute BKT Recreational BKT Pooled BKT
Spatial dependence diagnostics
Moran’s Ii 8.7*** 13.9*** 12.2***
Robust Lagrange Multiplier (lag) 2.7 14.3*** 6.7**
Robust Lagrange Multiplier (error) 12.2*** 9.0* 13.2***
R2 (lag) 0.6 0.6 0.6
R2 (error) 0.6 0.6 0.6
AIC (lag) 8305 9019 9422
AIC (error) 8289 8986 9389
Geographic covariates
Sociodemographic
Bike commuters 2120.6*** 4861.2*** 7030.5***
Male population 1793.9 3542.4 5341.3
Median household income 37.6 27.6 69.0
Post-secondary education 616.8 916.4 1489.9
Under 15 years -1182.7 -237.5 -1297.0
Over 65 years 574.2 2015.9** 2623.0*
Visible minority -291.2 -850.6 -1152.6
Street network
Arterial road 608.0 3348.4*** 4071.2***
Collector road 211.0 1847.6** 2117.4*
Local road -245.2 277.1 39.2
On-street bicycle infrastructure 1572.9*** 585.6 2087.9*
Off-street bicycle infrastructure 2589.7*** 2904.0** 5488.3***
Regional trail network 759.9*** 734.7*** 1475.0***
Intersection density -3.2 -20.9*** -24.2***
Built and natural environment
Bridge 765.9*** 701.1* 1450.0**
Proximity to university -29.0* -65.4 -96.8*
Steep slopes (more hills) 214.1 746.0* 927.9*
Distance to shore -202.4*** -509.7*** -720.6***
Safety
Bicycle crash density 93.5*** 52.7 140.1*
Constant -637.3 -1087.3 -1697.2
Spatial error (Lambda) 0.5*** 0.8*** 0.7***

*** p < 0.001, ** p < .01, * p < 0.05

Strava activities labelled as commutes showed higher ridership levels in DAs that were closer to universities, had more on-street infrastructure, and higher bicycle crash densities. Recreational activities showed higher ridership in DAs with older populations, more hills and major roads (arterial and collector), and lower intersection density. Strava activities for commute or recreation showed similar levels of ridership in DAs with regional trails, more off-street infrastructure, higher bicycle mode share, bridges, and closer proximity to the ocean.

Using Strava data labelled as commute activities, instead of a pooled sample, may mitigate bias in Strava data and better represent ridership patterns of people of all ages and abilities. When using only the commute activities, we saw different spatial patterning in ridership and found that activities tended to be in areas with bicycle infrastructure, lower levels of safety, and around universities. Recreation activities were more common in areas with major roads, steep slopes, and lower intersection density—factors that are typically less preferred and less safe for bicycling (Teschke et al. 2012; Winters et al. 2010). Other important covariates were common across commute and recreational trips (regional trails, off-street infrastructure, bicycle mode share, bridges, and proximity to the ocean) and would be selected from either the commute or pooled sample. This suggests that if a planning exercise aimed to model overall ridership using Strava data and geographic covariates, a distinct set of covariates would be selected if only the commute data were used. In Victoria, commuting accounted for 49% of all Strava activities and 36.5% of the total distance (e.g., BKT). From other Strava analyses we learn the proportion of commute trips varies across cities (e.g., 21% in El Paso, Texas (Lee and Sener 2019), 85% in Milan, Italy (Sunde 2019). If interested in modeling all ages and abilities ridership, researchers and practitioners should consider using only commute data, at least in cities where the sample is sufficiently large.

Acknowledgements

The authors would like to acknowledge Strava for providing the data.

References

Aldred, Rachel, James Woodcock, and Anna Goodman. 2016. “Does More Cycling Mean More Diversity in Cycling?” Transport Reviews: Cycling As Transport 36 (1): 28–44. https:/​/​doi.org/​10.1080/​01441647.2015.1014451.
Google Scholar
Anselin, L. 2009. “Spatial Regression.” In The SAGE Handbook of Spatial Analysis, edited by S. Fotheringham and P. Rogerson, 255–75. London: Sage Publications. https:/​/​doi.org/​10.4135/​9780857020130.
Google Scholar
———. 2019. GeoDa (1.14) [Software]. https:/​/​geodacenter.github.io/​.
Google Scholar
Boss, Darren, Trisalyn Nelson, Meghan Winters, and Colin J. Ferster. 2018. “Using Crowdsourced Data to Monitor Change in Spatial Patterns of Bicycle Ridership.” Journal of Transport & Health 9 (June):226–33. https:/​/​doi.org/​10.1016/​j.jth.2018.02.008.
Google Scholar
Braun, Lindsay M., Daniel A. Rodriguez, and Penny Gordon-Larsen. 2019. “Social (in)Equity in Access to Cycling Infrastructure: Cross-Sectional Associations between Bike Lanes and Area-Level Sociodemographic Characteristics in 22 Large U.S. Cities.” Journal of Transport Geography 80 (October):102544. https:/​/​doi.org/​10.1016/​j.jtrangeo.2019.102544.
Google Scholar
Chen, Peng, Jiangping Zhou, and Feiyang Sun. 2017. “Built Environment Determinants of Bicycle Volume: A Longitudinal Analysis.” Journal of Transport and Land Use 10 (1): 655–74. https:/​/​doi.org/​10.5198/​jtlu.2017.892.
Google Scholar
Conrow, Lindsey, Elizabeth Wentz, Trisalyn Nelson, and Christopher Pettit. 2018. “Comparing Spatial Patterns of Crowdsourced and Conventional Bicycling Datasets.” Applied Geography 92 (March):21–30. https:/​/​doi.org/​10.1016/​j.apgeog.2018.01.009.
Google Scholar
Fraser, Simon D.S., and Karen Lock. 2011. “Cycling for Transport and Public Health: A Systematic Review of the Effect of the Environment on Cycling.” European Journal of Public Health 21 (6): 738–43. https:/​/​doi.org/​10.1093/​eurpub/​ckq145.
Google Scholar
Hochmair, Hartwig H., Eric Bardin, and Ahmed Ahmouda. 2019. “Estimating Bicycle Trip Volume for Miami-Dade County from Strava Tracking Data.” Journal of Transport Geography 75 (February):58–69. https:/​/​doi.org/​10.1016/​j.jtrangeo.2019.01.013.
Google Scholar
Jestico, Ben, Trisalyn Nelson, and Meghan Winters. 2016. “Mapping Ridership Using Crowdsourced Cycling Data.” Journal of Transport Geography 52 (April):90–97. https:/​/​doi.org/​10.1016/​j.jtrangeo.2016.03.006.
Google Scholar
Krizek, Kevin J., Gary Barnes, and Kristin Thompson. 2009. “Analyzing the Effect of Bicycle Facilities on Commute Mode Share over Time.” Journal of Urban Planning and Development 135 (2): 66–73. https:/​/​doi.org/​10.1061/​(asce)0733-9488(2009)135:2(66).
Google Scholar
Lee, Kyuhyun, and Ipek N. Sener. 2019. “Understanding Potential Exposure of Bicyclists on Roadways to Traffic-Related Air Pollution: Findings from El Paso, Texas, Using Strava Metro Data.” International Journal of Environmental Research and Public Health 16 (3): 371. https:/​/​doi.org/​10.3390/​ijerph16030371.
Google ScholarPubMed CentralPubMed
Livingston, Mark, David McArthur, Jinhyun Hong, and Kirstie English. 2020. “Predicting Cycling Volumes Using Crowdsourced Activity Data.” Environment and Planning B: Urban Analytics and City Science, May, 1–17. https:/​/​doi.org/​10.1177/​2399808320925822.
Google Scholar
Nelson, Trisalyn A., Avipsa Roy, Colin J. Ferster, J. Fischer, V. Brum-Bastos, and Meghan Winters. 2020. “Best Practices for Modeling Bicycle Ridership with Crowdsourced Data.”
Pucher, John, and Ralph Buehler. 2006. “Why Canadians Cycle More than Americans: A Comparative Analysis of Bicycling Trends and Policies.” Transport Policy 13 (3): 265–79. https:/​/​doi.org/​10.1016/​j.tranpol.2005.11.001.
Google Scholar
Pucher, John, Ralph Buehler, Dafna Merom, and Adrian Bauman. 2011. “Walking and Cycling in the United States, 2001-2009: Evidence from the National Household Travel Surveys.” American Journal of Public Health 101 (S1): S310–17. https:/​/​doi.org/​10.2105/​ajph.2010.300067.
Google ScholarPubMed CentralPubMed
Roy, Avipsa, Trisalyn A. Nelson, A. Stewart Fotheringham, and Meghan Winters. 2019. “Correcting Bias in Crowdsourced Data to Map Bicycle Ridership of All Bicyclists.” Urban Science 3 (2): 62. https:/​/​doi.org/​10.3390/​urbansci3020062.
Google Scholar
Statistics Canada. 2016. “Victoria [Census Metropolitan Area], British Columbia and British Columbia [Province] (Table).” Census Profile. 2016 Census. Statistics Canada Catalogue no. 98-316-X2016001. https:/​/​www12.statcan.gc.ca/​census-recensement/​2016/​dp-pd/​prof/​index.cfm?Lang=E.
———. 2017. “Census in Brief: Commuters Using Sustainable Transportation in Census Metropolitan Areas.” https:/​/​www12.statcan.gc.ca/​census-recensement/​2016/​as-sa/​98-200-x/​2016029/​98-200-x2016029-eng.cfm.
Sunde, E. 2019. “Tracking the Rise of Bike Commuting around the World.” Medium. https:/​/​medium.com/​strava-metro/​tracking-the-rise-of-bike-commuting-around-the-world-5bada94585c5.
Teschke, Kay, M. Anne Harris, Conor C. O. Reynolds, Meghan Winters, Shelina Babul, Mary Chipman, Michael D. Cusimano, et al. 2012. “Route Infrastructure and the Risk of Injuries to Bicyclists: A Case-Crossover Study.” American Journal of Public Health 102 (12): 2336–43. https:/​/​doi.org/​10.2105/​ajph.2012.300762.
Google ScholarPubMed CentralPubMed
Winters, Meghan, Shelina Babul, H. J. E. H. Becker, Jeffrey R. Brubacher, Mary Chipman, Peter Cripton, Michael D. Cusimano, et al. 2012. “Safe Cycling: How Do Risk Perceptions Compare With Observed Risk?” Canadian Journal of Public Health 103 (S3): S42–47. https:/​/​doi.org/​10.1007/​bf03403834.
Google ScholarPubMed CentralPubMed
Winters, Meghan, Michael Brauer, Eleanor M. Setton, and Kay Teschke. 2010. “Built Environment Influences on Healthy Transportation Choices: Bicycling versus Driving.” Journal of Urban Health 87 (6): 969–93. https:/​/​doi.org/​10.1007/​s11524-010-9509-6.
Google ScholarPubMed CentralPubMed
Winters, Meghan, Melissa C. Friesen, Mieke Koehoorn, and Kay Teschke. 2007. “Utilitarian Bicycling. A Multilevel Analysis of Climate and Personal Influences.” American Journal of Preventive Medicine 32 (1): 52–58. https:/​/​doi.org/​10.1016/​j.amepre.2006.08.027.
Google Scholar

This website uses cookies

We use cookies to enhance your experience and support COUNTER Metrics for transparent reporting of readership statistics. Cookie data is not sold to third parties or used for marketing purposes.

Powered by Scholastica, the modern academic journal management system