

1. Research Questions and Hypothesis
Significant rises in air travel and airport commerce have resulted in an increasing number of airport employees in many metro regions in the US. For instance, Denver International Airport (DEN) is now the largest employer in the state of Colorado. Other major airports, including Hartsfield-Jackson Atlanta International (ATL), Dallas-Fort Worth International (DFW), and Los Angeles International (LAX), each employ approximately 50,000 people across the many job types typical of modern airports, including food service, retail, baggage handling, and operations. This article addresses the following questions: Do the energy expenditures of airport employee commuting vary substantially from airport to airport? If so, by what magnitude? Through an exploration of trends on commute length and feasibility of alternative commute options, we estimate and compare energy and travel distances for employees, across six major airports representing more than 200,000 commuters.
In contrast to air-passenger ground-access mode choice, there has been very little attention paid to airport employee ground-access mode use in existing literature. More recent research has continued to confirm the lack of analyses on the travel patterns of airport employees (National Academies 2008), despite their potentially representing 12% of the people accessing the airport daily and 24% of all person-trips (because commutes are round-trips) on average across the six airports studied here (FAA 2018).
2. Methods and Data
The US Census Bureau compiles employee origin-destination data for an estimated 95% of the US workforce in partnership with each of the 50 states. The resulting Longitudinal Employer-Household Dynamics (LEHD) dataset is published annually based on the records of each employer’s mandatory registration of its employees in the unemployment insurance system. Employee residence and workplace spatial information is thus provided at the fine resolution of a census block.
In this investigation, the census block group containing each of the six airports in question was used as the workplace, and the corresponding employee residential census blocks were mapped. A distance-based GIS analysis was then conducted to quantify the number of employees living within a certain distance of each airport to estimate the energy usage involved in employee commuting. Total energy implications by airport were estimated using US Census Bureau commuting mode-choice data. For airports within city limits, the city’s mode-choice estimates were used, and for airports outside of city limits, the metro area’s mode-choice estimates were used. This approach was validated comparing city and metro area mode-choice data with employee survey data from DEN (Denver), and was found to be nearly identical (City and County of Denver, Department of Aviation 2011).
3. Findings
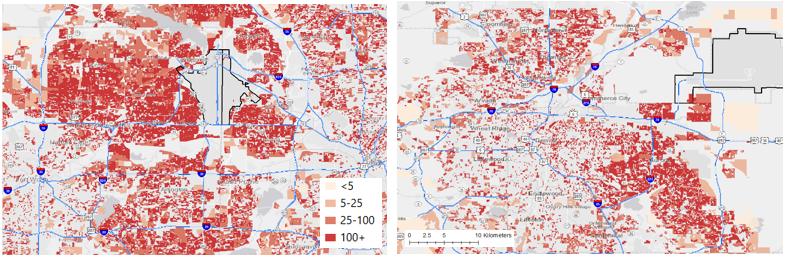
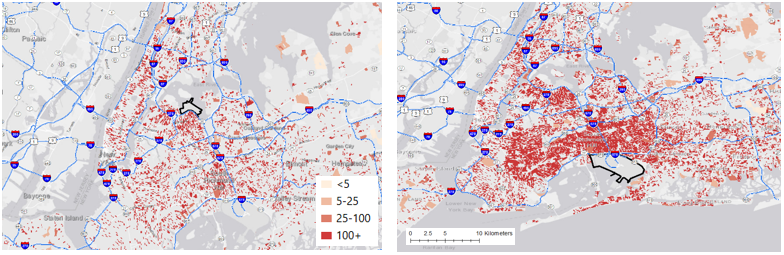
Six airports were chosen for this analysis based on their rapid growth figures and where our team has existing relationships. Each of the six airports was found to have unique spatial distribution; some airports like DFW (Dallas-Fort Worth) and JFK (New York) saw a large share of employees within 8 km (5 miles) of the airport, while other airports like ATL (Atlanta) and LAX (Los Angeles) saw the largest share of employees residing more than 32 km (20 miles) from the airport. DEN (Denver) and LaGuardia (LGA) saw a more even distribution of employees living closer to and farther from the airports (Figure 1). Comparing the median commute distance from the airport with the median commute distance for each city at large (Kneebone and Holmes 2015) yielded an important finding: Airport commutes are on average longer than other commutes in the city.

The spatial distribution of employees is unique to each airport. In Figure 2, side-by-side maps (plotted to the same scale for direct comparison) are presented for peer airports in this study. DEN’s location at the extreme eastern edge of the metro area sees a large cluster of employees in the eastern residential areas closer to the airport. DFW’s location central in the metro area sees employees largely living in the suburban areas stretching north and west from the airport rather than in the central cities of the region.
.**_density_of_employee_origins_(employees_per_km_2_)_by_census_block_for_dfw_(dallas-f.png)
ATL (Atlanta) and LAX (Los Angeles) both have large numbers of their employees commuting from origins much farther from the airport itself. ATL (Atlanta) sees large numbers of employees commuting from areas farther south in Georgia rather than from the Atlanta metro area, which lies largely to the north of the airport. LAX sees many employees coming from most areas within the greater metro region, with a notable cluster near the airport’s eastern entrance.
.**_density_of_employee_origins_(employees_per_km_2_)_by_census_block_for_atl_(atlanta).png)
JFK and LGA airports within New York City tend to see a tighter clustering of employees closer to the airports themselves. JFK especially exhibits this trend, with a great number of employees living in the neighborhoods adjacent to the airport to the north. The authors note this may be due to more affordable housing closer to the airports in New York than is available in other cities.
.**_density_of_employee_origins_(employees_per_km_2_)_by_census_block_for_lga_and_jfk_a.png)
In order to quantify the energy implications of employee commuting to each of these airports, the number of employees within each distance ring was multiplied by the corresponding commuting distance. From the resulting estimates of person miles traveled (PMT), energy use was estimated using the Transportation Life-Cycle Assessment (LCA) database for single-occupancy vehicle (SOV) assuming free-flow conditions, carpool (two passenger assumption), and transit energy usage (Chester and Horvath 2009). This information is summarized in Table 1.
Each airport sees employee origin locations that are very context specific, resulting in large disparities in energy use signatures. ATL (Atlanta), with the largest number of employees and large number of long-distance commuters, unsurprisingly uses the most energy annually in commuting. Meanwhile, JFK and LGA (New York), with their shorter commute distances and higher transit usage, use less than half of the per capita energy for commuting purposes. The authors would like to note that this may be due to transit being more accessible to these airports than others.
When adjusted on a per-employee basis, the disparities tend to hold. Estimated fuel use for commuting by employees at ATL (Atlanta) is highest, with DFW (Dallas-Fort Worth), LAX (Los Angeles), and DEN (Denver) using significantly less. Both of New York’s airports are even lower. Our key findings include that airport employees have longer commutes than most other commuters in their respective cities, that employee energy signatures vary up to three-fold between these three major airports, and that employee distribution and accessibility to transit for airport commuting is highly context-specific.
Acknowledgements
This work was authored by the National Renewable Energy Laboratory (NREL) operated by Alliance for Sustainable Energy, LLC, for the U.S. Department of Energy (DOE) under Contract No. DE-AC36-08GO28308. Funding was provided by the U.S. Department of Energy Vehicle Technologies Office. The views expressed in the article do not necessarily represent the views of the DOE or the U.S. Government. The U.S. Government retains and the publisher, by accepting the article for publication, acknowledges that the U.S. Government retains a nonexclusive, paid-up, irrevocable, worldwide license to publish or reproduce the published form of this work, or allow others to do so, for U.S. Government purposes. The research team also acknowledges and appreciates Drs. Stanley Young and Alejandro Henao from NREL for providing comments and feedback for this project.