
1. Questions
Traffic signal systems such as SCATS timestamp the first accepted pedestrian actuation for a movement. Once a call has been stored, later pedestrians arriving before service normally add no observable count. The controller record is therefore an incomplete record of pedestrian arrivals. It does, however, retain the interval from flashing-don’t-walk onset to first actuation, which contains information about arrival frequency, and the subsequent interval to Walk, which determines potential delay.
Most published push-button count studies fit empirical relationships between controller activity and observed pedestrian flows. Larger Utah and Oregon studies show that these relationships are nonlinear and context dependent (Singleton and Runa 2021; Kothuri et al. 2024; Vahedi Saheli et al. 2026). A closer timing-based study derived pedestrian flows from a Poisson arrival model and button and signal events at two midblock crossings (Li and Wu 2021), while high-resolution sensor research estimated pedestrian delay directly (Karimpour et al. 2022). The method tested here is theory based: it derives an arrival-event rate from first-actuation waiting time and censored exposure, then calibrates the remaining difference between arrival events and people. The open questions are its count and delay adjustments and the effect of observed compliance on delay.
We ask:
-
How accurately does the theory-based first-actuation estimator predict observed pedestrian arrivals after calibration?
-
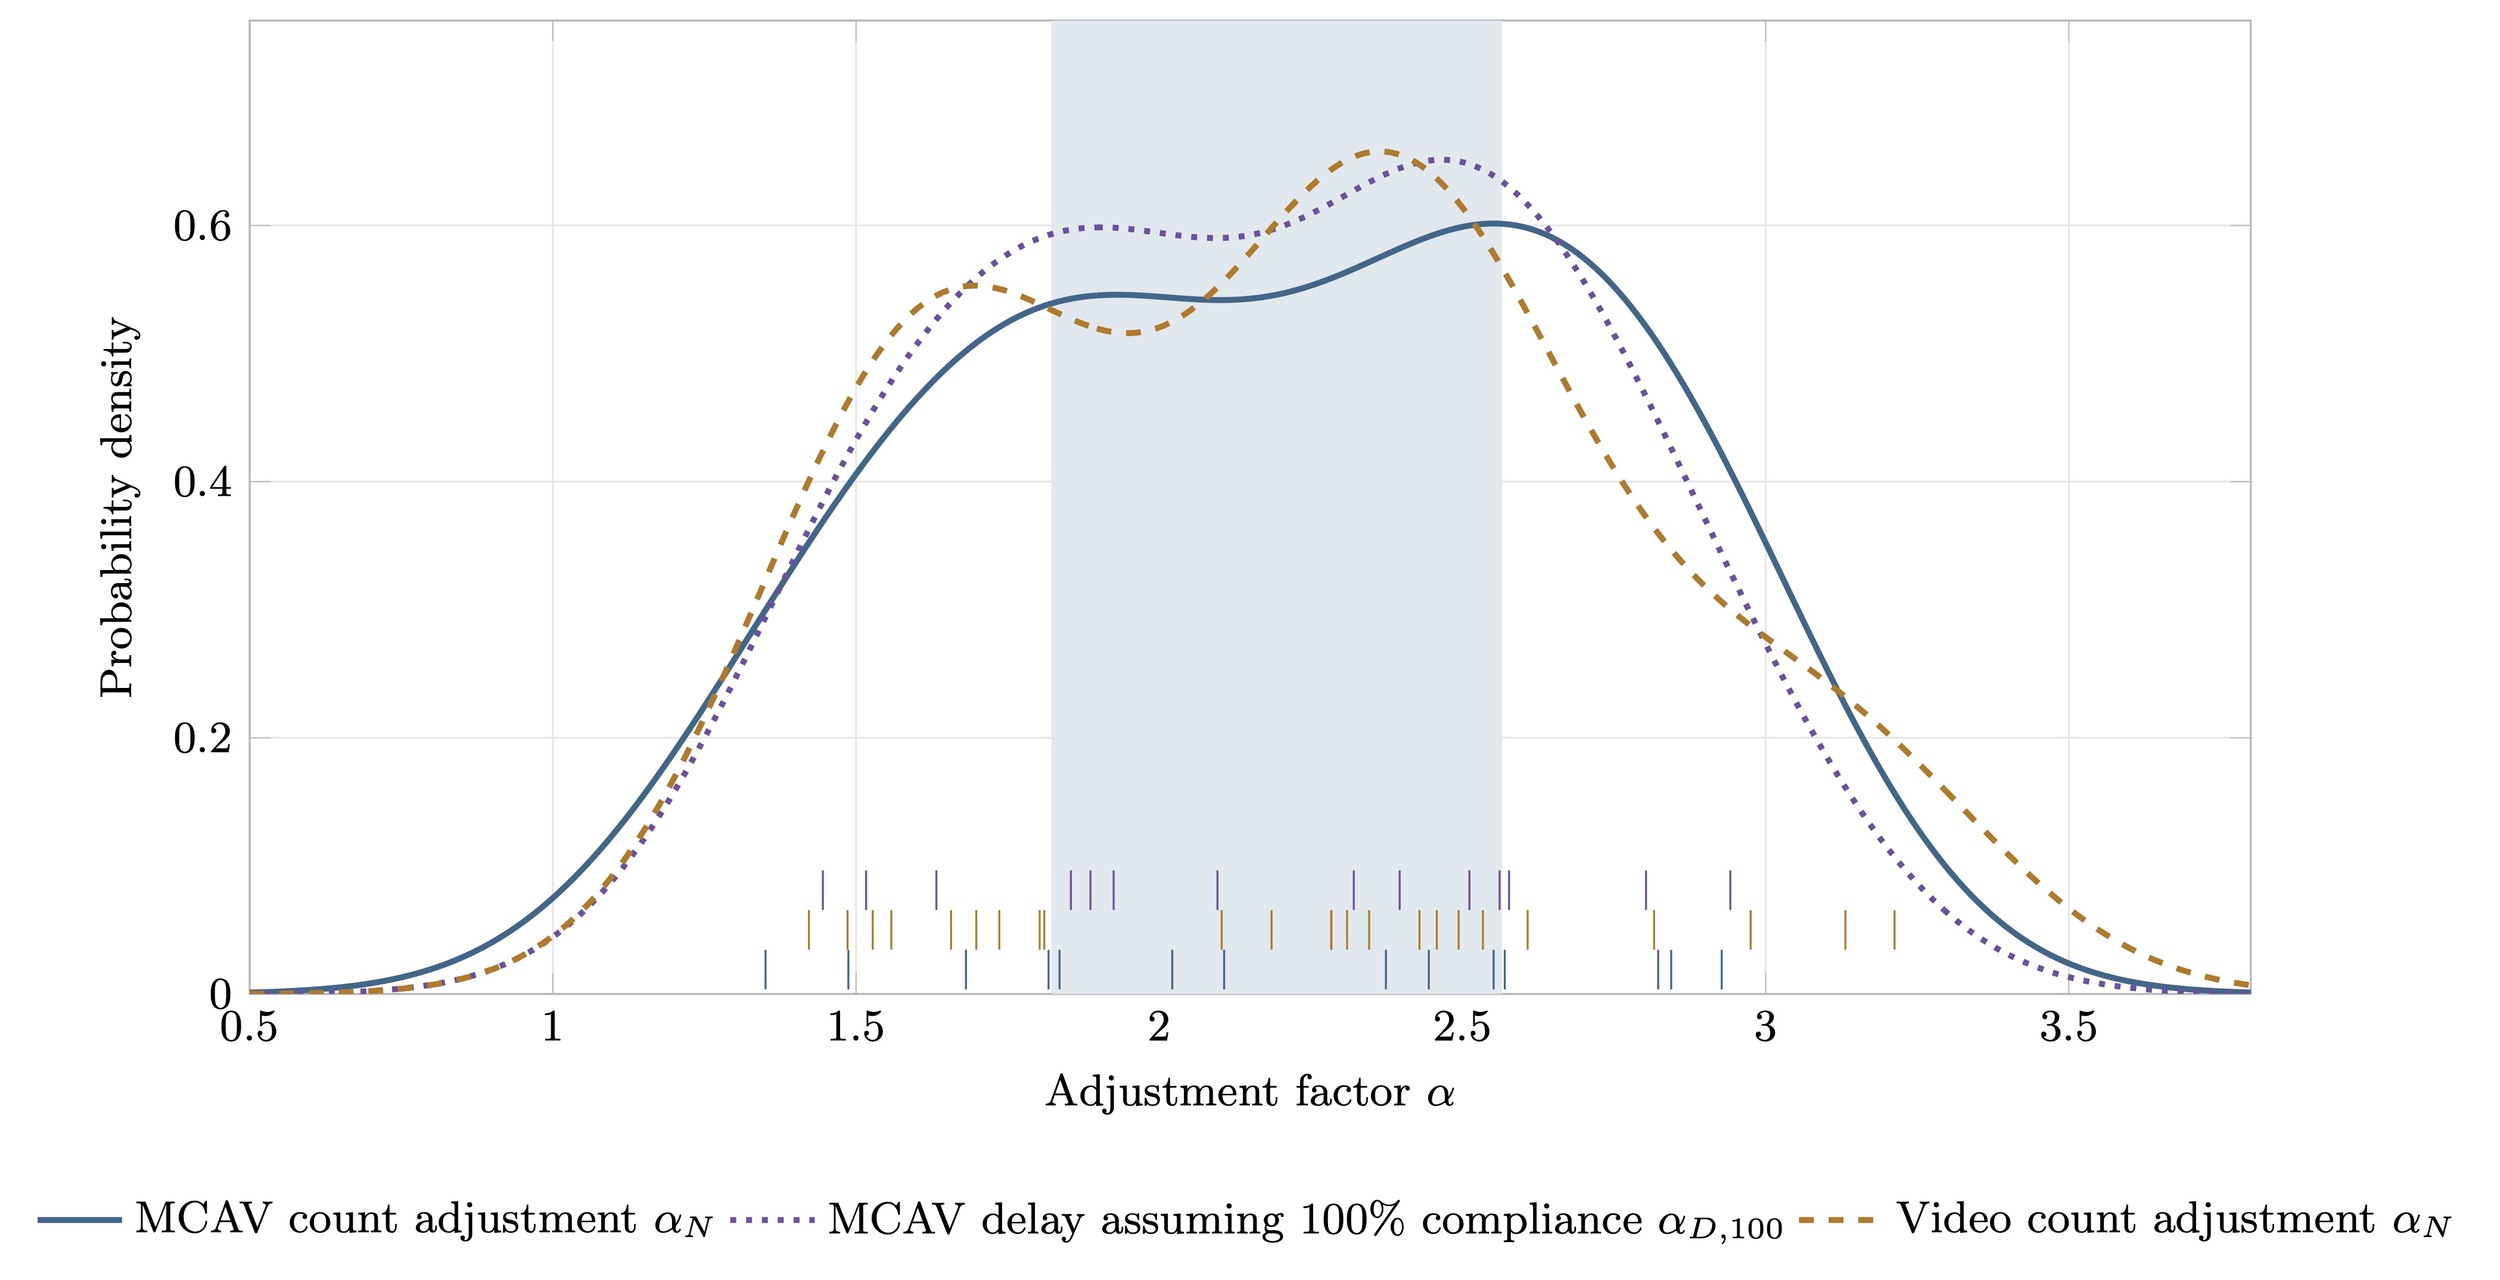
How large and variable are the adjustments for pedestrian counts, delay assuming 100% compliance, and delay under observed behavior?
-
Does an independently collected video sample produce similar count and delay adjustments under the same estimator?
2. Methods
Data
The Manual Crossing-Actuation Validation (MCAV) data contain second-by-second signal indication, pedestrian arrival, and actuation observations collected around midday in August 2022. Fourteen crossing-direction cases at 11 Sydney intersections contain 1,744 pedestrians, 513 actuations, 492 restrictive cycles, and 14.07 hours of exposure.
The peer dataset records 2,004 pedestrians at three Sydney intersections in six weekday hour-long video sessions (Choy and Levinson 2026). One record without a mapped crossing leg is excluded, leaving 2,003 pedestrians in 24 leg-session cases. Complete directional signal timelines identify every restrictive cycle, including cycles without pedestrians. The pedestrian table records arrival and crossing-start times and binary actuator use, but not a separate press timestamp.
Method
The same estimator and calibration calculations are applied to both datasets. The method posits that the interval from flashing-don’t-walk onset to first actuation is the waiting time to the first actuation-producing arrival event in a locally Poisson process. A cycle without an actuation is a right-censored waiting time. The resulting censored exponential likelihood supplies the event rate; extending it over total exposure gives the predicted arrival events. This is a theory-based base estimate rather than a direct empirical conversion from calls to people.
Let identify a validation case and a restrictive signal cycle beginning at flashing-don’t-walk onset. The set contains cycles with an actuation and contains cycles that end without one. For an actuated cycle, is the time from flashing-don’t-walk onset to its first actuation. For a cycle without actuation, is its full restrictive duration. The number of actuated cycles is and is the case’s total observed exposure. Assuming locally Poisson arrival events, the estimated rate and predicted number of arrival events are
ˆλj=Kj∑i∈AjYi+∑i∈CjCi,ˆNj=Tjˆλj.
The first actuation in each restrictive cycle supplies the timing observation; the fitted rate represents later arrival events. Calibration accounts for people arriving in groups and for arrivals that do not actuate.
For each actuated cycle, let be the time from first actuation to the next Walk. The first arrival contributes seconds of delay, while later Poisson arrivals contribute the second term below. The model’s unexpanded case delay is
ˆDi=Ri+ˆλjR2i2,ˆDj=∑i∈AjˆDi.
Let be the observed number of pedestrians. For delay, is the total wait to the next Walk when every observed restrictive-phase arrival complies, and is total delay under observed behavior. The count and delay adjustment factors are
αN,j=NjˆNj,αD,j,100=Dj,100ˆDj,αD,j,obs=Dj,obsˆDj.
An adjustment of one reproduces the observed target; a value above one expands the model estimate.
We trace the pooled count adjustment through three observable steps. A universal-actuation replay replaces the first press with the first observed restrictive-phase arrival while retaining empty cycles; its estimate is The number of one-second intervals containing one or more pedestrian arrivals is The ratio is the mean number of people in an occupied arrival second and primarily represents group arrivals at the available temporal resolution. The resulting identity separates missing actuation, group arrivals, and remaining timing/model differences:
αpoolN=∑jNj∑jˆNj=∑jˆNallj∑jˆNj×∑jNj∑jEj×∑jEj∑jˆNallj.
The equations and decomposition are unchanged between datasets; only the mapping from observations to inputs differs. MCAV supplies the first press time directly. In video, the first eligible actuator user’s recorded arrival time is treated as the press time because a separate timestamp is unavailable. MCAV applies each case’s observed compliant share to because behavior is recorded by class rather than by person-linked crossing-start time. Video instead sums each restrictive-phase arrival’s recorded wait to crossing start. Leave-one-case-out prediction is otherwise identical: each held-out estimate is multiplied by the mean count adjustment from all other cases, and accuracy is summarized by the predicted total and mean absolute percentage error.
3. Findings
MCAV contains 805.6 predicted arrival events for 1,744 pedestrians. Leave-one-case-out calibration predicts 1,776.7 pedestrians with 23.9% mean absolute percentage error. Video contains 937.3 predicted arrival events for 2,003 mapped pedestrians; its corresponding prediction is 2,067.4 with 22.4% error. Applying the MCAV mean adjustment directly to video predicts 2,064.4 pedestrians, 3.1% above the observed total.
Panel C applies Equation 4 identically to both datasets. Its three multipliers reproduce pooled count adjustments of 2.165 for MCAV and 2.137 for video. The group-arrival terms imply 1.195 and 1.178 people per occupied arrival second. At the observed rates, chance same-second coincidence explains only a small part of the excess above one (SI), so these terms primarily represent pedestrians arriving together. Video’s larger missing-actuation term is offset by a smaller remaining timing/model term, so similar overall adjustments arise through different mechanisms. Collection method is confounded with site and signal regime: this contrast does not identify a method effect, and site composition may explain as much or more of the component differences. Counts include all arrivals. Observed noncompliance among 63 of 1,728 classified MCAV crossers reduces the delay scenario. In video, 666 restrictive-phase crossers avoid 5.029 hours relative to their next-Walk counterfactual.
The multi-site Utah and Oregon studies fit context-dependent empirical count relationships. The present estimator instead begins with a Poisson waiting-time model for first-actuation latency and uses calibration only to convert its event-equivalent base into people. Its contribution is a theory-based timing estimator with empirical count and delay adjustment distributions, rather than a universal people-per-call factor.
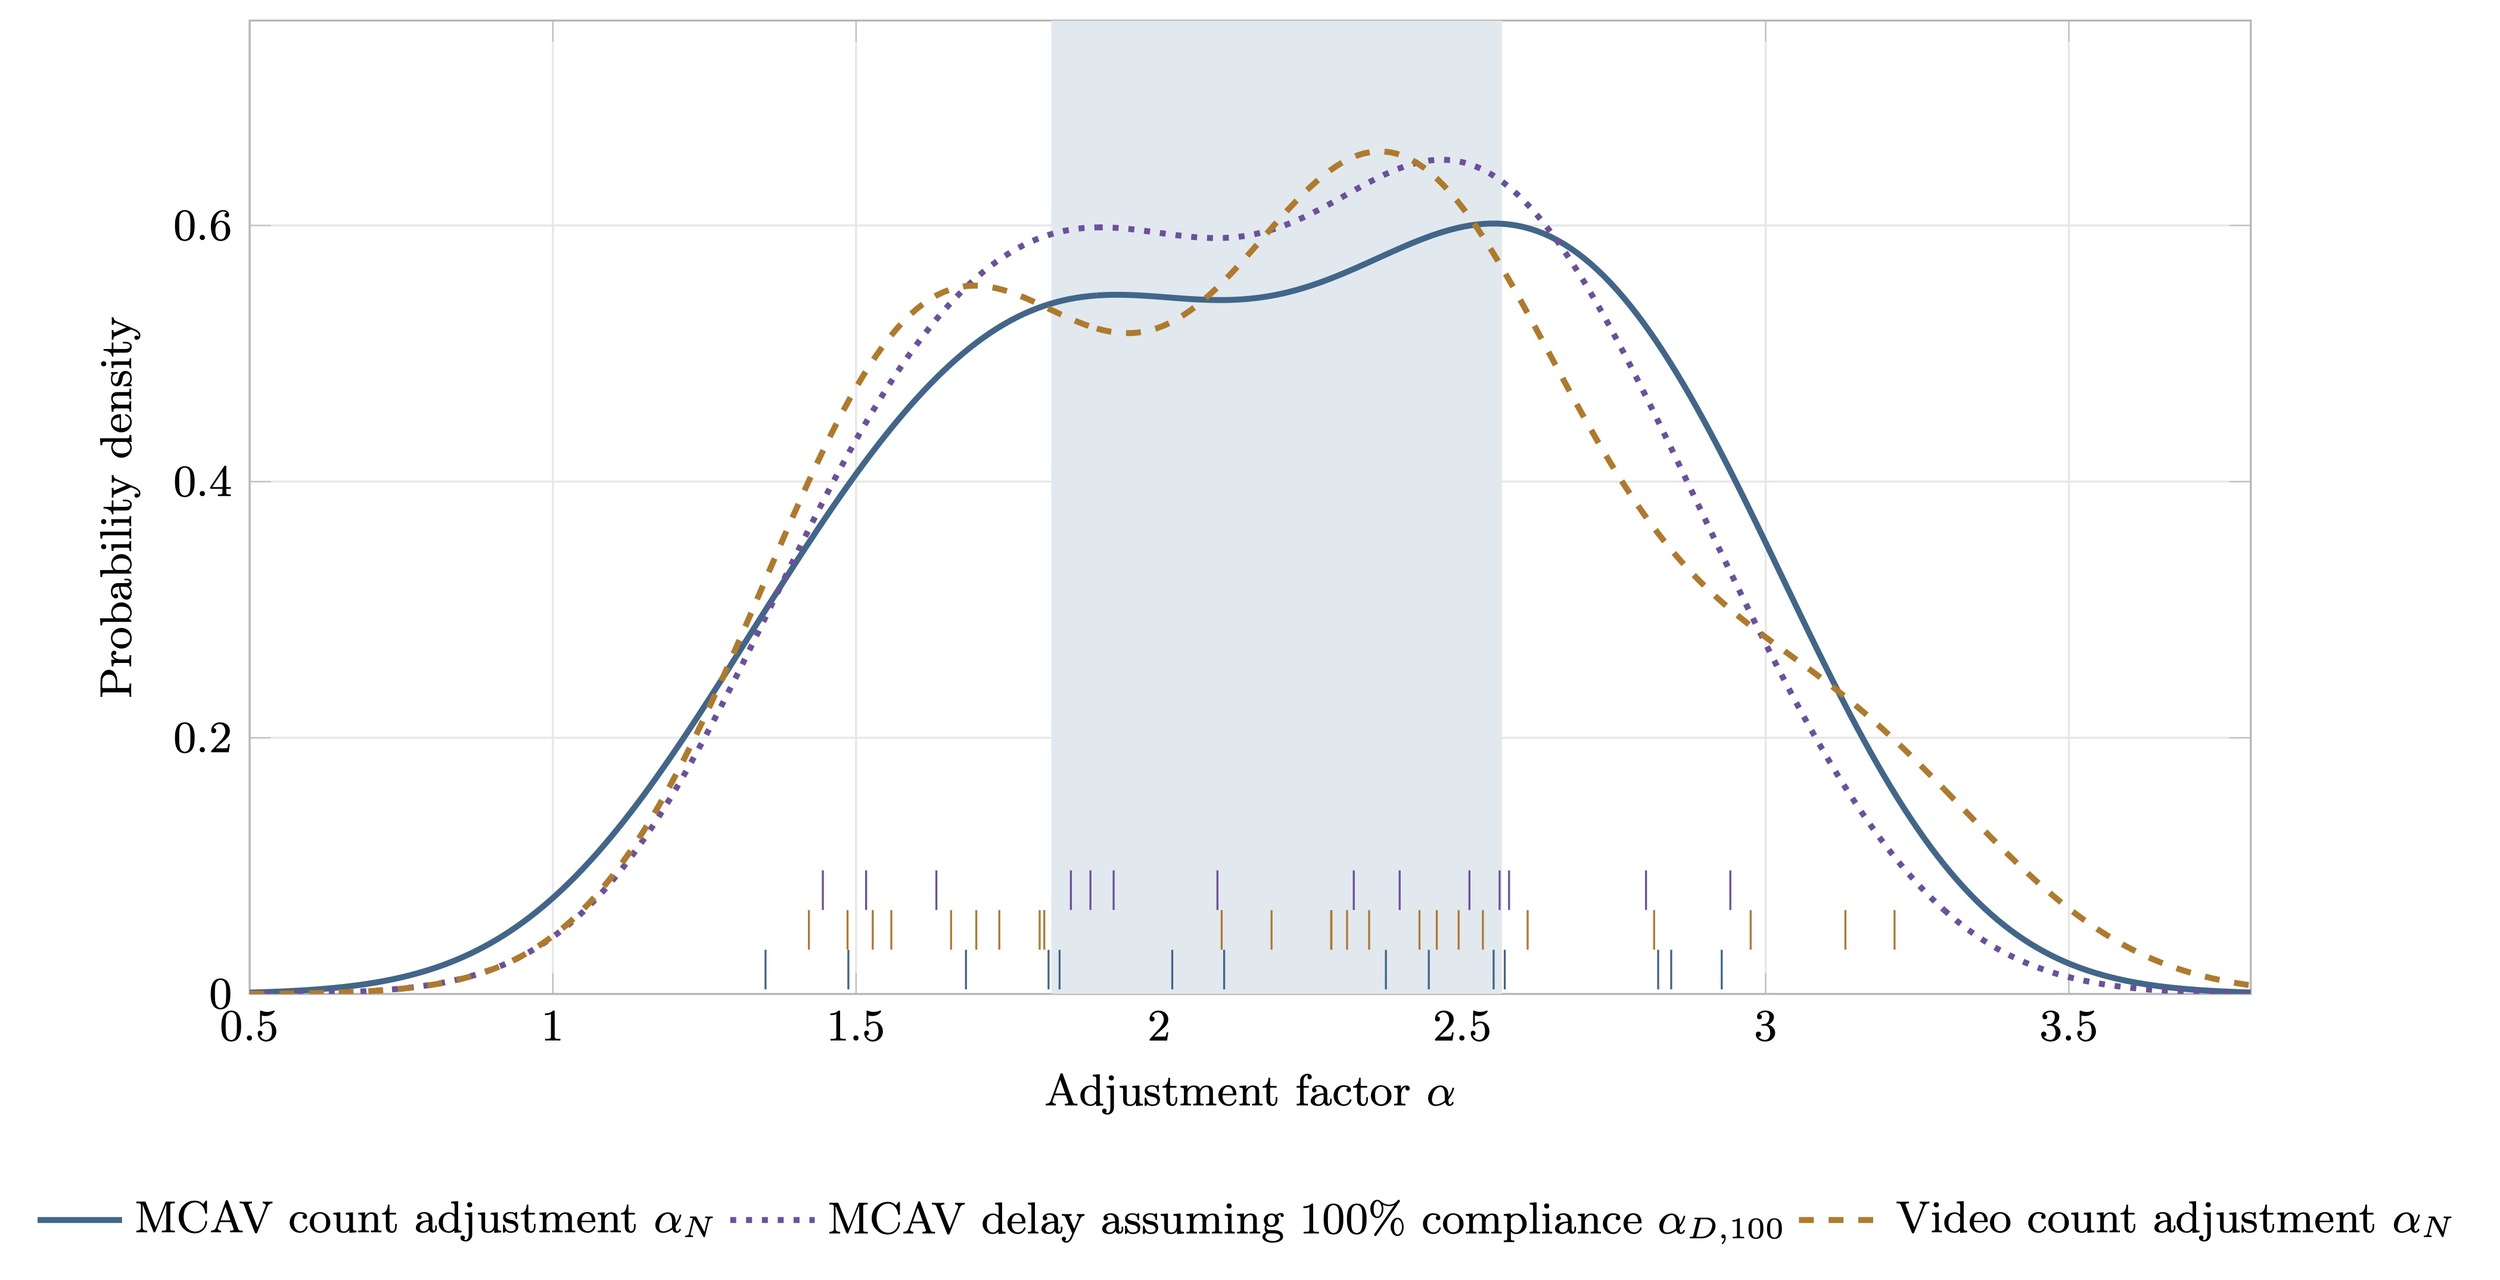
The count means are nearly identical across observation methods, while local ranges remain wide. Video observed-behavior delay includes recorded post-Walk startup; delay assuming 100% compliance ends at Walk onset. The 14 paired MCAV cases form the transfer distribution for subsequent controller-history applications, and the 24 video cases provide an independent peer test.
Acknowledgments
Zhenyu Liu collected the manual field observations. Keng Io Choy collected the video observations and supplied upstream pedestrian and signal tables. Anthropic Claude and OpenAI Codex assisted with code review and manuscript editing; the author verified the analysis and text.
Data and Code Availability
The public video archive is associated with Choy and Levinson (2026). Reproducible scripts, input manifests, checksums, manual validation data, and derived case outputs are provided with the submission package.
Funding and Conflict of Interest
The author reports no project-specific funding or conflict of interest.