
RESEARCH QUESTION
As a much cheaper alternative to rail transit, bus rapid transit (BRT) has recently gained momentum in the Minneapolis-St. Paul metropolitan area (Twin Cities). Currently, three BRT lines are in operation and eight more lines are at different planning stages (Metropolitan Council, n.d.). Because the Green Line light rail, commencing in 2014, increased housing values along its corridor (Cao and Lou 2018), local residents worry about whether deploying BRT lines will bring about premiums and reduce housing affordability. This concern is not surprising because property value increase and gentrification may increase difficulty of poor households to retain their residences (Padeiro, Louro, and Da Costa 2019).
We applied a difference-in-difference (DID) hedonic pricing model to housing sales data in Ramsey County, MN, to answer the following research question: when and how much did the A Line BRT affect property values of station-area housing? This study used the same research design as Cao and Porter-Nelson (2016) and Cao and Lou (2018), but found no effect.
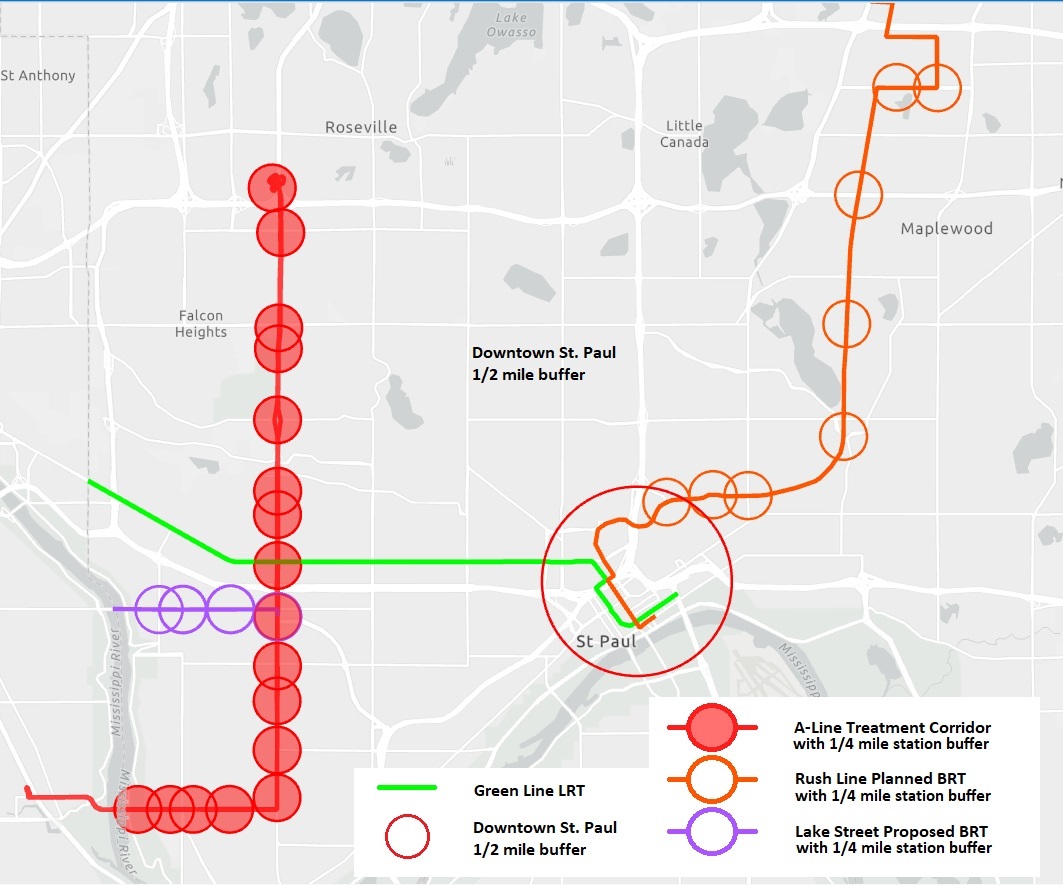
The A Line serves a 15.6-km corridor situated on Minnesota State Highway 51/Snelling Avenue where it connects the Rosedale Transit Center to the 46th Street Station (Figure 1). With a total project cost of $27 million (1/35 of that of the 17.7-km Green Line light rail transit), it replaced three existing routes with a primary focus of increasing efficiency and speed by placing stations about 800 meters apart. The A Line uses unique buses and has fully-equipped stations similar to light rail stations. Its headway is 10 minutes for most of the day. It receives a preferential treatment of traffic signal priority at intersections. However, the A Line is regarded as an arterial BRT or low-level BRT because it operates in mixed traffic (Cain et al. 2009).
METHOD AND DATA
Following Cao and Lou (2018), this study adopted a treatment-control research design. The treatment was the A Line. When there are no equivalent corridors/areas in the region, researchers choose the best available controls when exploring the effects of rail transit on land development (Rodriguez, Vergel-Tovar, and Camargo 2016; Cervero and Landis 1997; Bhattacharjee and Goetz 2016). This study selected control corridors based on a 2013 Metro Transit study of planned future BRT networks (Figure 1). The A Line had its full funding grant agreement (FFGA) announced on February 13, 2015 and subsequently launched into service on June 11, 2016. We treated these two dates as key points in time for the project. The sample included houses that were with 400 m (¼ mile) of BRT stations and major bus stops in the control corridors, and were sold between January 2012 (three years before the FFGA announcement) and March 2020. The housing records were derived from the tax parcel data of the Ramsey County Assessor’s Office. Table 1 shows that mean sales prices of houses in both corridors increased over time.[1] Houses in the A Line corridor were more expensive than those in the control corridors. Except for 2012,[2] the price differences between the two areas were about $320-350 per square meter. Therefore, housing prices in both areas before A Line implementation are comparable.
To distinguish whether an observed effect represents the value added by BRT or an effect of station locations (Ko and Cao 2013), a before-after analysis (i.e., a DID model) is in order. The DID hedonic pricing model is expressed as follows:
Y=f(S,G,A,O,O×A,FFGA,FFGA×A),(1)
where Y is the sales price per square meter of a house; S denotes its structural factors; G represents its geographic features; and A is a dummy variable designating whether the house is confined in the treatment corridor. To examine the timing of value uplift by the A Line, two dummy variables (FFGA and O, indicating whether a house was sold following the announcement of the FFGA or operation of the A Line) and two interactive terms (O×A) and (FFGA×A) were included. The interactive terms are our policy variables of interest, consistent with Hurst and West (2014) and Cao and Lou (2018). If they are significant, the FFGA announcement and operation of the A Line affect housing values.
Table 2 presents all variables used in this study and their descriptive statistics. Location variables were computed using ArcGIS and all other variables were from the tax parcel data. Housing sales prices were adjusted by the consumer pricing index (CPI).
FINDINGS
We estimated the hedonic model using a linear regression. Table 3 presents model results. The effects of all the significant housing attributes on sales price are consistent with our expectation. Distance to downtown St. Paul is positively associated with housing value, congruent with Cao and Lou (2018).
After controlling for these variables, the treatment dummy variable has a significant and positive coefficient, indicating that houses in the A Line corridor were more expensive than those in the control corridors. Dummy variables for FFGA and opening are also significant although the former is at the 0.1 level. Their positive coefficients suggest that county wide, housing sales prices increased during this period of time. The two policy variables (O×A and FFGA×A) have positive coefficients. However, they are not statistically significant, suggesting that the A Line had not affected housing value. Note that we also developed a model with an additional control corridor (the West 7th Street) and reached the same conclusion.
Why did the Green Line increase property values while the A Line did not? The Green Line operates on rail tracks whereas the A Line operates in mixed traffic. Home buyers, as well as developers, may regard the A Line as less permanent than a light rail line and paying a premium for potentially temporary access is risky (Currie 2006). The Green Line was supported by zoning changes and parking reduction (Cao and Lou 2018) but there were no transit-supportive land use policies for the A Line. By adopting strategies such as making fewer stops, off-board fare payment, and signal priority, the A Line travels faster than regular buses. For branding, A Line buses use the same exterior design and colors as light rail trains. However, some car drivers in the corridor did not notice service changes brought by the A Line and others regarded the A Line just as regular buses, as suggested by car users’ responses to our self-conducted field survey.
In 2017, the A Line served 4,700 riders per weekday, higher than the projection of 4,000 riders. The absence of house price increases eases the displacement concern of local residents. Therefore, the A Line is objectively serving the public of Western Ramsey County as it was designed to. The arterial BRT was created to serve the people who call that area home and has continued to do so without destabilizing the housing market in the area. However, without value uplift and land development along the A Line, it is a challenge to reach the goal of 8,000 daily riders in 2030.
In the Twin Cities, housing prices reached bottom in 2011.
We tested a model using the data from 2013 to 2020 and found that neither FFGA nor opening of the A Line have a significant effect on housing prices.