
1. QUESTIONS
Transit catchment areas describe the spatial extent around transit stations that draws in users. Understanding these catchment areas is essential for ridership prediction, station planning, and transit-oriented development, as inappropriate thresholds may bias demand estimation and affect how planning policies are applied. Studies have shown that access distances vary across bus, metro, and rail systems, and are affected by different feeder modes such as walking, public transit, cycling, and car (El-Geneidy et al. 2014; Vijayakumar et al. 2011; Wang et al. 2016). O’Sullivan and Morrall (1996) showed that applying bus-stops thresholds to Light Rail Transit (LRT) underestimates walking distances significantly, suggesting the necessity of calculating system-specific thresholds. Li et al. (2022) further illustrated that metro catchment areas differ between access and egress. The goal of this research is to understand the catchment area for a newly operated LRT system in Montréal, Canada, by different modes of access and egress, and across sociodemographic groups.
2. METHODS
The Réseau express métropolitain (REM) is a 67-kilometer LRT system that started operation in 2023 in Montréal, Canada. We use data from Wave 6 of the Montréal Mobility Survey (MMS), a bilingual survey that was collected in February and March 2026. The MMS collects REM use, travel behavior, and sociodemographic characteristics (Wu et al. 2026). REM users reported details of their most recent commute trip using it, including home and work/school location. Network distance is calculated from home, work, or school to the corresponding REM station using the dodgr package in R on a walking graph (Padgham 2019), which provides a consistent and comparable measure across travel modes.
The survey reports all non-REM modes used during the trip without specifying which leg, so we infer the mode for each leg using a priority of car, transit, bicycle, and walk. A single reported mode is assigned to both legs. For multimode trips with car, car is assigned to the home leg, and the remaining higher-priority mode is assigned to the egress leg. For trips without car use, the higher-priority mode is assigned to the longer leg. Lower priority modes are dropped if more than two modes are included. We cap walking at 30 minutes at speed 1.25m/s (Bastos et al. 2014). Walk-only trips exceeding the threshold are dropped, and mixed-mode trips are reassigned to a higher-priority reported mode. Bicycle trips are removed because of the small sample in winter. We then trim each leg-mode group at its 98th percentile to remove outliers, resulting in 969 access and 878 egress observations. To assess the plausibility of the mode assignment, we manually review all 25 unique combinations of reported modes, legs, and assigned modes. For each combination, we ensure that the assignment is consistent with participants’ responses and reasonable given the observed distances for home-based trips.
Complementary cumulative distribution functions (CCDF) are constructed with a curve fitted using log-logistic: , where is the proportion of users travelled at distance meters or further, α represents the distance where the curve reaches 50%, and β is the steepness of the curve. Finally, we compare the mean access and egress distances across sociodemographic groups and use pairwise t-tests to identify whether each group differs from reference categories.
3. FINDINGS
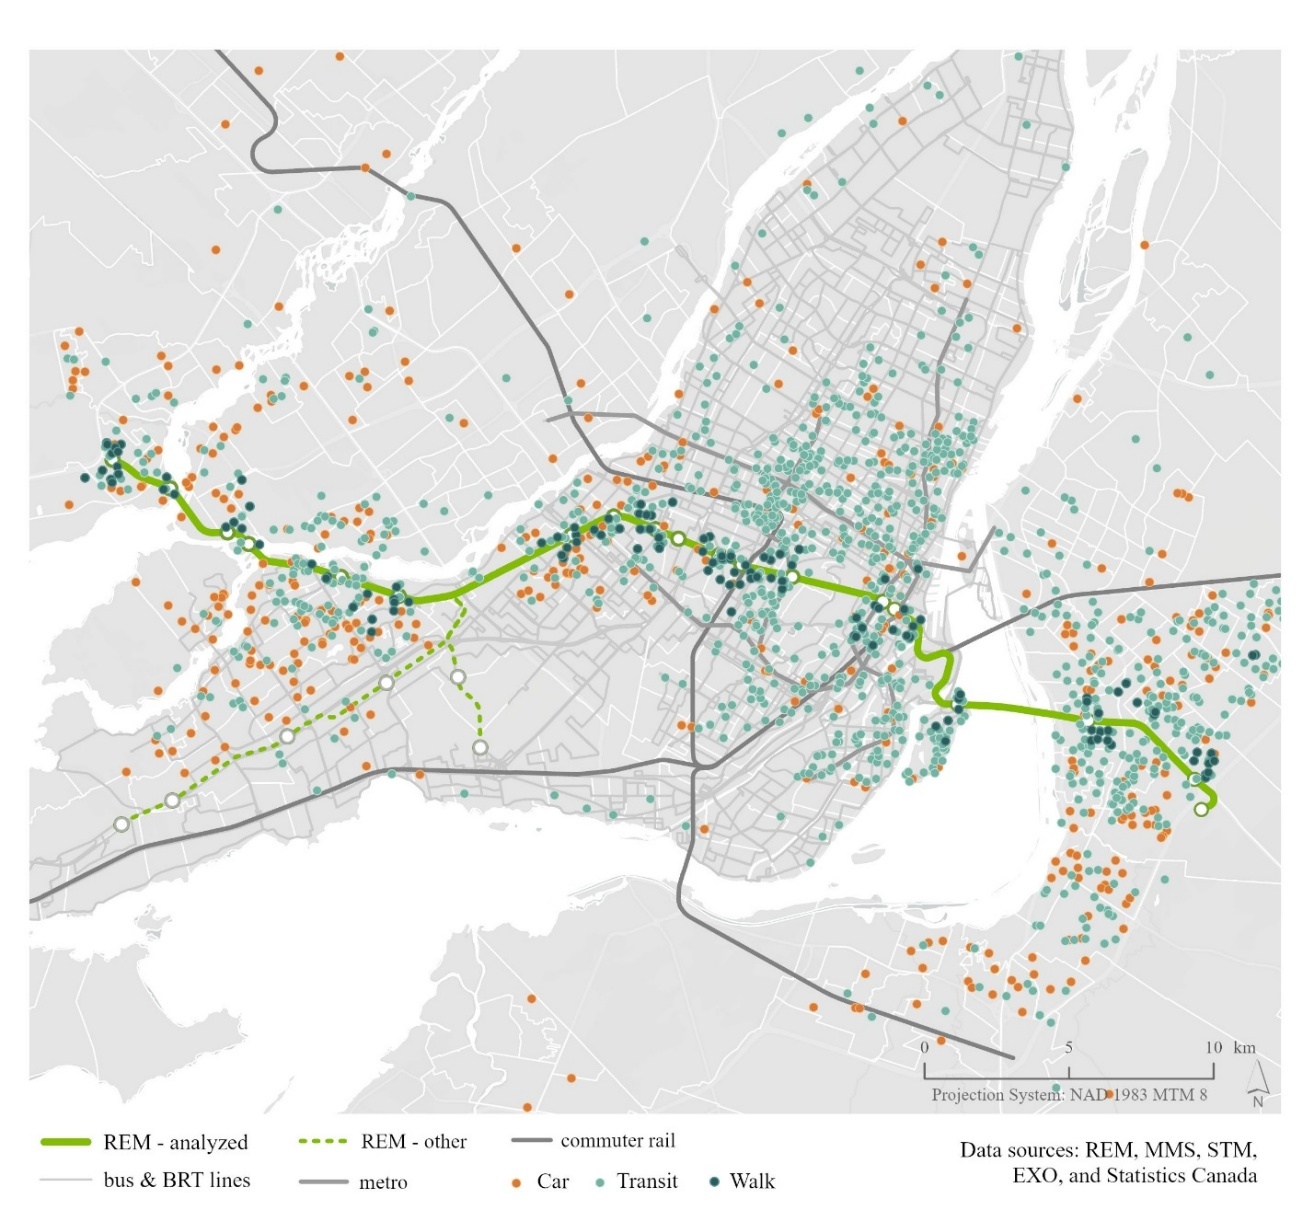
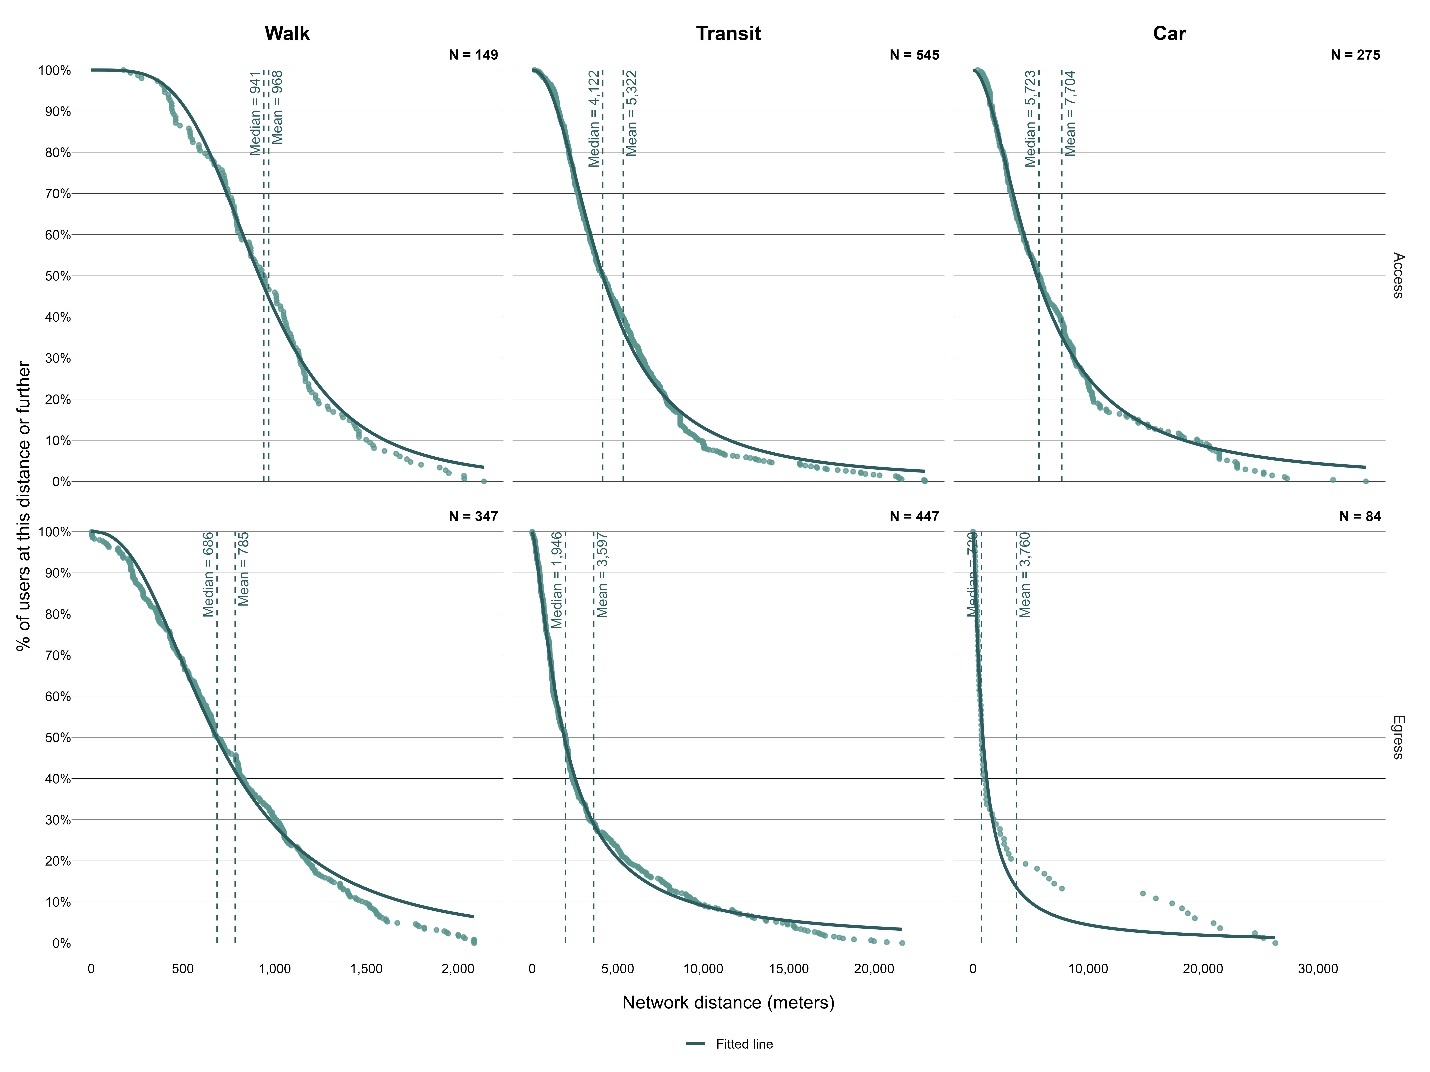
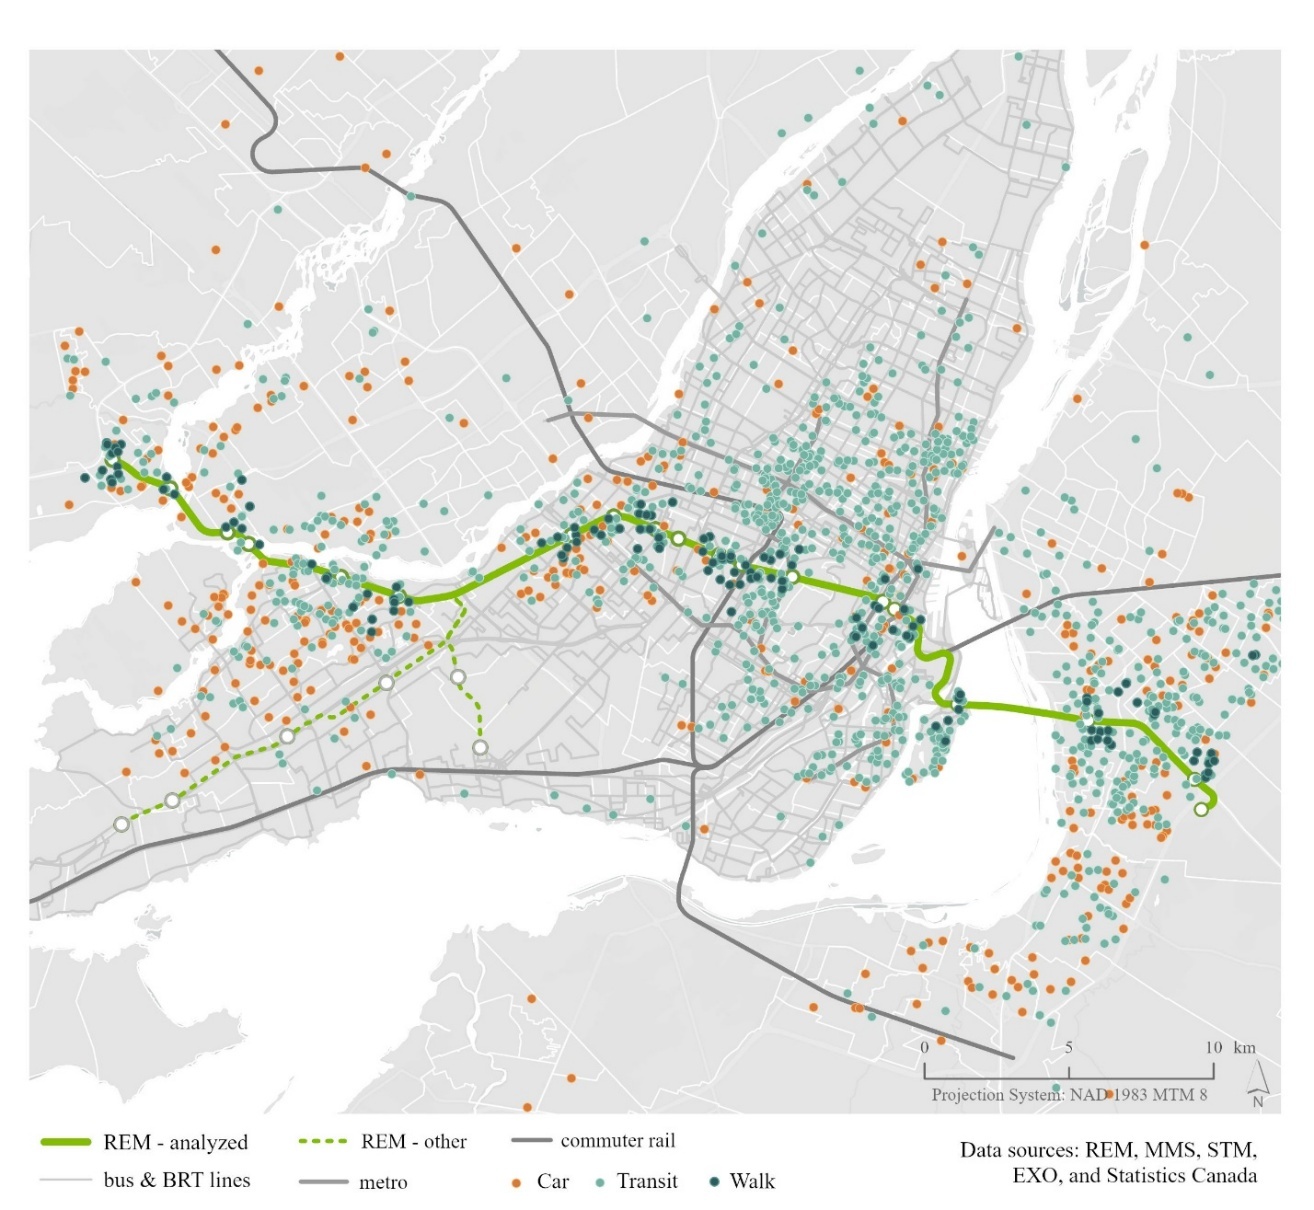
Figure 1 shows that REM users who walk live closer to stations, while transit and car users are more dispersed around the REM line. Figure 2 further shows that distance thresholds differ by feeder modes and trip legs. Walking has the shortest catchment, with a mean of 968 meters for access from home, and 785 meters for egress to work or school, and the 75th percentile reaches 1,167 meters and 1,062 meters for egress, respectively. Transit connections have longer mean distances, at 5,322 meters for access and 3,597 for egress. Their 75th percentiles are 7,085 meters and 4,601 meters. Car users travel the long distances with a mean of 7,704 meters and a 75th percentile of 9,917 meters on access, while 3,760 meters and 2,688 meters on egress. These 84 records on egress mainly come from participants who indicate only cars as main mode.
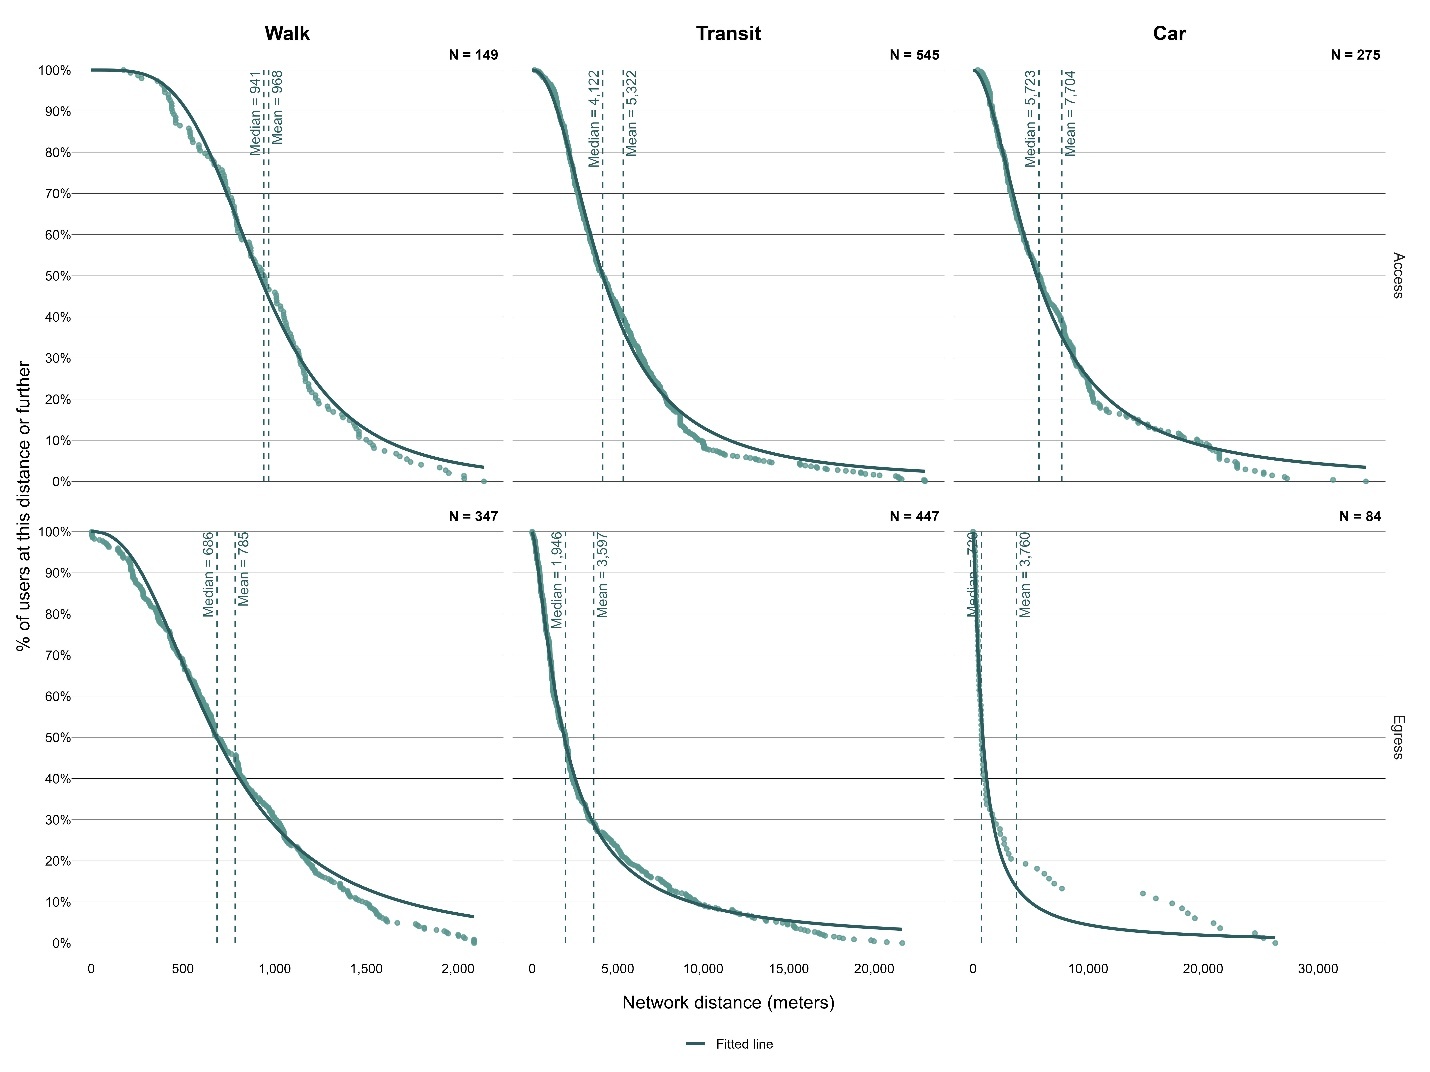
Access and egress distances are asymmetric. Across all three modes, users travel further on the home leg than the egress leg. Transit is the main connection for both ends, with 545 access and 447 egress observations (Table 1). Walking is more common on egress, while car is more common on access as the mode assignment assumes cars being more accessible on home legs. This pattern shows users are willing to travel further on the home side of the REM commute trips.
Our findings show that REM catchment areas are mode-specific, leg-specific, and vary across user groups. Walking remains the shortest feeder mode, and its 75th percentile distance reaches 1,167 meters for access and 1,062 meters for egress, with access distances longer than reported for commuter rail in Montréal, suburban light rail transit stations in Calgary, and metro in Beijing, ranging from 613 to 1102.84 meters (El-Geneidy et al. 2014; O’Sullivan and Morrall 1996; Wang et al. 2016). For users connected through public transit, the 75th percentile reaches 7,085 meters, which exceeds the 6,515 meters for bus stops in Beijing (Wang et al. 2016). The average is also longer than the 1.7 kilometers reported for rail-to-bus transfers in Seoul (Eom et al. 2019). And the access distance for car users is 7,704 meters, slightly shorter than 7.93 kilometers for the commuter train in Montréal (Vijayakumar et al. 2011) and below 9,214 for metro in Beijing (Wang et al. 2016). Additionally, the asymmetry between access and egress is consistent with Li et al. (2022), who showed differences in distance across modes between trip legs in the Nanjing Metro system.
The difference between REM and previously studied transit systems, such as bus, metro, and commuter rail, indicates that REM has a broader spatial reach, particularly for walking and transit feeder modes. The comparison between the REM and another LRT system further shows that these differences are not a feature of LRT systems generally. Instead, they more likely reflect REM’s role as a regional connector, suggesting both the direction and magnitude of these differences are context dependent. Our findings suggest that the identified catchment thresholds could serve as a planning reference while requiring professionals to adapt them to different urban contexts and indicate that fixed catchment assumptions may misestimate the actual catchment areas and true demand. Future work should test these patterns using additional waves of the MMS and other regional LRT systems to assess generalizability.
ACKNOWLEDGEMENTS
The authors would like to thank Daniel Schwartz and Yasser Kazma from McGill IT for their help with the survey administration as well as the Transportation Research at McGill (TRAM) members. This research was funded by Natural Sciences and Engineering Research Council of Canada (NSERC RGPIN-2023-03852), the Canadian Institute of Health Research (CIHR PJT-195797), and the Tier 1 Canada Research Chair in Public Transport Planning and Operation (CRC-2025-00098).
DATA AVAILABILITY
The data and code used in this study are available at https://github.com/TRAM-Transportation-Research-at-Mcgill/lrt-distance-decay.