
1. Questions
Citywide evidence on accessibility by bus remains limited for motorcycle-dominant Southeast Asian cities such as Hanoi (Vietnam). In 2018, before urban rail entered regular operation, buses were Hanoi’s main formal public transport mode, but everyday mobility was still dominated by motorcycles (JICA, 2020)[1]. Existing studies have more often examined transit-oriented development (JICA, 2022)[2], or access to transit, network complexity than the uneven distribution of bus accessibility to essential opportunities (Buczek et al. 2018; Phuong et al. 2024; Tran et al. 2019). This leaves limited understanding of whether bus-based accessibility disadvantage is generalised or opportunity-specific, and whether inequality mainly reflects an urban-rural divide or uneven access within these areas. Accordingly, this study asks two questions: (1) How does accessibility to opportunities vary across travel-time cut-offs and space in Hanoi? And (2) How unequal is this accessibility across the population and between/within urban and rural areas?
2. Methods
The analysis focused on 2018 because publicly available GTFS data for Hanoi were only available for that year. It used four open data sources for 2018: a Hanoi bus GTFS timetable from World Bank/TUMI[3], historical OpenStreetMap points of interest reconstructed with ohsome R package (Fritz 2023), WorldPop[4], administrative boundaries and road data from Open Development Mekong[5].
Accessibility is shaped not only by the bus network but also by the spatial distribution of opportunities (Geurs and van Wee 2004). Restricting the analysis to a single opportunity type would have missed this opportunity-specific variation. Therefore, nine opportunity types were included in this study: healthcare, education, retail and grocery, parks and public open space, sports facilities, cultural facilities, religious sites, food and beverage, and local government offices. Hanoi’s map and the spatial distribution of each opportunity type are presented in Supplementary Information (SI), Figs. SI.1 – SI.3.
Social and economic disparities between urban and rural areas in Vietnam are substantial (Hanoi Statistical Yearbook 2018[6]). To capture this structure at the appropriate resolution while remaining relevant for policy use, accessibility is calculated at a fine hexagonal resolution (i.e., H3 resolution-9 hexagon grid) to avoid the modifiable areal unit problem (Pereira 2019; Qu et al. 2025), then related to a broader, policy-relevant unit: the urban/rural classification used in Vietnam’s official statistics and planning system (Hanoi Statistical Yearbook 2018). As one of the first studies in Vietnam to analyze accessibility to opportunities by bus using validated public GTFS data, the author deliberately adopted this classification so that the results would be more accessible and usable by government officials and planners.
Travel times from each hexagon centroid to individual opportunities were calculated with r5r (Pereira et al. 2021), combining walking and bus, with up to two transfers and a maximum 15-minute walk per leg. Travel-time matrices were computed for every departure minute between 06:30 and 10:00 on a typical Tuesday, and the median door-to-door travel time was retained. The median was used as it provides an estimate of typical travel conditions across the departure-time window while reducing the influence of unusually short or long journeys caused by timetable variations (Pereira et al. 2021; Stępniak et al. 2019), consistent with common practice in the transit accessibility literature (Braga et al. 2023; Pönkänen et al. 2025).
Accessibility was then calculated from this representative origin-destination travel-time matrix. Place-based cumulative accessibility - the number of opportunities reachable within 15, 30 and 60 minutes - was used because it is policy-interpretable (El-Geneidy and Levinson 2022; Levinson and King 2020). Because cumulative measures are sensitive to the chosen threshold, relying on a single cut-off risks conclusions that reflect an arbitrary travel-time assumption (Levinson and King 2020). The 15-, 30- and 60-minute cut-offs therefore represent progressively wider short-, medium- and extended travel-time budgets, allowing us to test whether spatial disadvantage persists as the feasible travel range expands.
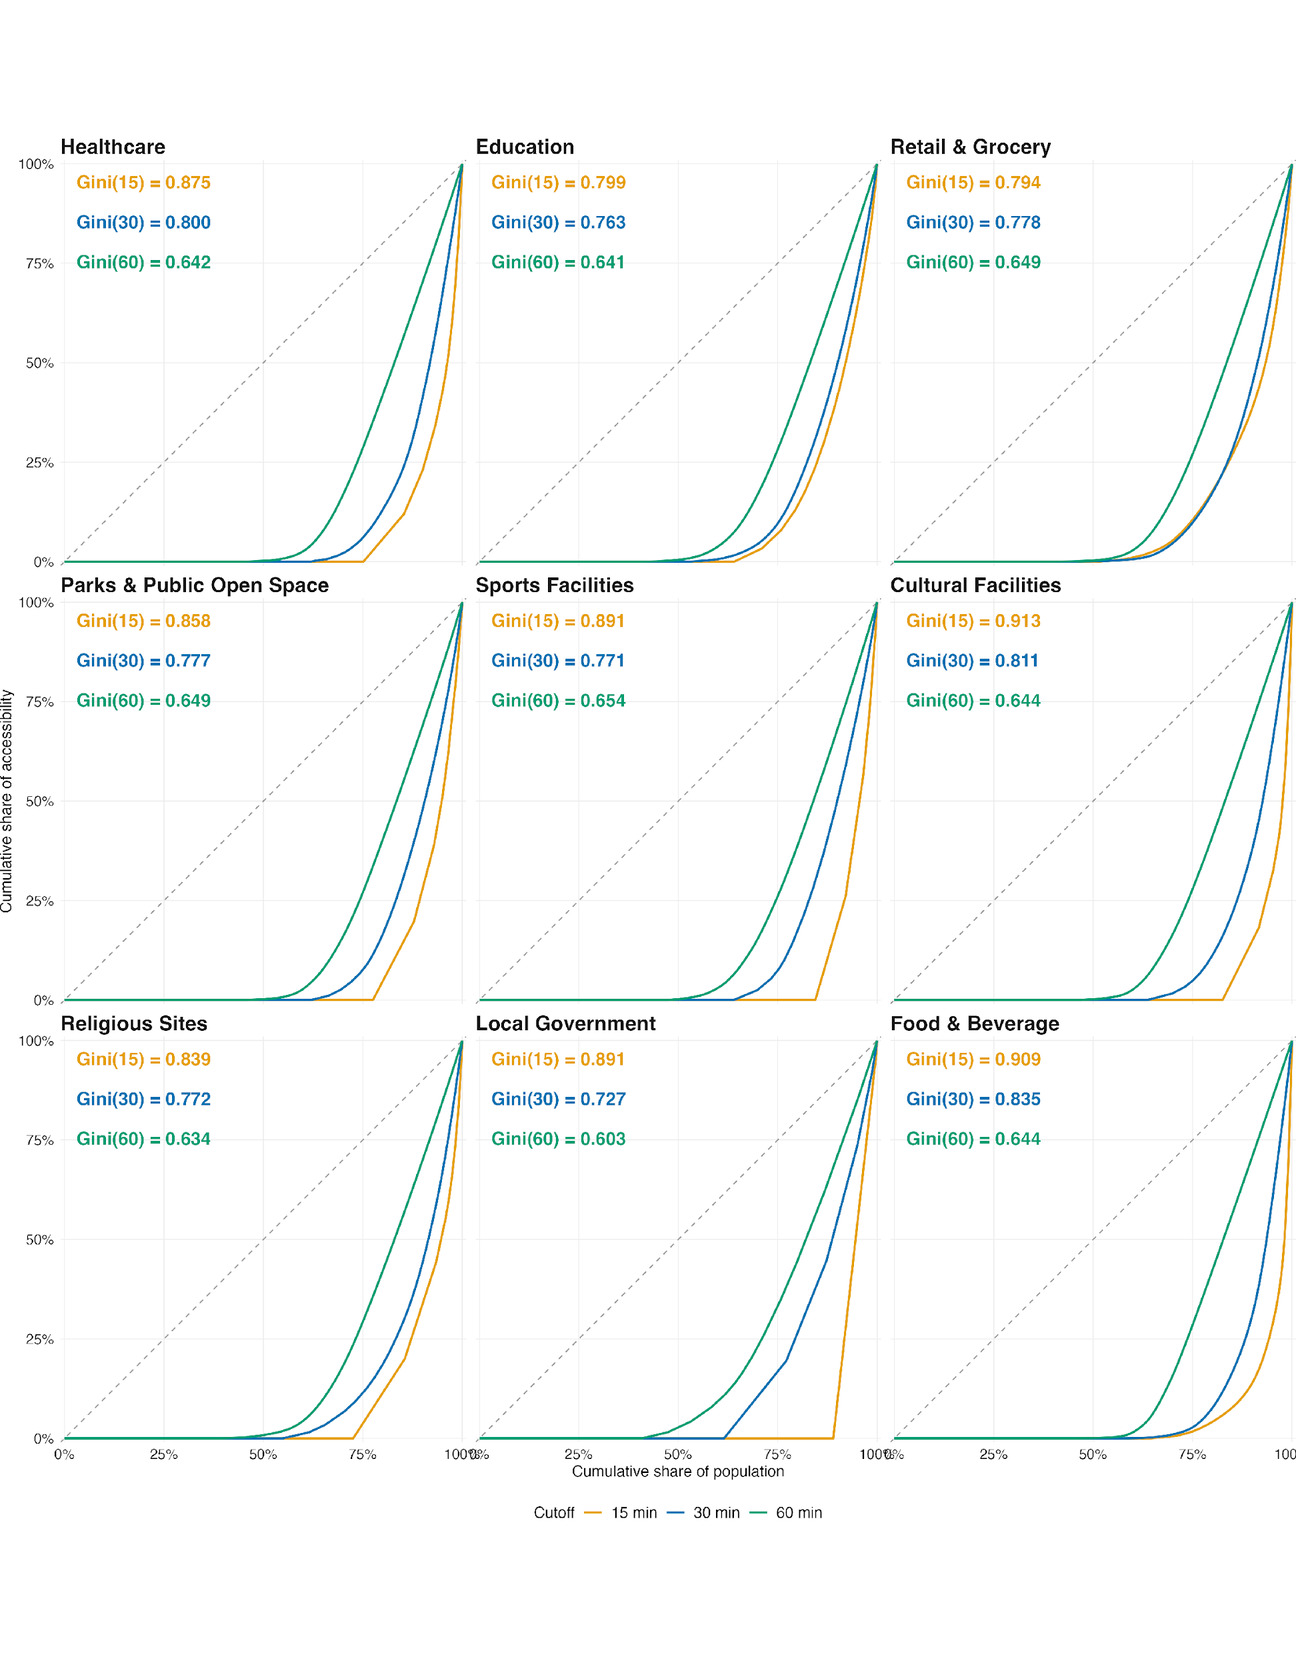
Inequality was assessed using population-weighted empirical cumulative distribution functions, Lorenz curves, and Gini coefficients, which describe the overall distribution of accessibility across the population (Delbosc and Currie 2011). To address whether this inequality mainly reflects disparity between urban and rural areas or disparity within these areas, Theil T decomposition (Jin et al. 2022) was additionally applied, separating total inequality into between-area and within-area components.
3. Findings
Accessibility was low citywide and sharply structured by Hanoi’s core-periphery geography. The urban area accounted for a small share of land and but had much higher bus stop density, network density, service frequency and opportunity density than the rural districts. In the 2018 data, urban stop density was 13.31 stops/km2, compared with 0.76 in rural areas; average headway was also shorter in urban areas, at 16.9 minutes compared with 24.7 minutes (Table SI.1).
Table 1 shows that expanding the threshold from 15 to 60 minutes improved access but did not remove exclusion. At 15 minutes, at citywide, coverage ranged from 1.8% (sports facilities) to 13.1% (retail and grocery), depending on opportunity type. Even at 60 minutes, citywide coverage ranged from only 14.8% (sports facilities) to 29.1% (retail and grocery). Urban coverage was much higher: by 60 minutes, more than three-quarters of urban hexagons had access to each opportunity type. Rural coverage remained much weaker, peaking at 23.9% for retail and grocery and falling below 10% for sports, cultural, and park/open-space opportunities.
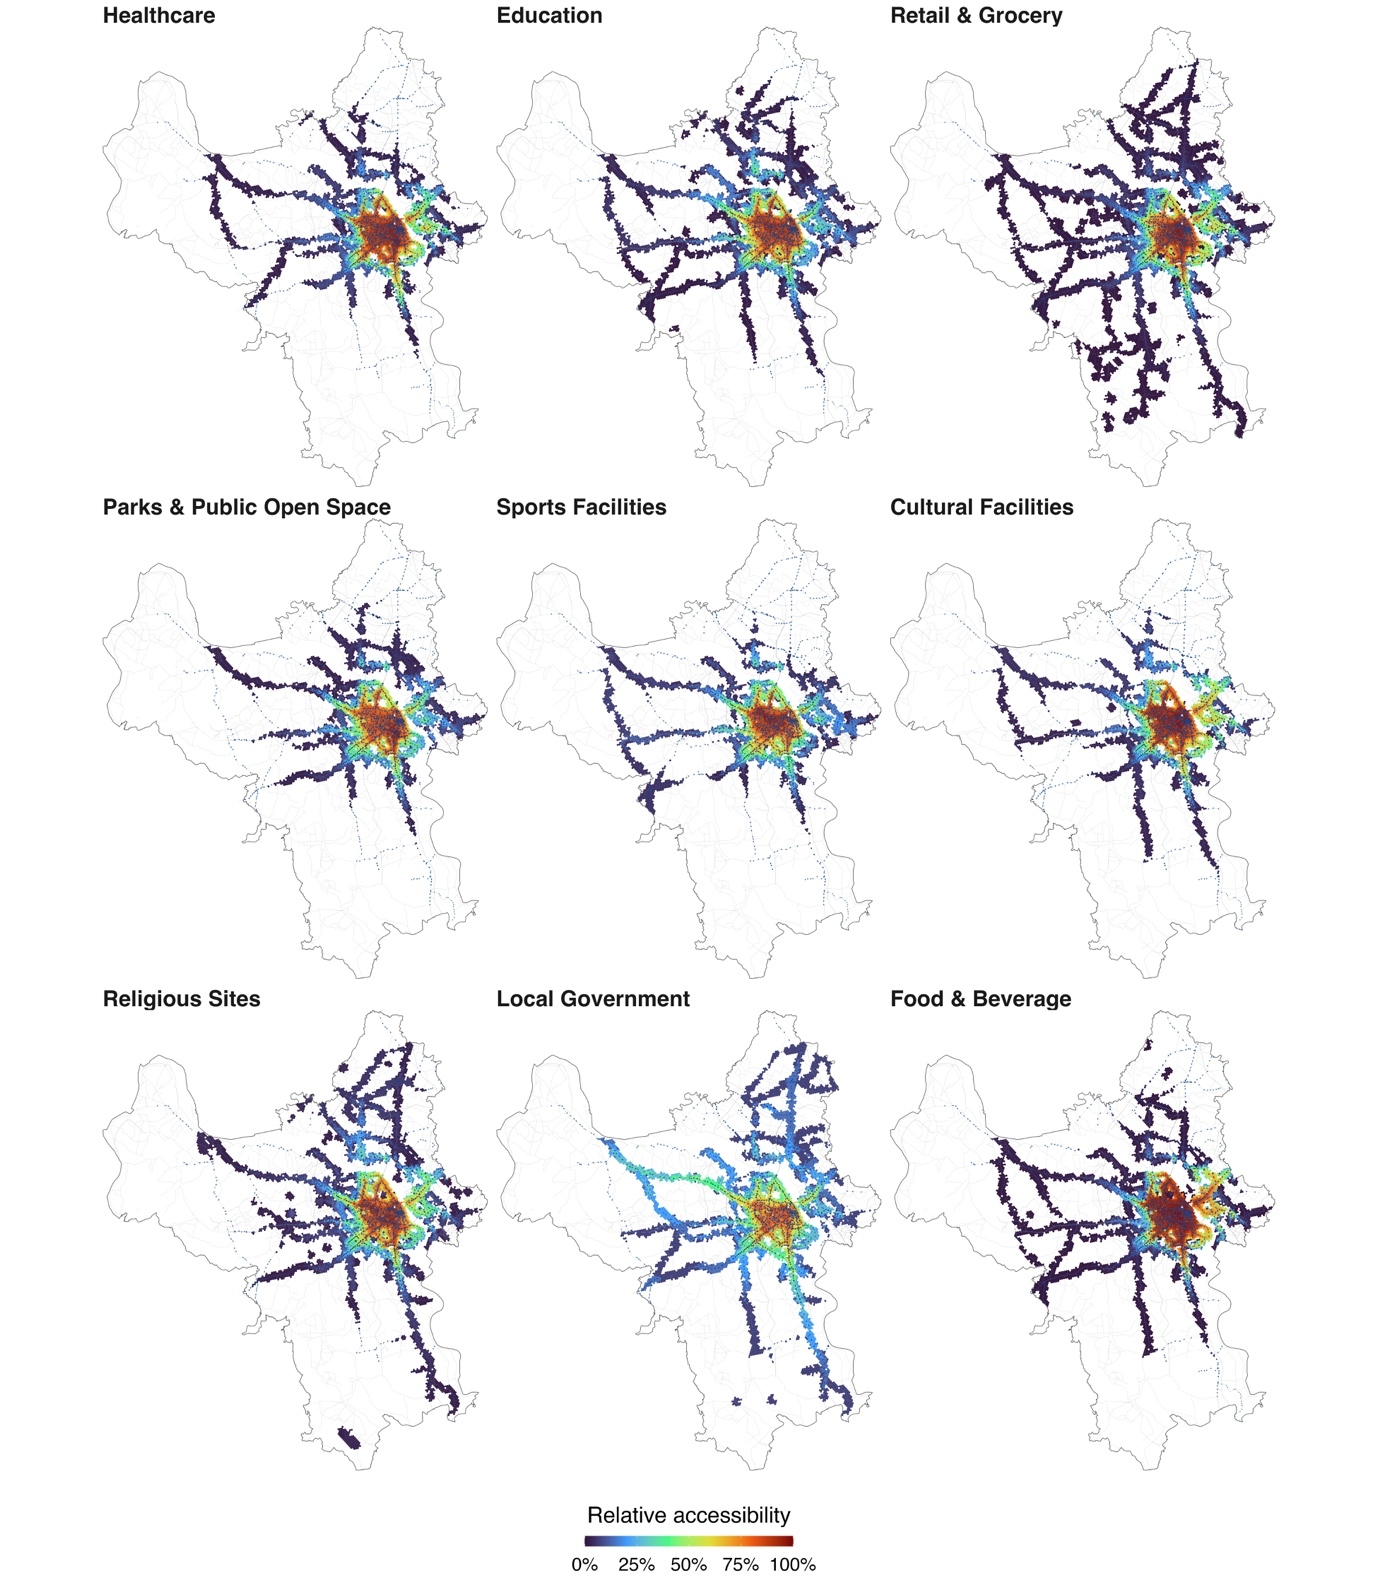
The spatial pattern was not simply low access everywhere. Figure 1 shows a corridor-based geography in which accessibility was highest in the inner urban core and along major bus corridors, while large peripheral and rural areas had little reachable access even at 60 minutes. Retail and grocery, and food and beverage opportunities expanded most clearly along the network, whereas sports, cultural, and open-space opportunities remained more concentrated.
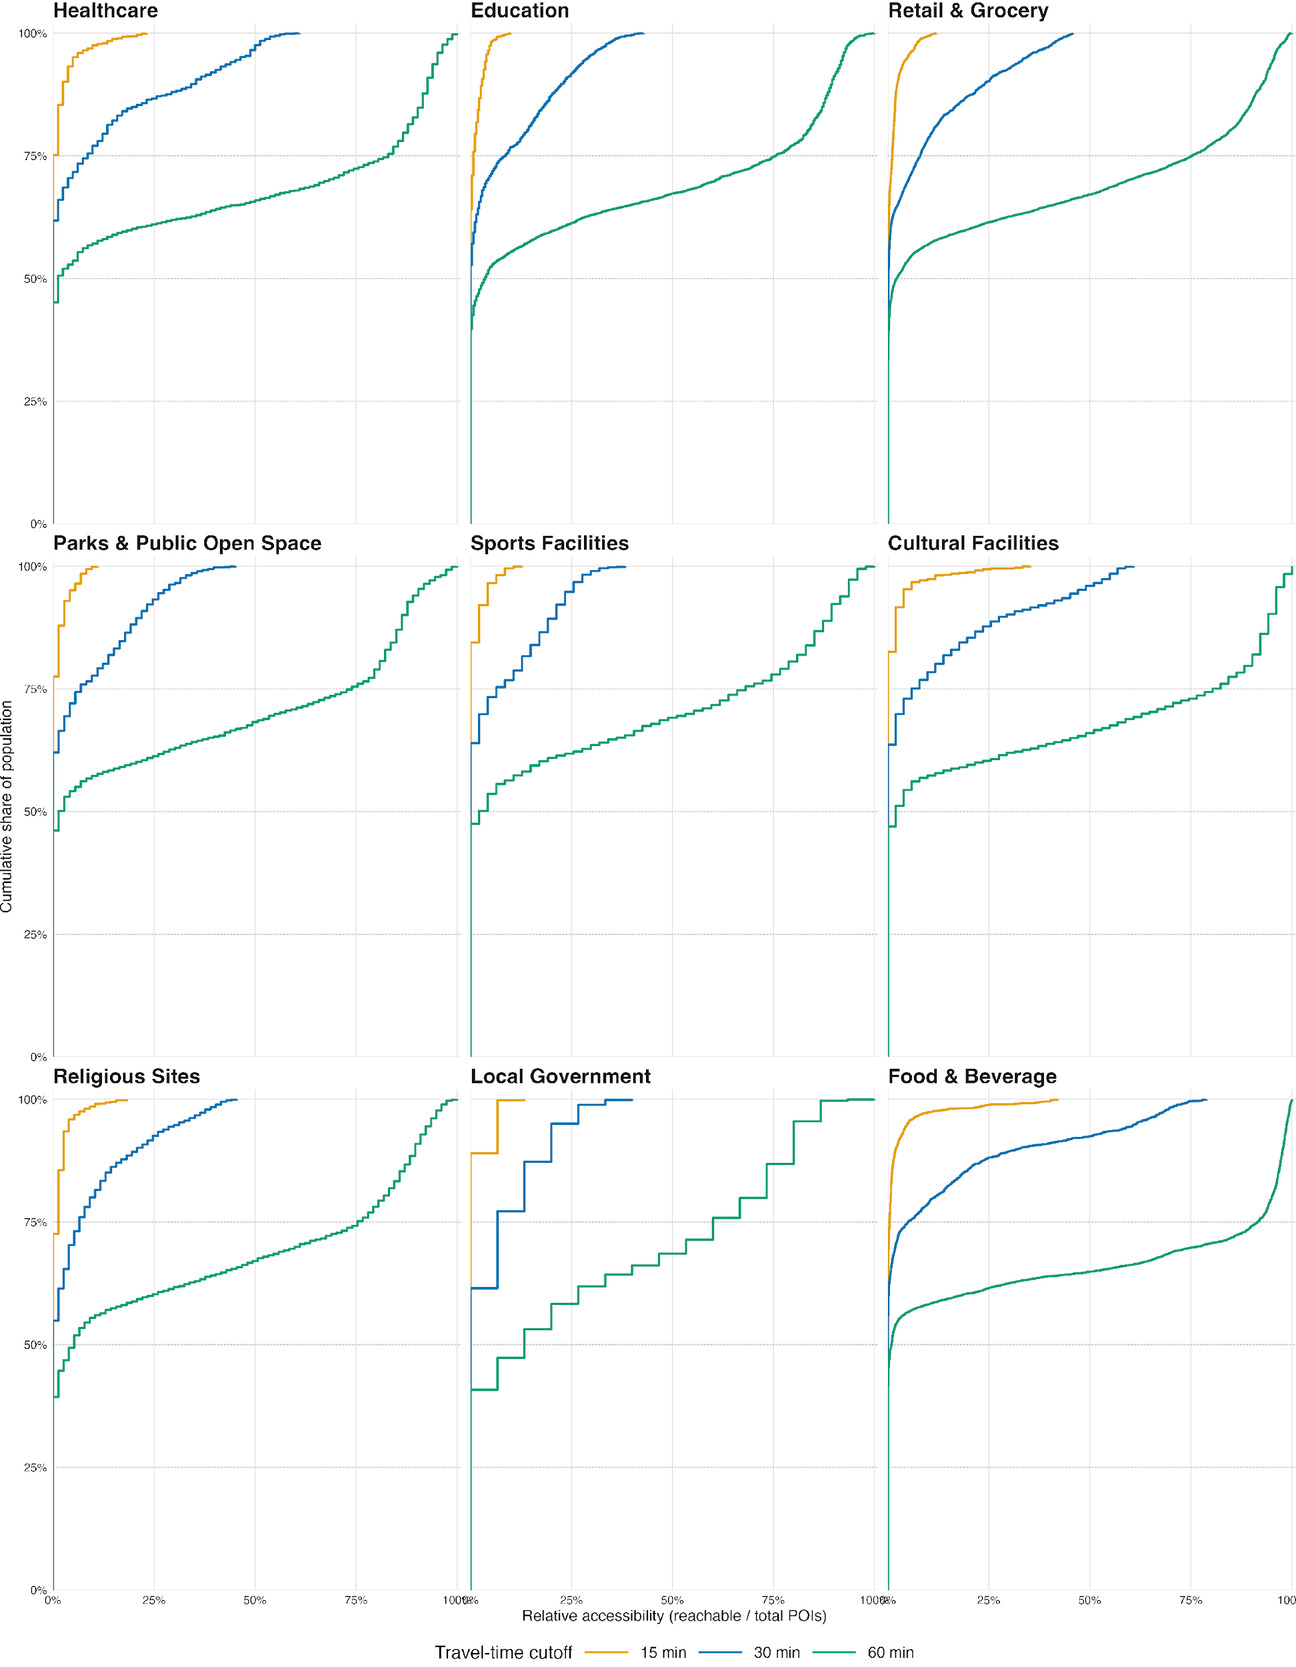
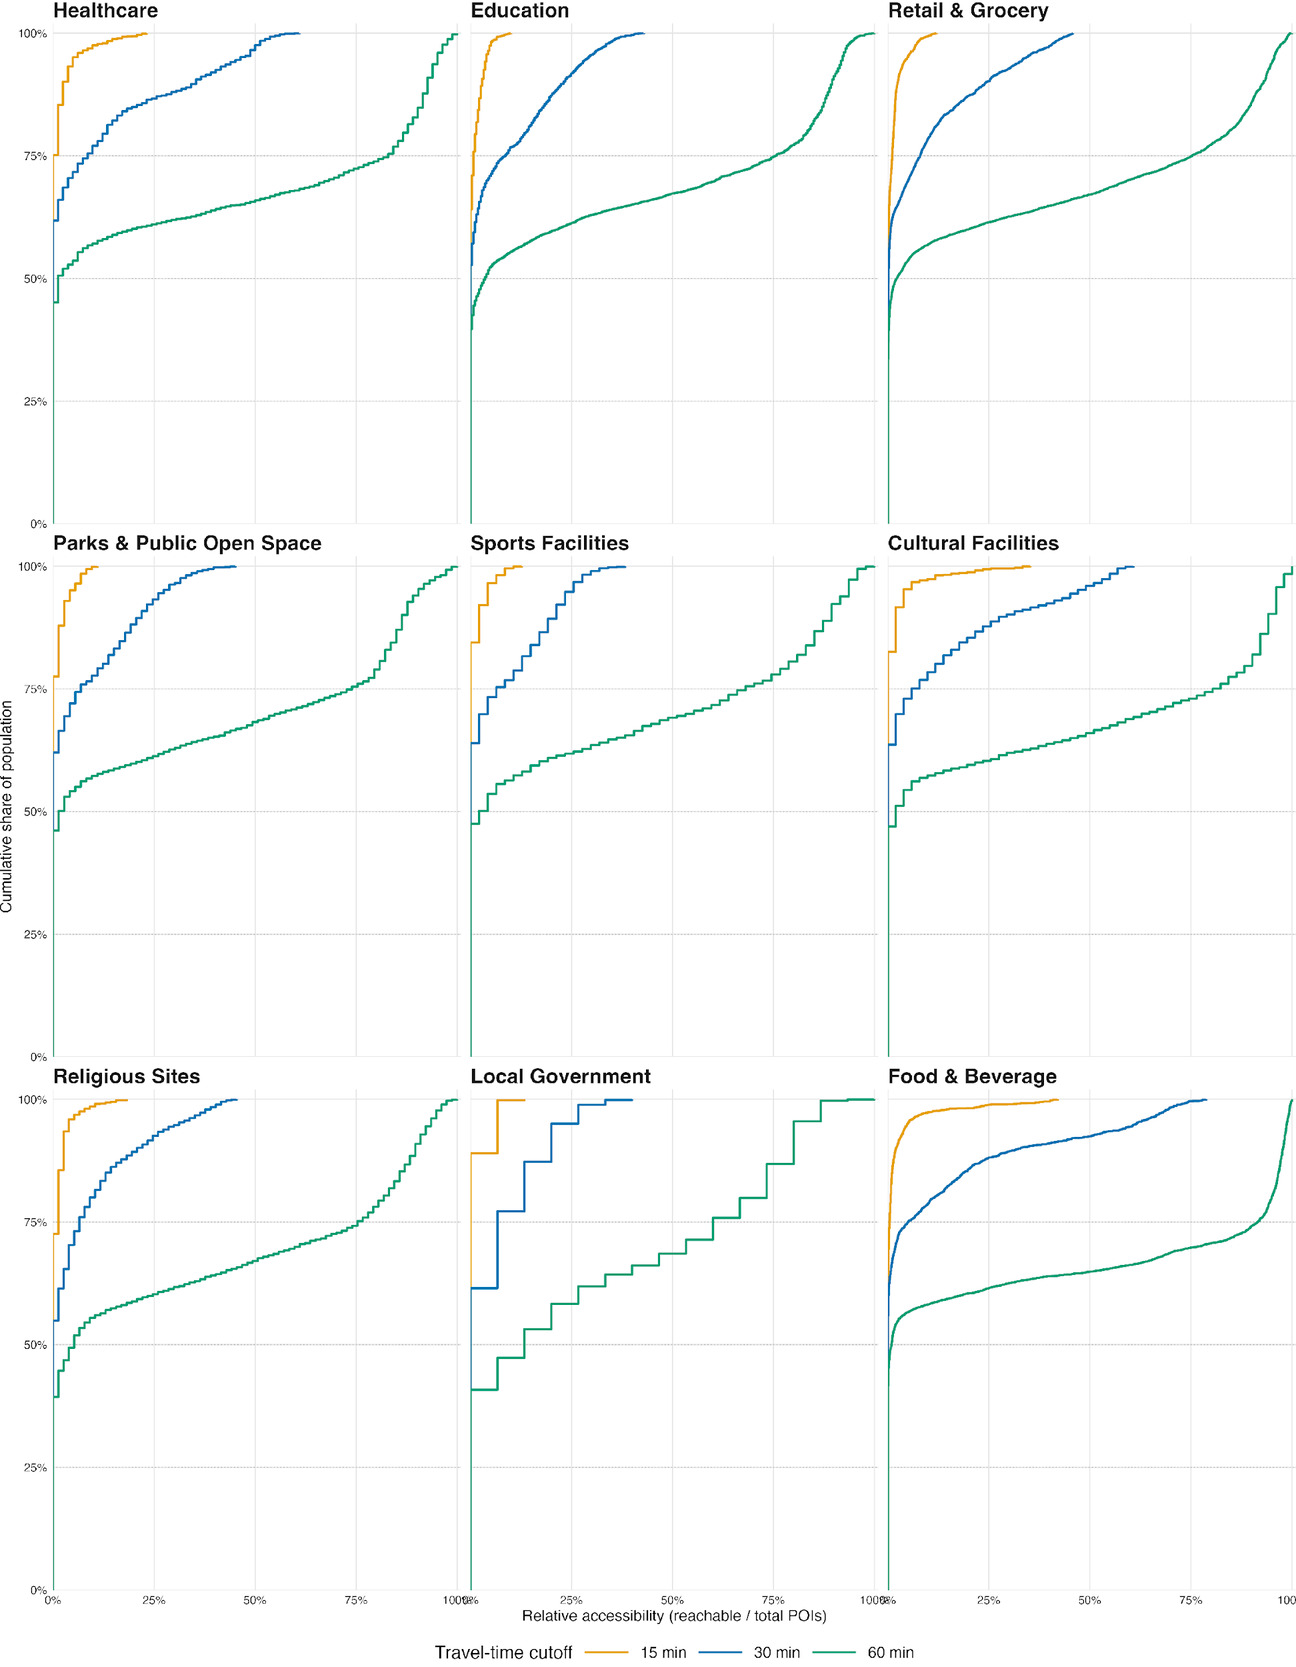
Population-weighted distributions confirmed that most residents were concentrated at low accessibility levels (Figure 2). Taking cultural facilities as an example, 82.5% of the population had zero accessibility at 15 minutes, 63.6% at 30 minutes and 47.0% at 60 minutes. At the 60-minute threshold, 60.3% of residents could still reach no more than 25% of cultural facilities. Similar left-skewed distributions appeared across opportunity types.
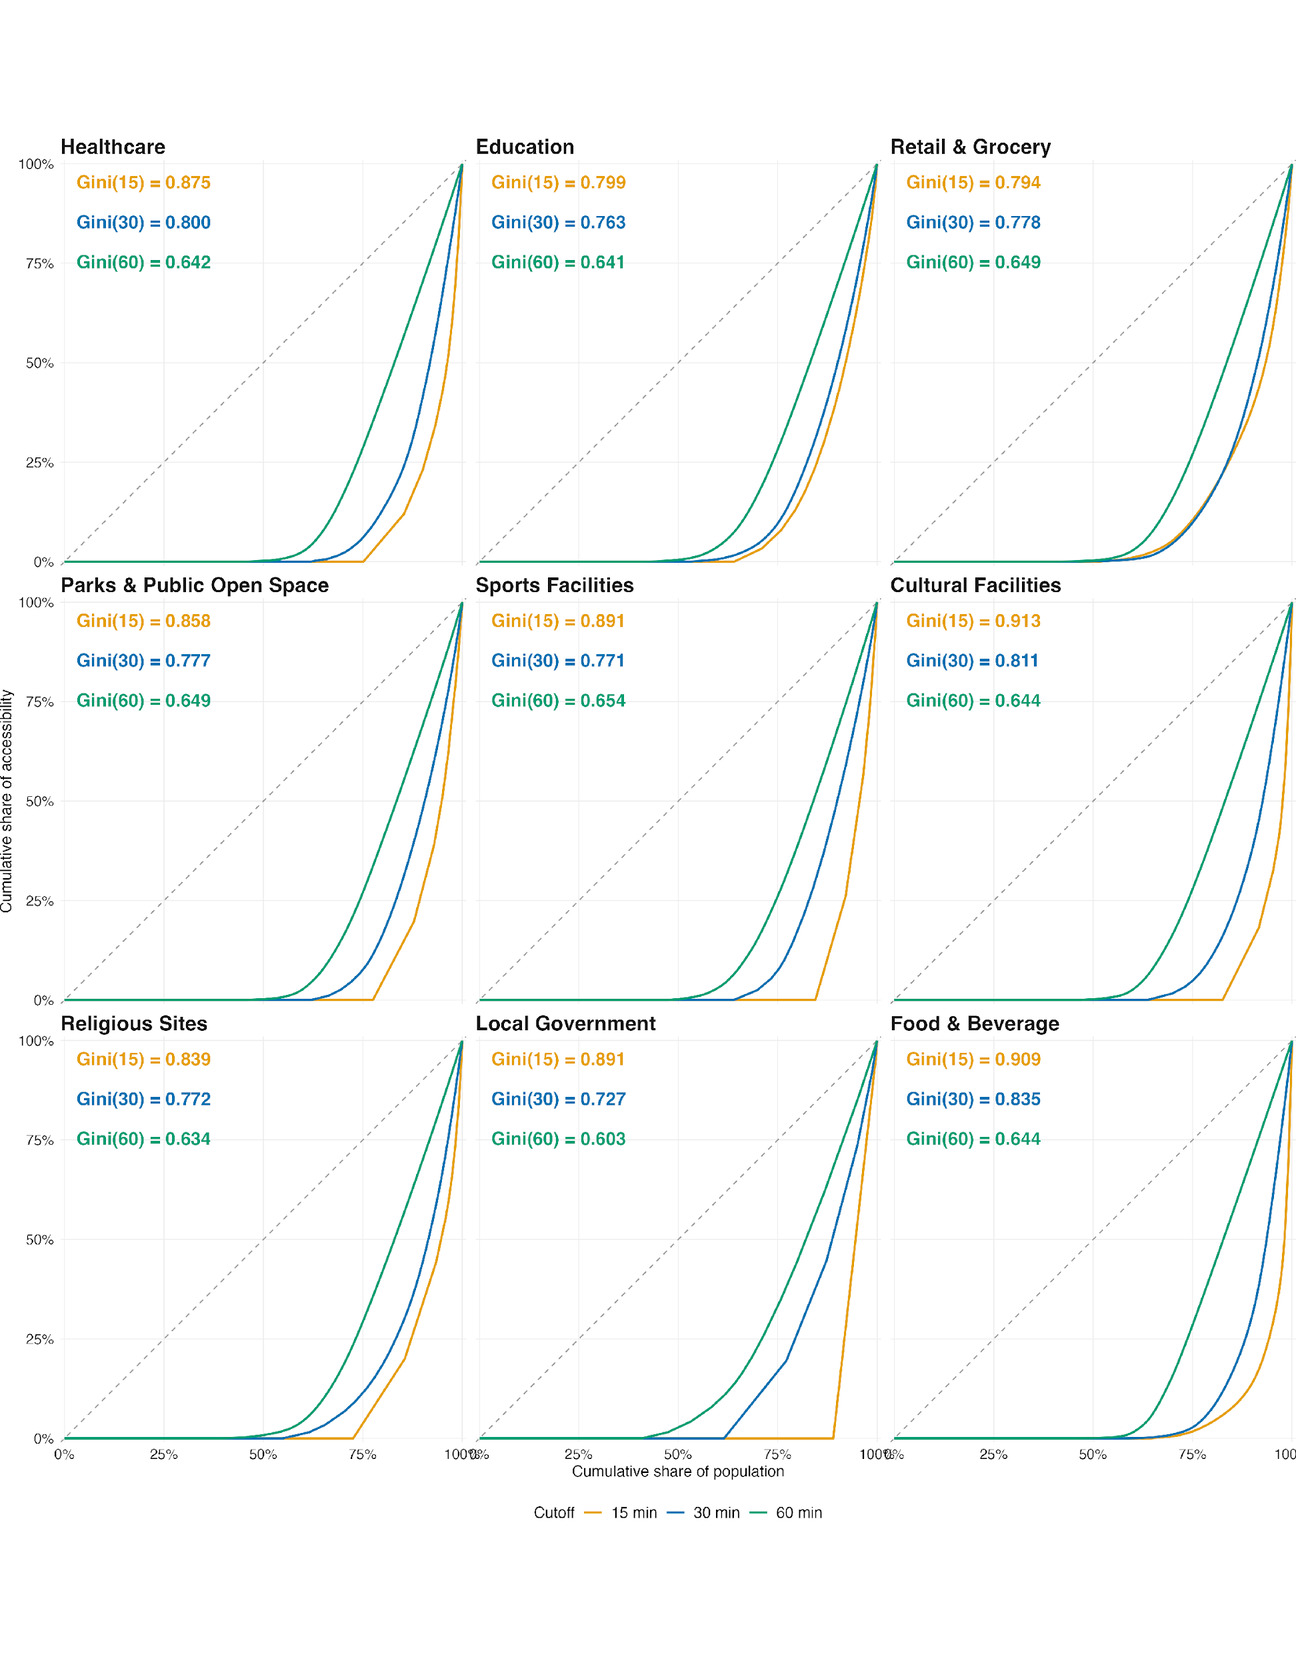
The Lorenz curves and Gini coefficients show persistent inequality (Figure 3). Gini values were highest at 15 minutes (e.g., reaching 0.913 for cultural facilities), and remained high at 60 minutes, with values around 0.603 to 0.654 across opportunity types.
Theil decomposition further showed that accessibility inequality was not only an urban-rural divide. Across travel-time cut-offs, the between-group component increased for all opportunities, suggesting a stronger urban-rural contribution at wider cutoffs. However, within-group inequality remained important: urban areas generally showed higher internal inequality at 15 and 30 minutes, while rural areas became consistently higher at 60 minutes. These results suggest that Hanoi’s bus accessibility inequality reflects both territorial disparity and uneven access within urban and rural areas (see Table SI.4.).
Acknowledgement
The author sincerely thanks the reviewers for their valuable comments and suggestions, which helped improve this manuscript. The proposed article image uses “Hanoi Bus 09.jpg” by Vanhoabui, available via Wikimedia Commons (https://commons.wikimedia.org/w/index.php?curid=53273375), licensed under the Creative Commons Attribution-ShareAlike 4.0 International licence (CC BY-SA 4.0: https://creativecommons.org/licenses/by-sa/4.0/).
AI use
Portions of this work were revised for language clarity by ChatGPT. All revised content was thoroughly reviewed and validated by the author.
Data And Code Availability
The data and code used in this study are publicly available at: https://github.com/LinhLTP/Uneven-Accessibility-Services