
1. Questions
Surveys with hypothetical questions about what a respondent would do (or would have done) are common and powerful tools in transportation research. But they usually neglect respondent uncertainty, requiring selection of a single most-likely alternative, or sometimes offering a multi-select response format. In this paper we explore an alternative approach, Elicited Choice Probability (ECP), which allows respondents to explicitly report uncertain behaviour in hypothetical scenarios, either as a level of certainty or as a distribution of probabilities across alternatives (Manski 2004; Pedersen et al. 2020). ECP methods are not often used in transportation, but have the advantages of acknowledging respondent uncertainty and enabling explicit accounting for that uncertainty in subsequent analysis (Blass et al. 2010).
The aim of this paper is to determine whether ECP survey data provide substantively different information than simpler single-choice or multi-choice data in a transportation context. We seek to determine: 1) the extent to which respondents avail themselves of the opportunity to report multiple possible alternatives, 2) the relative magnitude of reported likelihoods across alternatives within each response, and 3) whether the different response formats generate substantively different aggregate probabilities across alternatives. We also address the question of 4) whether the reporting of uncertain behaviour varies systematically with personal attributes of the respondents.
2. Methods
We analyze survey data with ECP response formats for hypothetical behaviour with respect to e-bike purchase decisions and travel mode substitution for e-bike trips. The data come from two recent studies of e-bike purchase rebates in British Columbia, Canada (Bigazzi et al. 2025; Polikakhina et al. 2025). The survey instrument in those studies asked respondents to report what they would have done if the rebate had not been available (4 alternatives: purchased the same e-bike, a different e-bike, a conventional bike, or no bike at all), and for several recent e-bike trips to report what mode they would have taken if they had not purchased the e-bike (7 alternatives: walk, conventional bike, other e-bike, automobile, transit, other mode, or not travelled). For each question, respondents were asked to provide a probability for each alternative using a slider from 0% to 100% (at 20% intervals to reduce response burden based on feedback during pilot testing), and instructed that the probabilities should sum to 100% across the alternatives (although that condition was not enforced).
After the initial data cleaning process, each response was scaled to sum to 100% over all alternatives, if necessary (those responses were retained to avoid systematically excluding less-certain respondents). Single-choice responses were simulated as the highest-likelihood alternative reported in each response (randomly assigned if tied); multi-choice responses were simulated as all alternatives reported with non-zero probability. Aggregate average likelihoods for the simulated data were computed using 100% for single-choice data and equal probabilities for multi-choice data. We estimated binary logit models for whether respondents indicated more than one alternative, using personal attributes as independent variables to investigate patterns in reporting of uncertainty.
3. Findings
From a total cleaned sample of 1,169 respondents, 1,117 (96%) reported alternative purchase behaviour and 1,042 (89%) reported alternative travel mode data for e-bike trips. The total number of reported trips with alternative mode data was 3,988, ranging from 1 to 9 per person (up to 3 over each of 3 survey waves), with an average of 3.8 reported trips per person. The sample was 51% men (exclusive), with an average age of 49 y, 81% with post-secondary education, and 17% non-white (see previous papers for details).
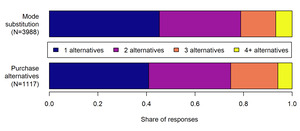
Figure 1 shows how many alternatives were reported with non-zero probability for each question type. Most respondents reported uncertain behaviour with multiple possible alternatives, slightly less for mode substitution (55%) than purchase decisions (59%). The average raw (unscaled) sum of likelihoods across alternatives was 115% for purchase alternatives and 120% for mode substitution. The scaling correction (to 100%) was applied for 45% of purchase alternative responses and 31% of mode substitution responses. After scaling, the average likelihood of the most-likely alternative among all responses was around 77% for both questions, and the average difference between the first and second most likely alternatives was around 60% (i.e., the central tendency was an 80%/20% probability split). Around 20% of respondents reported no dominant alternative (with more than 50% scaled probability) for each question.
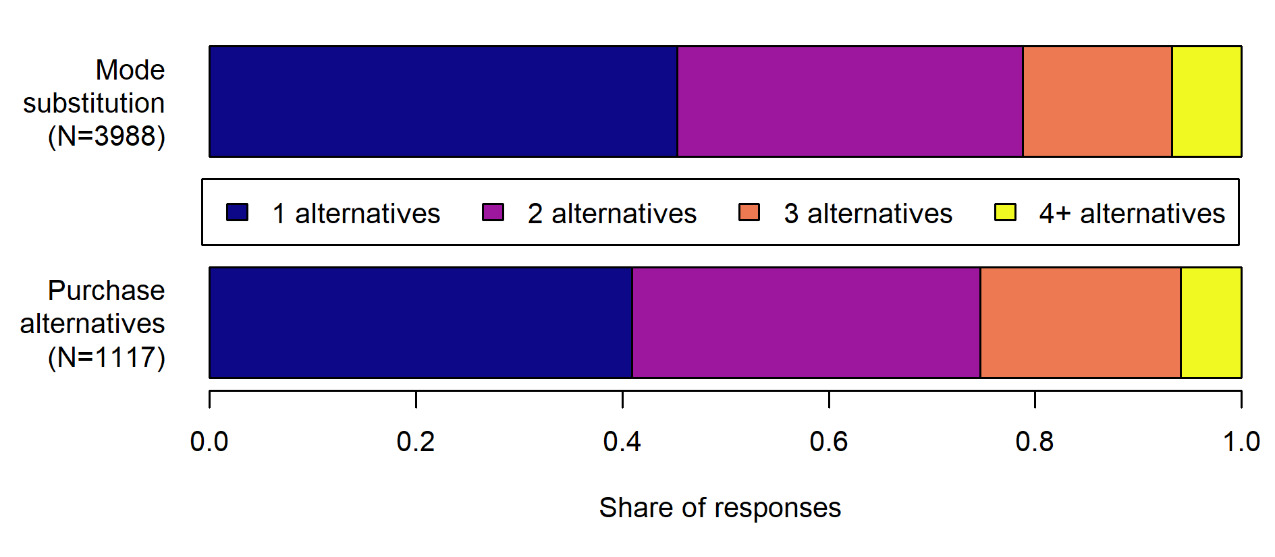
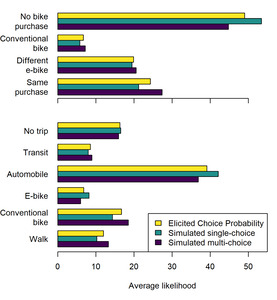
Figure 2 compares aggregate likelihoods from the ECP data versus simulated single-choice and multi-choice data. The patterns are mostly consistent across response formats, with similar ordering of alternatives. Aggregate likelihoods are within 4.4 percentage points of the ECP values based on single- or multi-choice response data (factor differences range from 0.86 to 1.13). Simulated single-choice data tend to over-represent the likelihoods of the more-certain (and overall more likely) alternatives and under-represent the likelihoods of the less-certain (and overall less likely) alternatives, while simulated multi-choice data do the opposite. E-bike mode substitution is over-represented by single-choice data because although most respondents excluded it from their set of potential alternatives, respondents who did include it assigned it a high likelihood (i.e., high certainty).
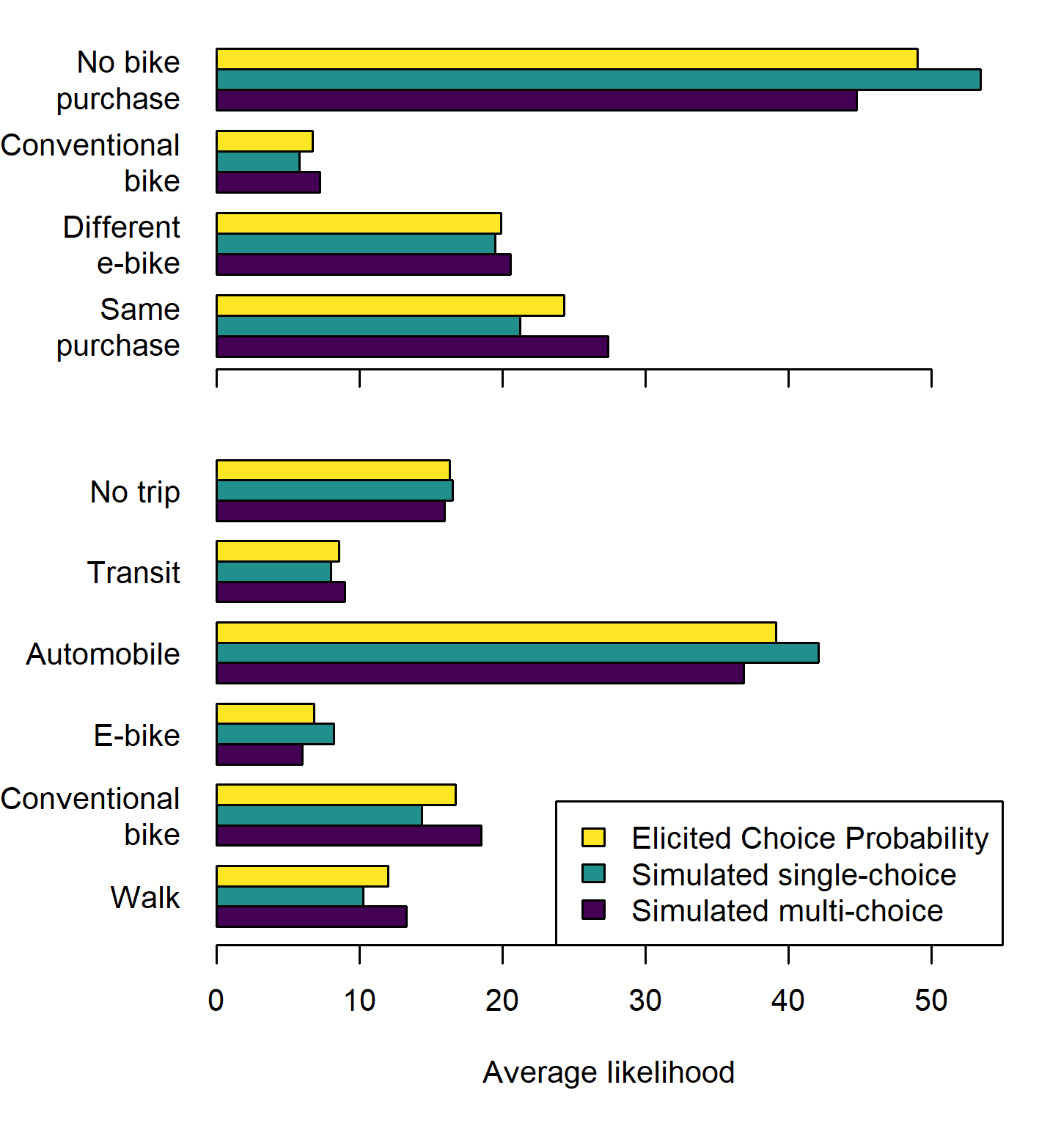
Table 1 shows which respondents were more likely to report uncertain hypothetical behaviour using estimated binary logit models for whether the respondent indicated more than one alternative. The relationships are weak overall, with the only significant effects (at a 95% confidence level) being that men and people in high-income households were more likely to report uncertain mode substitution. These patterns likely reflect a combination of uncertainty in their behaviour and propensity to report that uncertainty.
To summarize, when given the option, a majority of survey respondents report uncertain hypothetical behaviour in two transportation-related scenarios: incentivized vehicle purchases and travel mode selection. However, most respondents have a strong leading alternative, averaging around 80% likelihood. The reporting of uncertainty does not significantly relate to equity-related personal attributes in this context. Providing single-choice response options neglects respondent uncertainty and distorts aggregate likelihoods toward the more-certain alternatives, while providing multi-choice response options flattens the uncertainty and distorts aggregate likelihoods toward the less-certain alternatives. The relatively small aggregate likelihood distortions observed here may be acceptable, considering the increased response burden created by ECP questions. But analysts should consider the implications of bias toward more-certain alternatives, which may not necessarily be those with higher overall likelihood (e.g., e-bike mode substitution). Study priorities that might warrant the collection of ECP data include a focus on respondent uncertainty or low-probability choices. If ECP data are collected, instrument designers must weigh data reliability and response burden when determining factors such as number of alternatives, reporting precision, and forced response validation. Further research is required to address the separate issue of the internal validity of self-reported likelihoods for hypothetical transportation choices.
Acknowledgements
We would like to acknowledge the valuable input of the study participants, as well as those who contributed to the data collection and processing, particularly Polina Polikakhina. We also acknowledge funding support for data collection from the Natural Sciences and Engineering Research Council of Canada, District of Saanich, and British Columbia Ministry of Transportation and Transit.