This website uses cookies

We use cookies to enhance your experience and support COUNTER Metrics for transparent reporting of readership statistics. Cookie data is not sold to third parties or used for marketing purposes.

Skip to main content
null
Findings
  • Menu
  • Articles
    • Energy Findings
    • Resilience Findings
    • Safety Findings
    • Transport Findings
    • Urban Findings
    • All
  • For Authors
  • Editorial Board
  • About
  • Blog
  • search
  • X (formerly Twitter) (opens in a new tab)
  • LinkedIn (opens in a new tab)
  • RSS feed (opens a modal with a link to feed)

RSS Feed

Enter the URL below into your favorite RSS reader.

https://findingspress.org/feed
ISSN 2652-8800
Transport Findings
July 31, 2026 AEST

Who Cycles in Winter? Seasonal Cycling and Mode Share Change in Northern Sweden

Jonas Westin, Ph.D., Per Åhag, Ph.D.,
winter cyclingmode choiceseasonal travel behaviorgender differencestrip purposeNorthern Swedenmultinomial logit
Copyright Logoccby-sa-4.0 • https://doi.org/10.32866/001c.165263
Findings
Westin, Jonas, and Per Åhag. 2026. “Who Cycles in Winter? Seasonal Cycling and Mode Share Change in Northern Sweden.” Findings, July 30. https://doi.org/10.32866/001c.165263.
Save article as...▾
Download all (2)
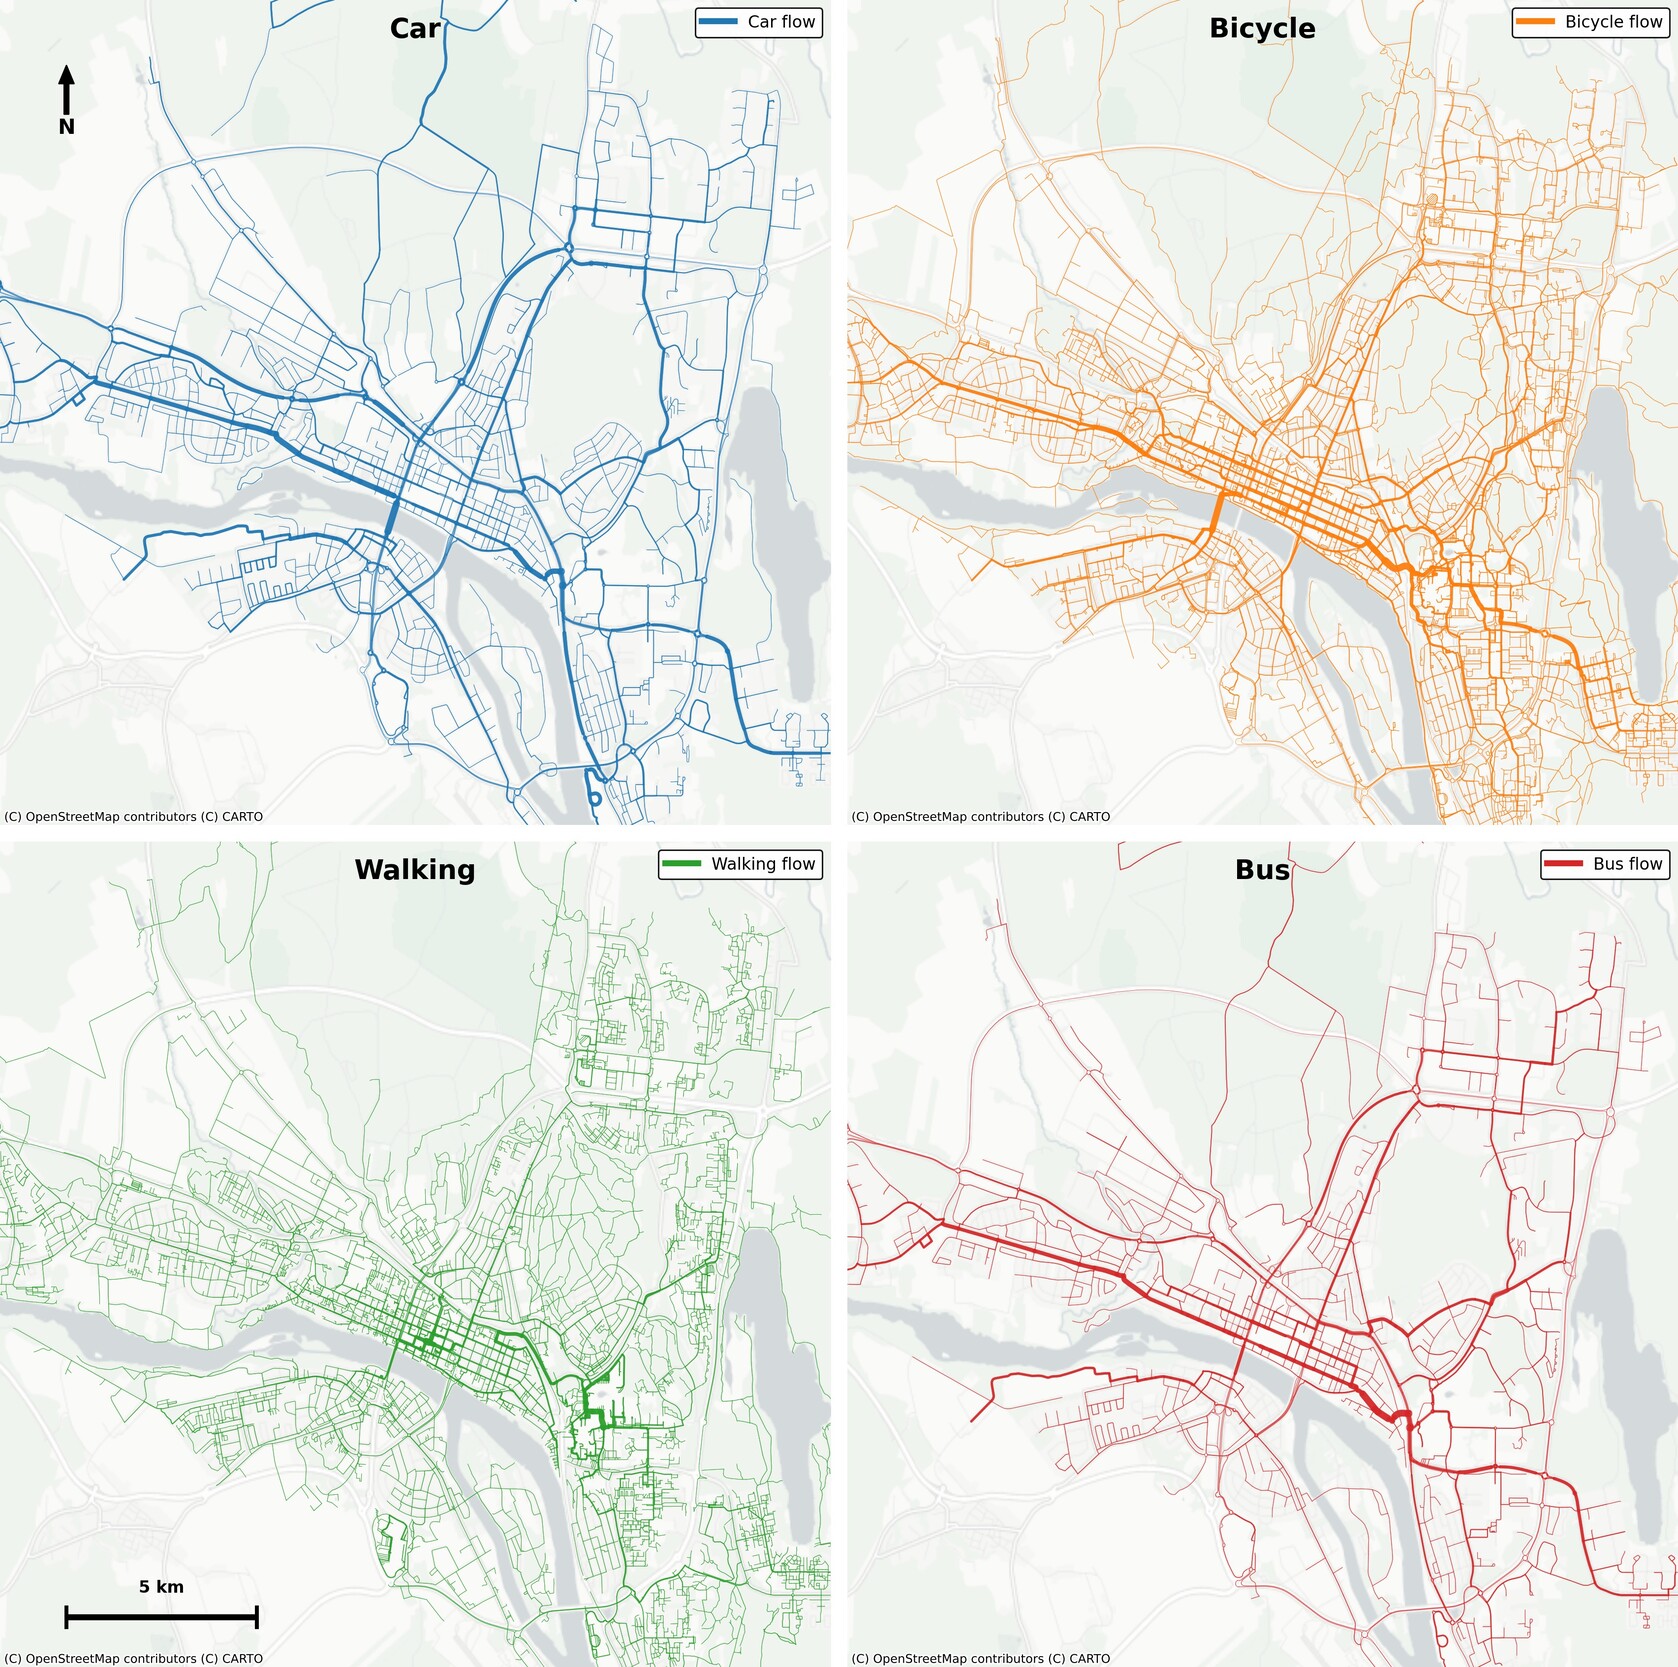
  • Figure 1. Spatial coverage of trips by travel mode in the Umeå urban area. Lines show estimated OpenStreetMap shortest paths between observed trip start and end points and illustrate survey coverage, not actual routes.
    Download
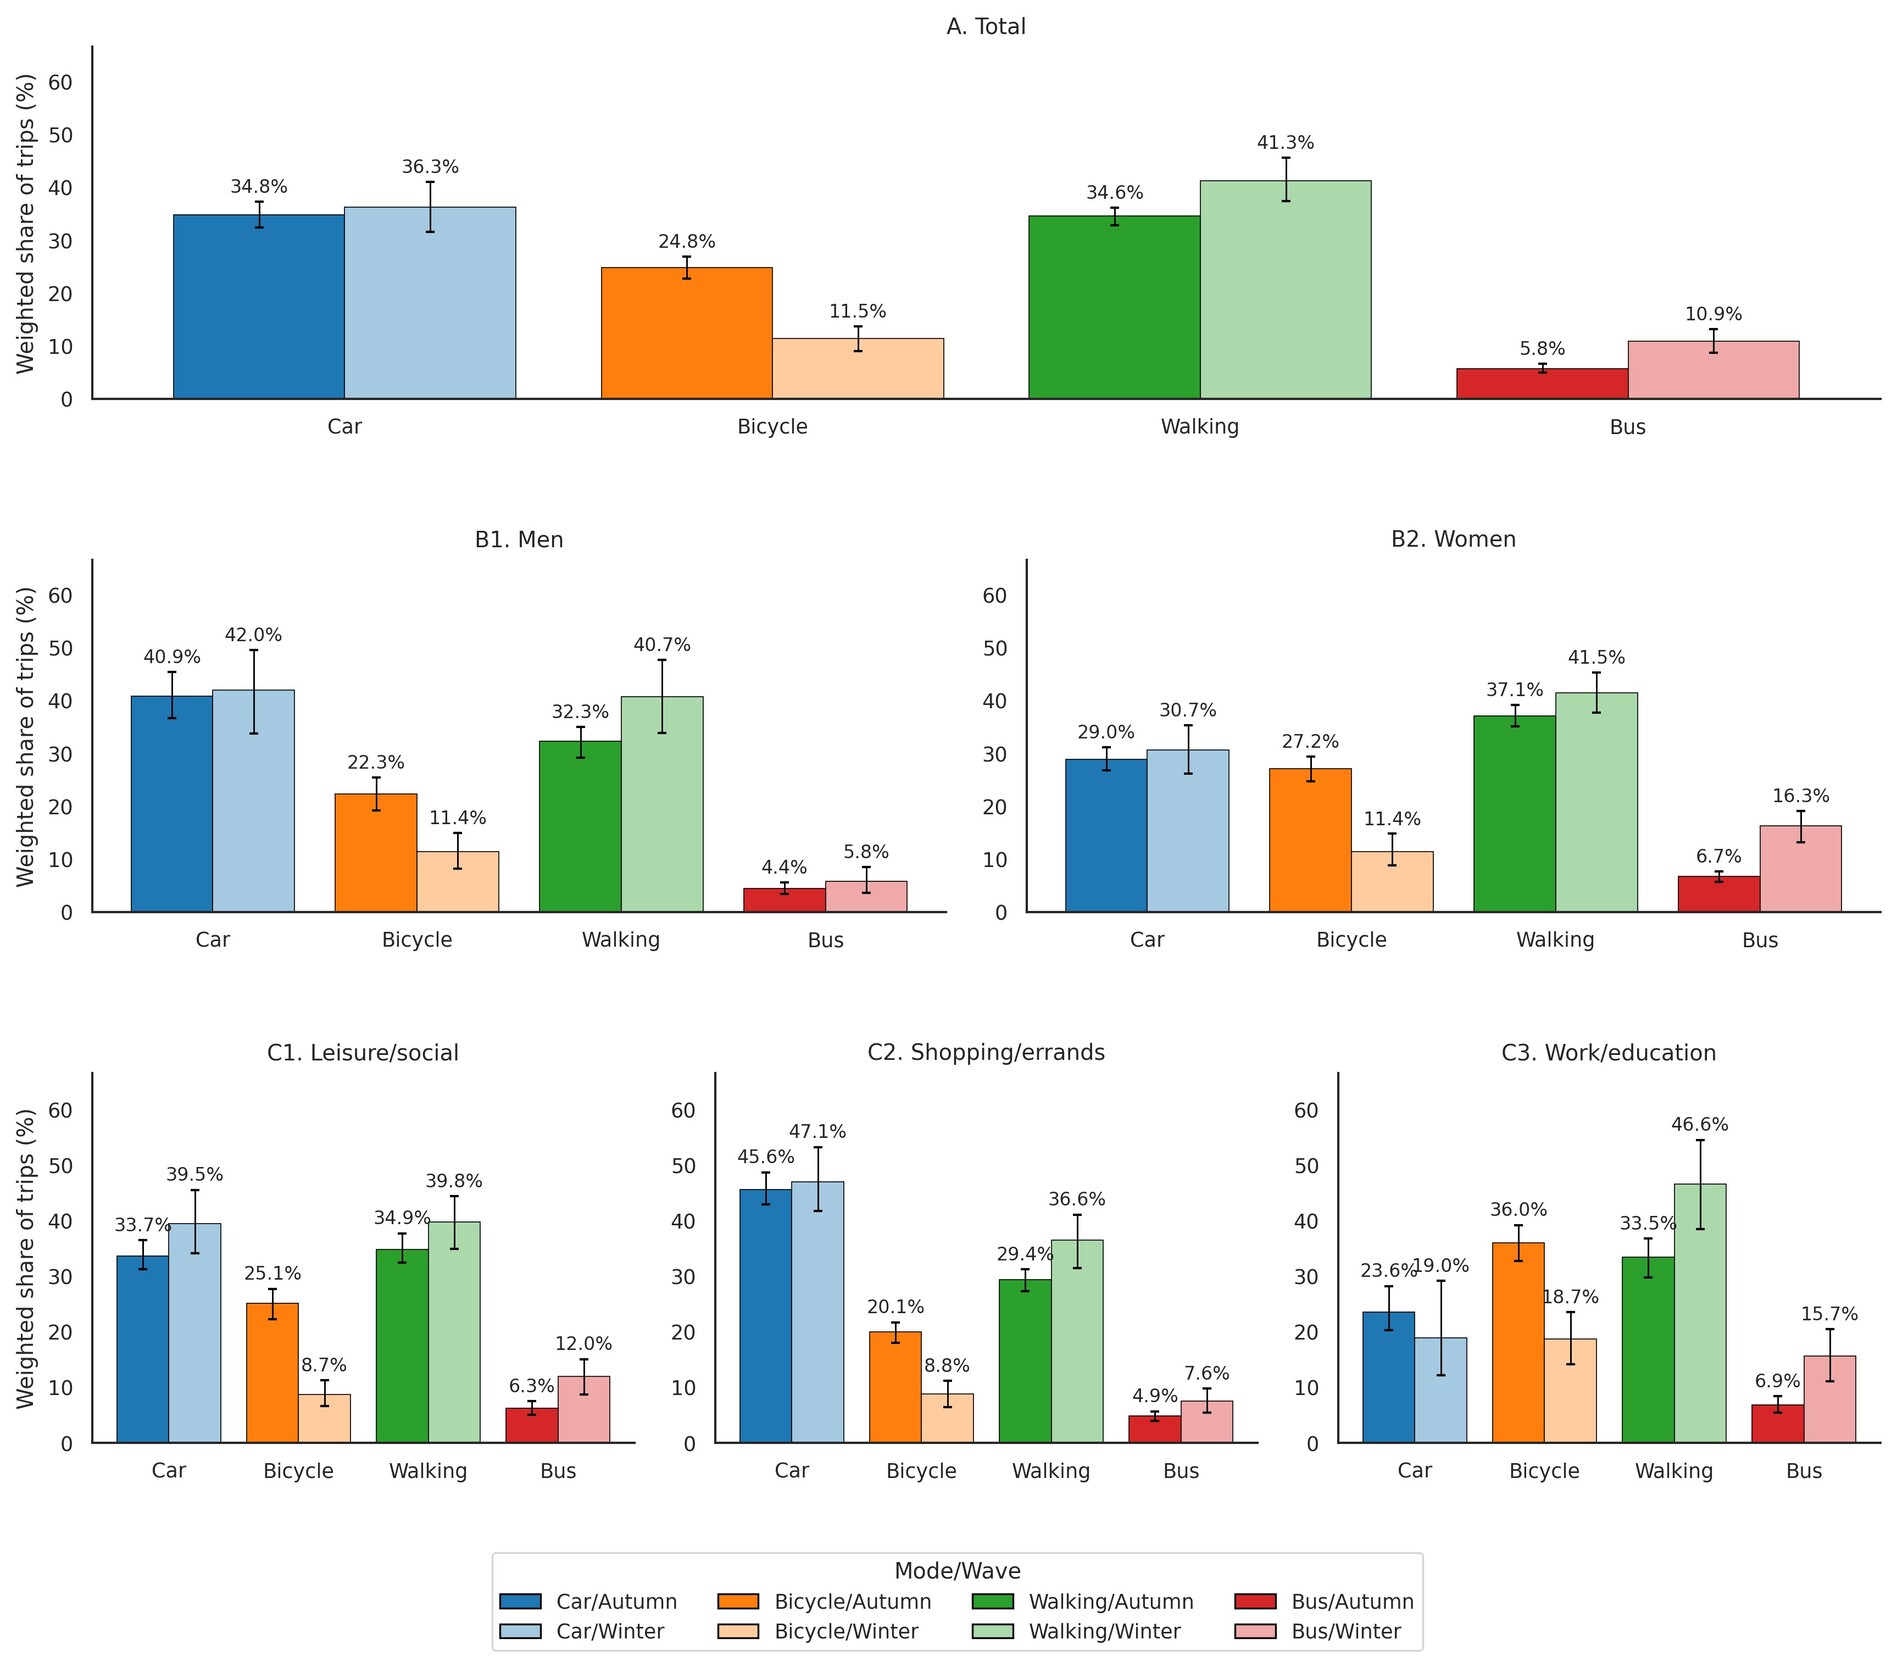
  • Figure 2. Weighted mode shares by wave, gender, and trip purpose. Dark bars show autumn 2022 and light bars show winter 2025. Error bars are 95% confidence intervals from a person-level cluster bootstrap.
    Download

Error

Sorry, something went wrong. Please try again.

If this problem reoccurs, please contact Scholastica Support

Error message:

undefined

View more stats

Abstract

Travel survey data from Umeå, Sweden, show that lower winter bicycle share is part of a broader seasonal reallocation of urban travel. Cycling declines sharply in winter, while walking and bus shares increase. The accompanying mode-share changes differ across groups: men show larger increases in walking, women show larger increases in bus use, and work and education trips retain higher winter bicycle shares than shopping and leisure trips. These findings suggest that winter cycling should be analyzed together with walking and public transport, and that seasonal mobility patterns vary by gender and trip purpose.

1. Questions

Cities in northern climates experience large seasonal shifts in travel conditions. While cycling usually declines during winter, the key policy question is not only how much cycling decreases, but which modes replace it. Böcker et al. (2013) show that adverse weather reduces cycling, but also note that evidence remains fragmented and that context-specific studies of winter cities are needed. Swedish evidence similarly finds that winter lowers cycling while increasing walking and public transport use, with effects varying by region and season (Liu et al. 2015). Suomalainen and Tainio (2025) further shows that cycling can persist in cold climates, although levels differ across city regions. Building on this literature, we examine which modes gain share when winter cycling falls in a northern Swedish city and whether these patterns differ by gender and trip purpose.

Using trip-level smartphone travel diary data from Umeå, Sweden, we ask:

  1. How does the bicycle mode share differ between autumn and winter?

  2. Which modes gain share when bicycle share is lower in winter?

  3. Do these mode-share changes differ by gender and trip purpose?

We examine two hypotheses. First, work and education trips retain higher winter bicycle shares than shopping and leisure trips. Second, the autumn-to-winter decline in bicycle share is accompanied mainly by higher walking and bus shares, not by a comparable increase in car share. Gender differences are estimated after controlling for trip purpose, access, and sociodemographic variables.

2. Methods

We use trip-level TravelVu smartphone travel diary data from autumn 2022 and winter 2025. Table 1 summarizes the survey periods, sample sizes, and collected variables. Umeå Municipality commissioned both surveys. The two waves were conducted in different years and are not a matched panel. To ensure spatial comparability, the two datasets are restricted to the same urban area (Fig. 1).
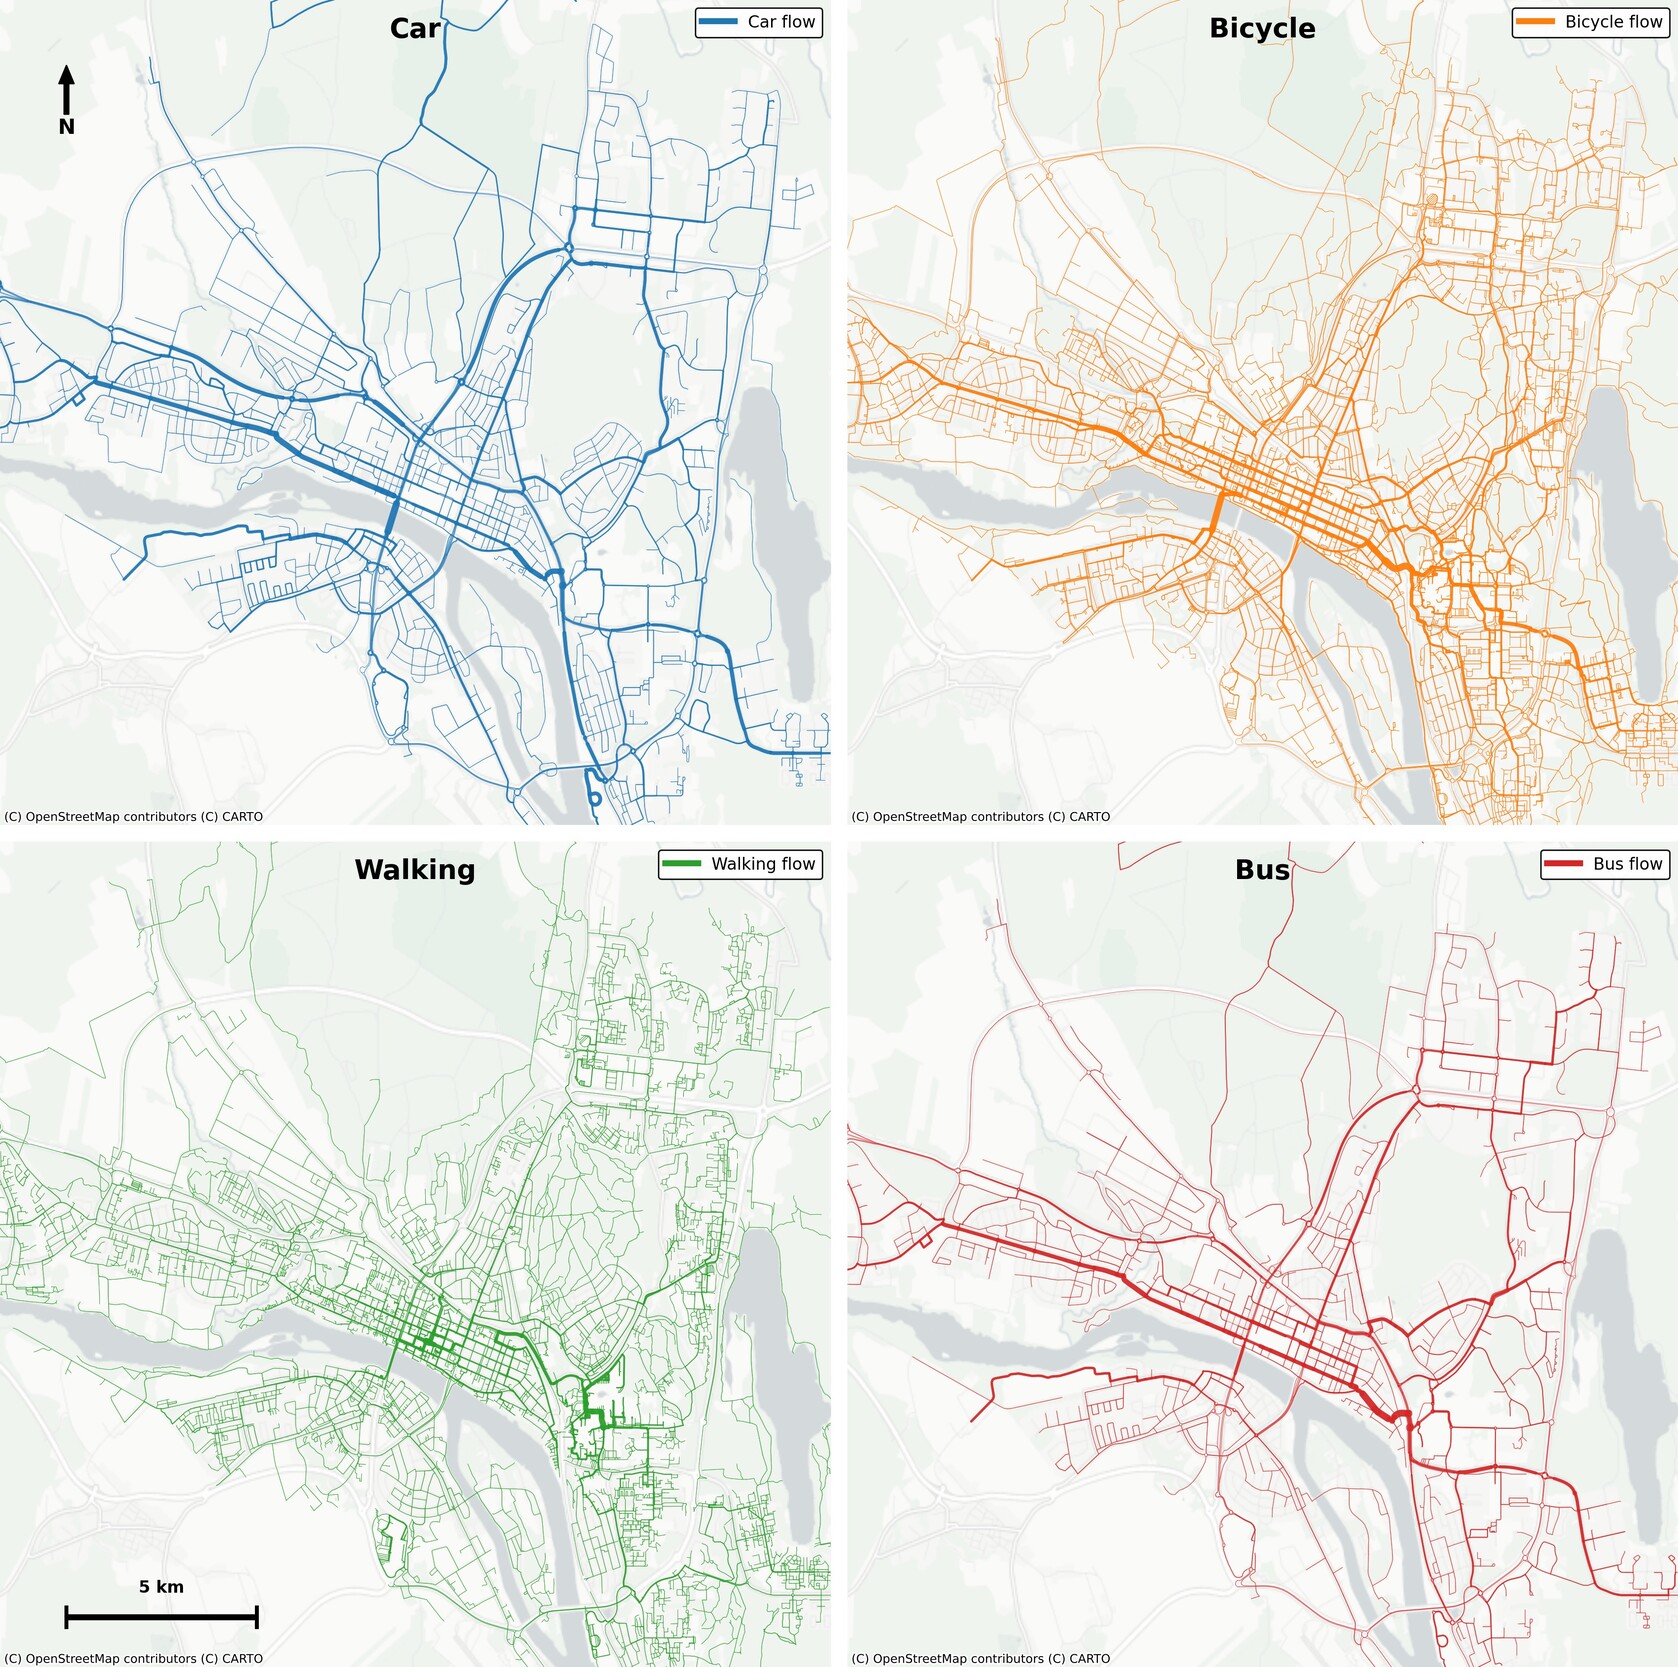
Table 1.Data, Sample, and Variables
Component Description
Data source TravelVu smartphone-based travel diary data
Geography Trips by residents living in the Umeå urban area
Survey waves Autumn 2022: late September–late October; winter 2025: late January–late February
Sample structure Repeated cross-sections with 1,577 distinct individuals and no person observed in both waves
Unit of analysis Trip
Included modes Car, bicycle, walking, and bus
Sample size 100,471 trips of 50 km or less: 84,677 autumn trips from 1,304 persons and 15,794 winter trips from 273 persons
Weights and inference TravelVu population weights for descriptive statistics; person-normalized weights and person-clustered standard errors for MNL models
Small model variables Winter, distance, gender, and a female-by-winter interaction
Full model variables Adds trip purpose, weekday and peak-period indicators, access variables, age group, student status, and education
Reference categories Autumn 2022, men, age 25–44, non-student, high school education, and the residual trip-purpose category
Figure 1
Figure 1.Spatial coverage of trips by travel mode in the Umeå urban area. Lines show estimated OpenStreetMap shortest paths between observed trip start and end points and illustrate survey coverage, not actual routes.

The unit of analysis is the trip, restricted to journeys by car, bicycle, walking, or by bus. The analysis uses TravelVu population travel weights. Confidence intervals are estimated with a person-level cluster bootstrap. The percentage-point changes in Table 2 are based on the underlying weighted estimates, with the displayed shares rounded independently.

Table 2.Autumn–winter change in weighted mode shares by group. Values are percentage-point changes from autumn 2022 to winter 2025.
Group Car Bicycle Walking Bus
Overall +1.2 -13.5 +7.5 +4.8
Men +0.5 -11.2 +9.7 +1.1
Women +1.7 -15.9 +5.2 +9.0
Work/education -3.7 -17.7 +13.3 +8.2
Shopping/errands +1.3 -11.5 +7.5 +2.7
Leisure/social +5.0 -16.8 +6.0 +5.8

We estimate multinomial logit models of mode choice, with car as the reference mode. The models are estimated on complete cases using person-normalized population weights, defined as each person’s TravelVu population weight divided by their number of included trips, limiting the influence of highly active travelers. The main patterns are robust to alternative weighting schemes, though the winter walking and bus effects lose significance once frequent travelers are down-weighted. Standard errors are clustered by person. Nested logit specifications did not improve model fit relative to the multinomial logit model and produced nearly identical predictions.

The design compares two survey waves. The analysis reports observed autumn–winter differences and examines whether lower winter bicycle share is paired mainly with higher car share or with higher walking and bus share. Because the waves differ by season, year, and sample composition, the analysis identifies autumn–winter differences between two survey waves rather than within-person mode switching across seasons. The local network and bus system were broadly stable between waves, with no major cycling or transit infrastructure added. However, changes in fuel prices and post-pandemic travel patterns could also have contributed to the observed differences. The smaller winter sample also means that compositional differences may partly explain the seasonal patterns. The MNL controls for observed composition but cannot rule out unobserved differences.

3. Findings

Fig. 2 shows substantially lower bicycle share in the winter wave, higher walking and bus shares, and little change in car share. Table 2 reports the corresponding seasonal changes in weighted mode shares. The observed patterns are consistent with the hypothesis that lower winter bicycle share is accompanied mainly by higher walking and bus shares, not by a comparable increase in car share.
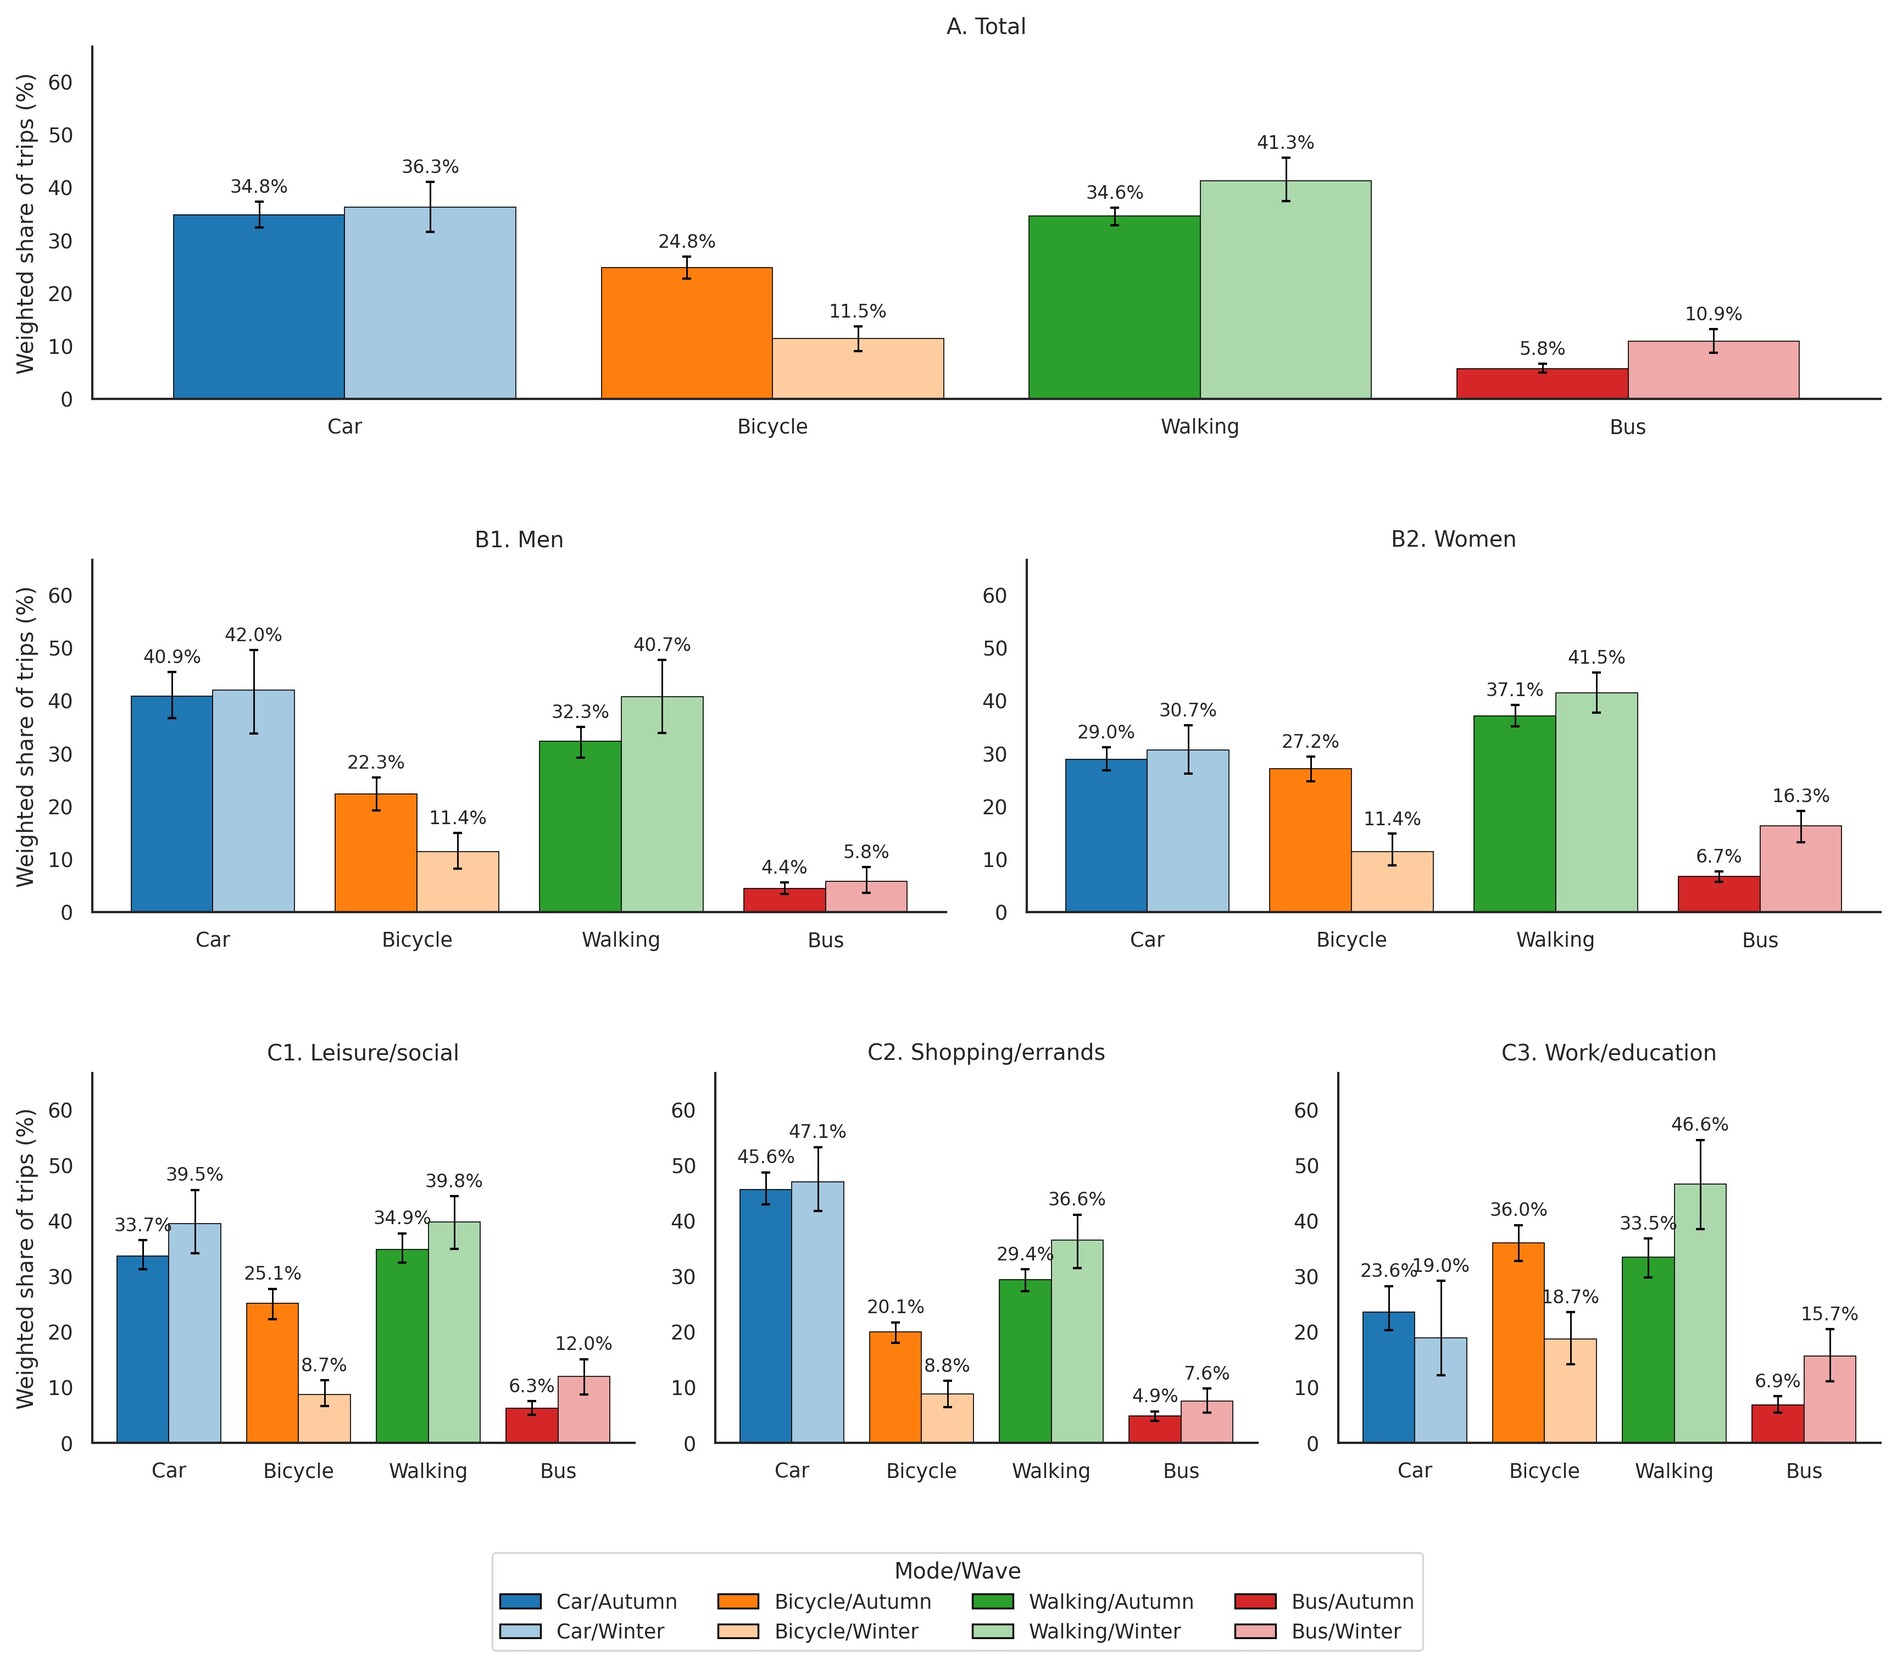
Figure 2
Figure 2.Weighted mode shares by wave, gender, and trip purpose. Dark bars show autumn 2022 and light bars show winter 2025. Error bars are 95% confidence intervals from a person-level cluster bootstrap.

The mode-share changes differ by gender and trip purpose. Men show a larger increase in walking, while women show a larger increase in bus use. Work and education trips retain the highest winter bicycle share among the trip-purpose categories, whereas leisure and social trips show the largest increase in car share. Since the two waves include different individuals, the comparisons do not capture within-person changes.

Table 3 reports the multinomial logit estimates. Since the car is the reference mode, each coefficient is interpreted relative to the car. Winter is associated with significantly lower bicycle use relative to car. The effect remains after controlling for trip purpose, access, and sociodemographic characteristics. The winter effects for walking and bus are not statistically significant. The female-by-winter interaction is positive for bus and negative for bicycle, but neither effect is statistically significant, making the evidence too weak to statistically confirm a gender difference.

Table 3.Multinomial logit models of mode choice. Coefficient entries use person-clustered standard errors in parentheses and person-normalized population weights. The prediction block reports weighted average probability changes in percentage points. Car is included in all probability calculations but omitted from the displayed mode columns. Significance levels: \({\mathstrut}^{*}p<0.05\), \({\mathstrut}^{**}p<0.01\), \({\mathstrut}^{***}p<0.001\).
Small model Full model
Travel mode Bicycle Walking Bus Bicycle Walking Bus
Winter 2025 \(-0.885^{*}\) \(-0.034\) \(-0.150\) \(-1.092^{***}\) \(-0.016\) \(0.004\)
\((0.384)\) \((0.330)\) \((0.445)\) \((0.315)\) \((0.284)\) \((0.472)\)
Female \(0.668^{**}\) \(0.659^{**}\) \(1.117^{***}\) \(0.599^{*}\) \(0.614^{**}\) \(1.013^{**}\)
\((0.235)\) \((0.203)\) \((0.330)\) \((0.235)\) \((0.218)\) \((0.340)\)
Female \(\times\) winter \(-0.159\) \(0.391\) \(0.883\) \(-0.059\) \(0.153\) \(0.801\)
\((0.524)\) \((0.488)\) \((0.569)\) \((0.492)\) \((0.400)\) \((0.595)\)
Distance (km) \(-0.265^{***}\) \(-0.734^{***}\) \(-0.042^{**}\) \(-0.292^{***}\) \(-0.810^{***}\) \(-0.020\)
\((0.053)\) \((0.089)\) \((0.015)\) \((0.058)\) \((0.095)\) \((0.012)\)
Work/education trip – – – \(0.527\) \(-1.173^{***}\) \(0.918^{*}\)
\((0.291)\) \((0.322)\) \((0.394)\)
Shopping/errands trip – – – \(-1.350^{***}\) \(-2.416^{***}\) \(-0.457\)
\((0.306)\) \((0.312)\) \((0.388)\)
Leisure/social trip – – – \(-0.790^{*}\) \(-1.823^{***}\) \(0.260\)
\((0.314)\) \((0.314)\) \((0.413)\)
Weekday – – – \(-0.108^{*}\) \(-0.042\) \(-0.117^{*}\)
\((0.053)\) \((0.050)\) \((0.053)\)
Morning peak – – – \(0.551^{*}\) \(0.157\) \(0.618^{*}\)
\((0.237)\) \((0.242)\) \((0.261)\)
Afternoon peak – – – \(0.630^{***}\) \(-0.057\) \(0.354\)
\((0.176)\) \((0.196)\) \((0.189)\)
Car access – – – \(-1.711^{***}\) \(-2.307^{***}\) \(-2.386^{***}\)
\((0.383)\) \((0.335)\) \((0.380)\)
Bicycle access – – – \(1.527^{**}\) \(0.136\) \(-0.391\)
\((0.573)\) \((0.345)\) \((0.393)\)
Age 16–24 – – – \(-0.202\) \(-0.073\) \(-0.554\)
\((0.336)\) \((0.405)\) \((0.565)\)
Age 45–64 – – – \(-0.045\) \(0.051\) \(-0.297\)
\((0.276)\) \((0.289)\) \((0.342)\)
Age 65+ – – – \(-0.072\) \(0.139\) \(0.272\)
\((0.348)\) \((0.273)\) \((0.402)\)
Student – – – \(0.781^{**}\) \(0.530\) \(0.711\)
\((0.303)\) \((0.349)\) \((0.534)\)
Higher/medium education – – – \(0.765^{**}\) \(0.845^{**}\) \(-0.434\)
\((0.267)\) \((0.290)\) \((0.408)\)
Primary/lower education – – – \(0.326\) \(0.373\) \(-0.446\)
\((0.558)\) \((0.591)\) \((0.687)\)
Other education – – – \(0.349\) \(0.359\) \(-0.214\)
\((0.526)\) \((0.394)\) \((0.470)\)
Alternative-specific constant \(0.665^{**}\) \(1.917^{***}\) \(-1.881^{***}\) \(0.991\) \(4.974^{***}\) \(0.729\)
\((0.240)\) \((0.220)\) \((0.290)\) \((0.793)\) \((0.599)\) \((0.716)\)
Predicted autumn-to-winter probability changes (percentage points)
Men: winter \(-\) autumn \(-11.96\) \(5.96\) \(0.08\) \(-13.60\) \(6.98\) \(0.90\)
Women: winter \(-\) autumn \(-18.82\) \(12.16\) \(7.69\) \(-17.19\) \(8.05\) \(8.50\)
Female \(\times\) winter effect \(-6.86\) \(6.20\) \(7.61\) \(-3.59\) \(1.06\) \(7.61\)
Observations 100,471 trips 100,471 trips
Persons 1,577 1,577
Parameters 15 60
Weighted log likelihood \(-97,944.68\) \(-84,813.24\)
Null log likelihood \(-123,732.80\) \(-123,732.80\)
McFadden \(\rho^2\) 0.208 0.315
Adjusted McFadden \(\bar{\rho}^2\) 0.208 0.314
Weighted mean log loss 0.9749 0.8442
Weighted Brier score 0.5064 0.4357

The predicted probabilities for both models align with the descriptive shares: a larger winter decline in cycling among women, a larger increase in walking among men, and a larger increase in bus use among women.

The control variables have expected signs. Distance reduces the relative benefits of bicycle and walking compared to the car. Car access lowers non-car use, bicycle access strongly increases bicycle use, and students are more likely to use non-car modes. Adding these controls does not change the main winter and gender patterns. A motorized nested logit sensitivity analysis yielded nearly identical predicted seasonal changes, indicating that the main findings are robust to relaxing the substitution assumption between car and bus. The winter decline in cycling in Umeå is therefore part of a seasonal change in urban mode shares, with higher walking and bus shares and with differences by gender and trip purpose.


Acknowledgements

This research was supported by the Swedish Energy Agency under project number P2025-04323. We thank Umeå Municipality for providing access to the travel survey data. The interpretations and conclusions are the authors’ own.

Data and Code Availability

Trip-level records are not public because they contain individual location data and are held under agreement with Umeå Municipality. A synthetic dataset and code reproducing Tables 2 and 3 are available at https://github.com/jkwestin/winter-cycling-reproducibility.

Submitted: June 09, 2026 AEST

Accepted: July 20, 2026 AEST

References

Böcker, Lars, Martin Dijst, and Jan Prillwitz. 2013. “Impact of Everyday Weather on Individual Daily Travel Behaviours in Perspective: A Literature Review.” Transport Reviews 33 (1): 71–91. https:/​/​doi.org/​10.1080/​01441647.2012.747114.
Google Scholar
Liu, Chengxi, Yusak O. Susilo, and Anders Karlström. 2015. “The Influence of Weather Characteristics Variability on Individual’s Travel Mode Choice in Different Seasons and Regions in Sweden.” Transport Policy 41: 147–58. https:/​/​doi.org/​10.1016/​j.tranpol.2015.01.001.
Google Scholar
Suomalainen, Emilia, and Marko Tainio. 2025. “The Potential of Bicycle Commuting to Reduce Carbon Emissions in Finland.” PLOS ONE 20 (11): e0335010. https:/​/​doi.org/​10.1371/​journal.pone.0335010.
Google Scholar

Attachments

Powered by Scholastica, the modern academic journal management system