
1. Questions
Since 2012, the City of Toronto has experienced a steady increase in the number of ridehail (e.g. Uber and Lyft) drivers, trips, and associated kilometres traveled. The rapid expansion of ridehailing services has occurred in many cities and has prompted growing scrutiny of deadheading; the kilometers driven without a passenger as drivers roam, reposition, or travel to their next pickup location (Abdelhalim 2026; Ling et al. 2025; Ward et al. 2021). Deadheading is identified as a particularly significant contributor to congestion (Sheldon and Dua 2024), as even under the extreme assumption that all ridehailing trips would otherwise have been made by private vehicles, the vehicle-kilometres traveled (VKT) associated with deadheading exceed what passengers themselves would have generated.
Deadheading also carries notable labour implications, as, drivers are generally not paid during these phases (Young et al. 2025), so understanding the share of overall in-app time it represents is essential for assessing accurate driver wages. Given its structural role in ridehail operations, and its importance for both congestion and driver earnings, researchers have increasingly sought to quantify its impact by measuring its prevalence and the share of total ridehail VKT it represents.
However, data on deadheading have been difficult to obtain, as ridehailing companies have rarely made such information publicly available. As a result, studies have relied on indirect methods. These include assuming deadheading distances (Tirachini and Gomez-Lobo 2020), estimating them using shortest paths between pick-up and drop-off locations (Nair et al. 2020), or collecting and extrapolating from small samples of driver behaviours to infer between-trip travel (Henao and Marshall 2019). In rare cases, ridehailing companies have shared proprietary data with researchers, enabling estimates of deadheading (Cramer and Krueger 2016), yet because drivers often use multiple ridehailing apps simultaneously, accepting whichever offers a trip first, data from a single company can be misleading.
These varied approaches underscore both the growing interest and the importance in accurately quantifying the share of ridehail VKT attributable to deadheading. They also reveal the methodological limitations that continue to constrain existing estimates, highlighting the need for a more robust assessment. Our study wishes to address many of these data challenges by establishing not only a precise estimate of the proportion of VKT associated with deadheading, but also how this proportion has evolved over time.
2. Methods
To operate in the City of Toronto, ridehail companies must comply with a Data Sharing Agreement embedded within the city’s Vehicle-for-Hire bylaw (City of Toronto 2024). This agreement requires them to submit complete trip-level records, including origins and destinations, start and end times, fares paid, and vehicle details. These data are available through the City’s Open Data Portal and provide a comprehensive summary of ridehailing in Toronto since January 1st, 2020[1].
The data provide key operating statistics such as the duration spent and distance travelled by ridehail drivers during their shifts. Importantly, the disaggregated trip records report both time and distance separately for each phase of the trip. The data are organized into three trip segments to reflect the distinct phases of app use: (1) The time between logging on and accepting a trip request; (2) the time spent traveling to the pickup location; and (3) the time from passenger pickup to drop-off. This structure allows us to quantify and compare the time spent transporting passengers with time spent deadheading. To prevent double-counting distances when drivers work across multiple platforms, the city aggregates trip data from all ridehail companies and applies a deduplication process that removes overlapping vehicle activity. We used these phase-level distance measures to calculate total ridehail VKT, as well as the share attributable to deadheading, by summing the distance reported in each trip segment across all recorded trips.
3. Findings
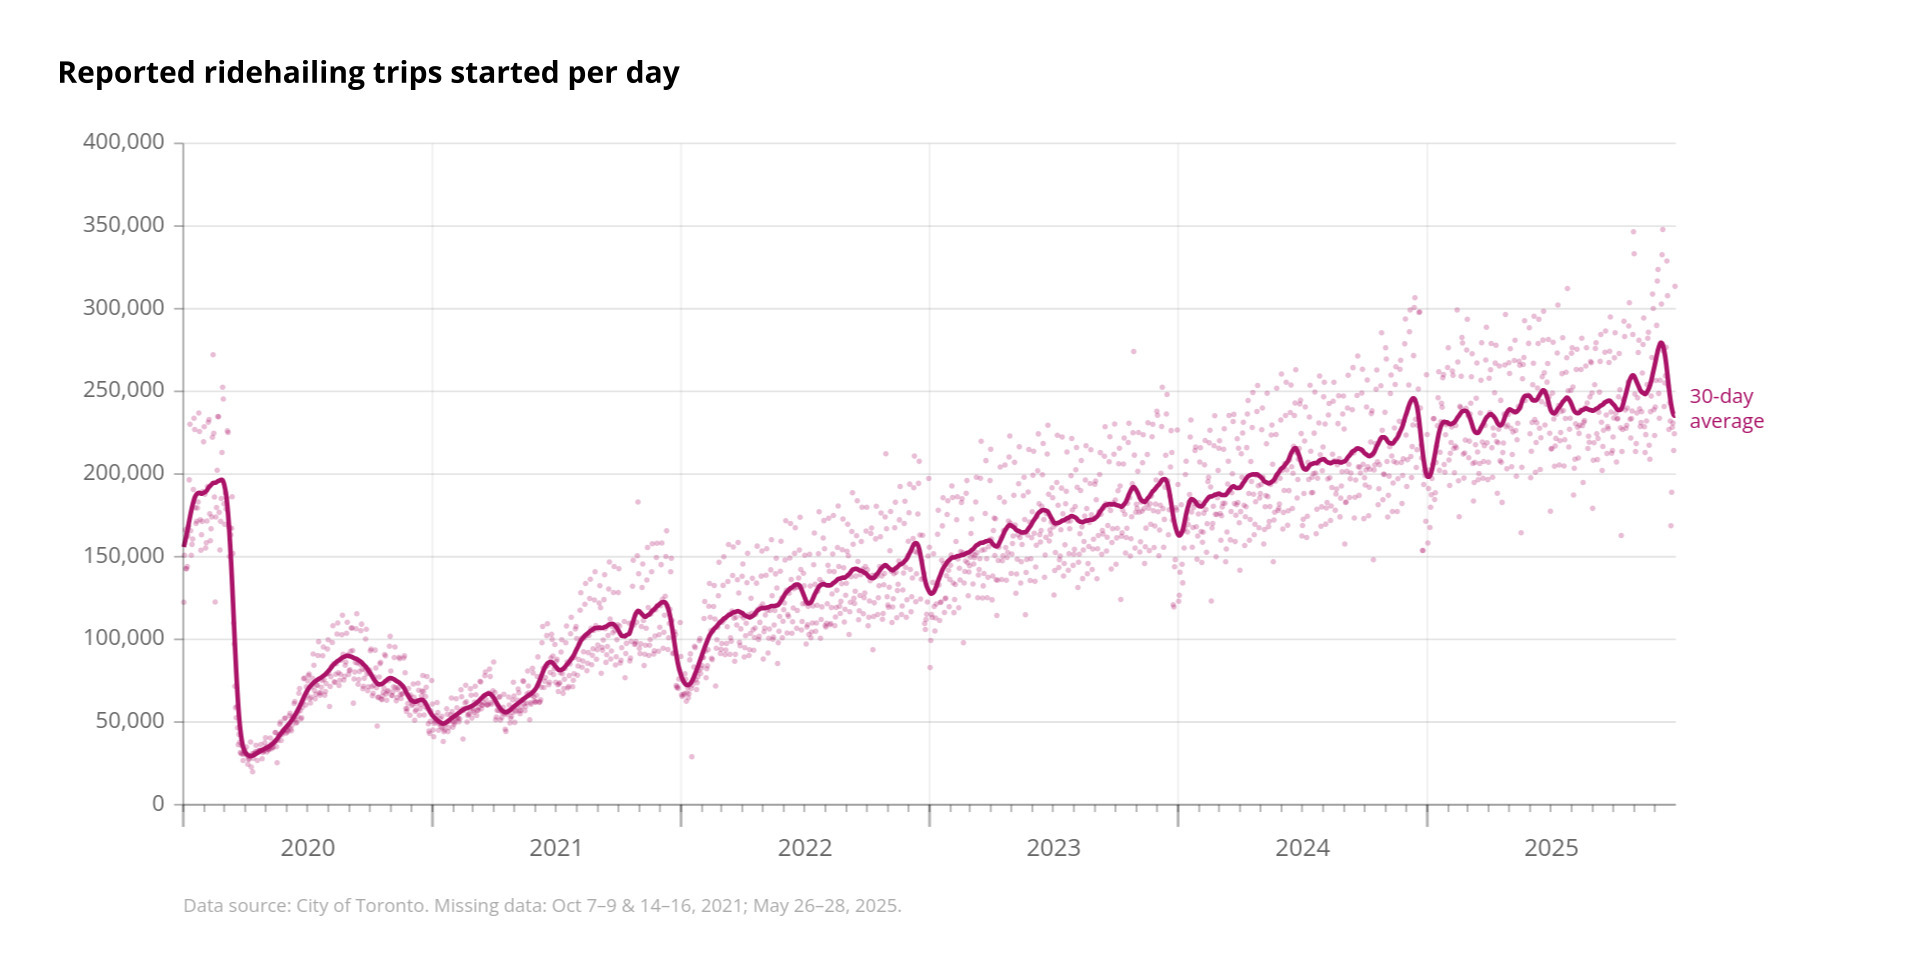
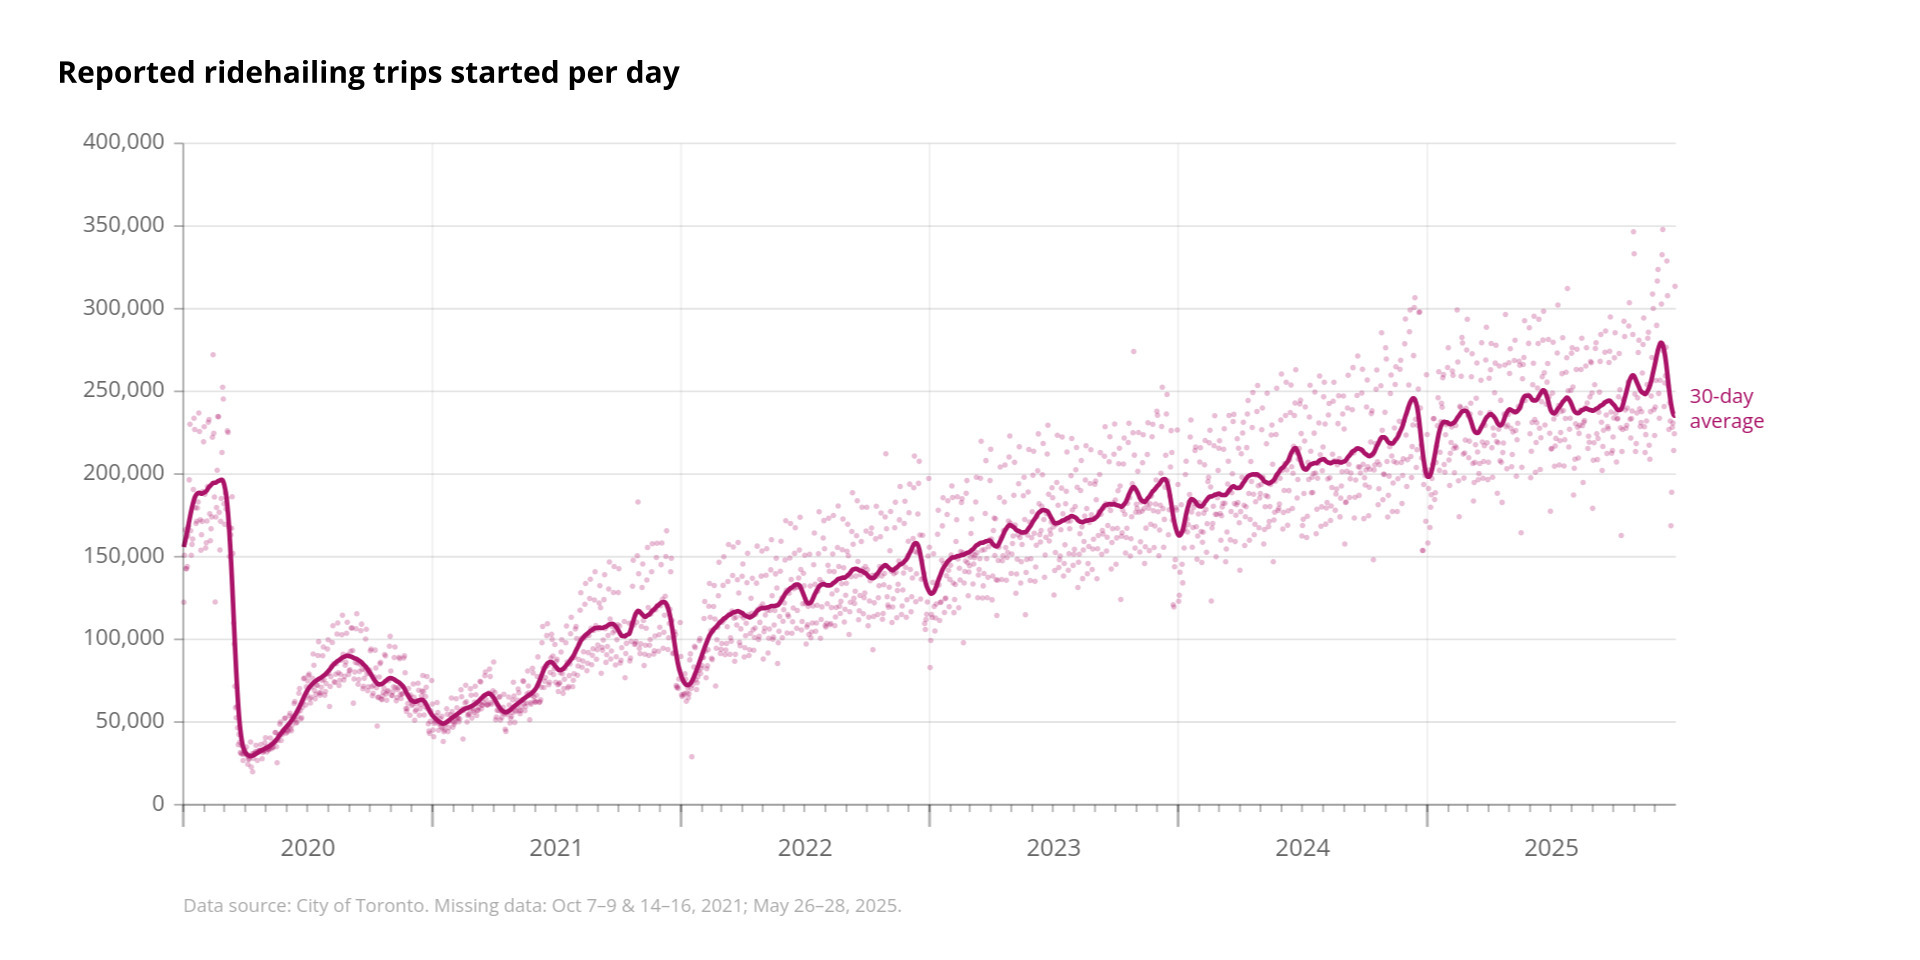
Figure 1 shows the shock induced by the COVID-19 pandemic and following period of relatively steady, sustained growth in daily ridehailing activity. The volume of ridehailing trips has now surpassed pre-pandemic levels; in 2025, a total of 87,067,979 ridehailing trips were recorded, equivalent to 21% of the 413,068,000 annual transit trips reported by the Toronto Transit Commission (TTC) that year (TTC 2025).
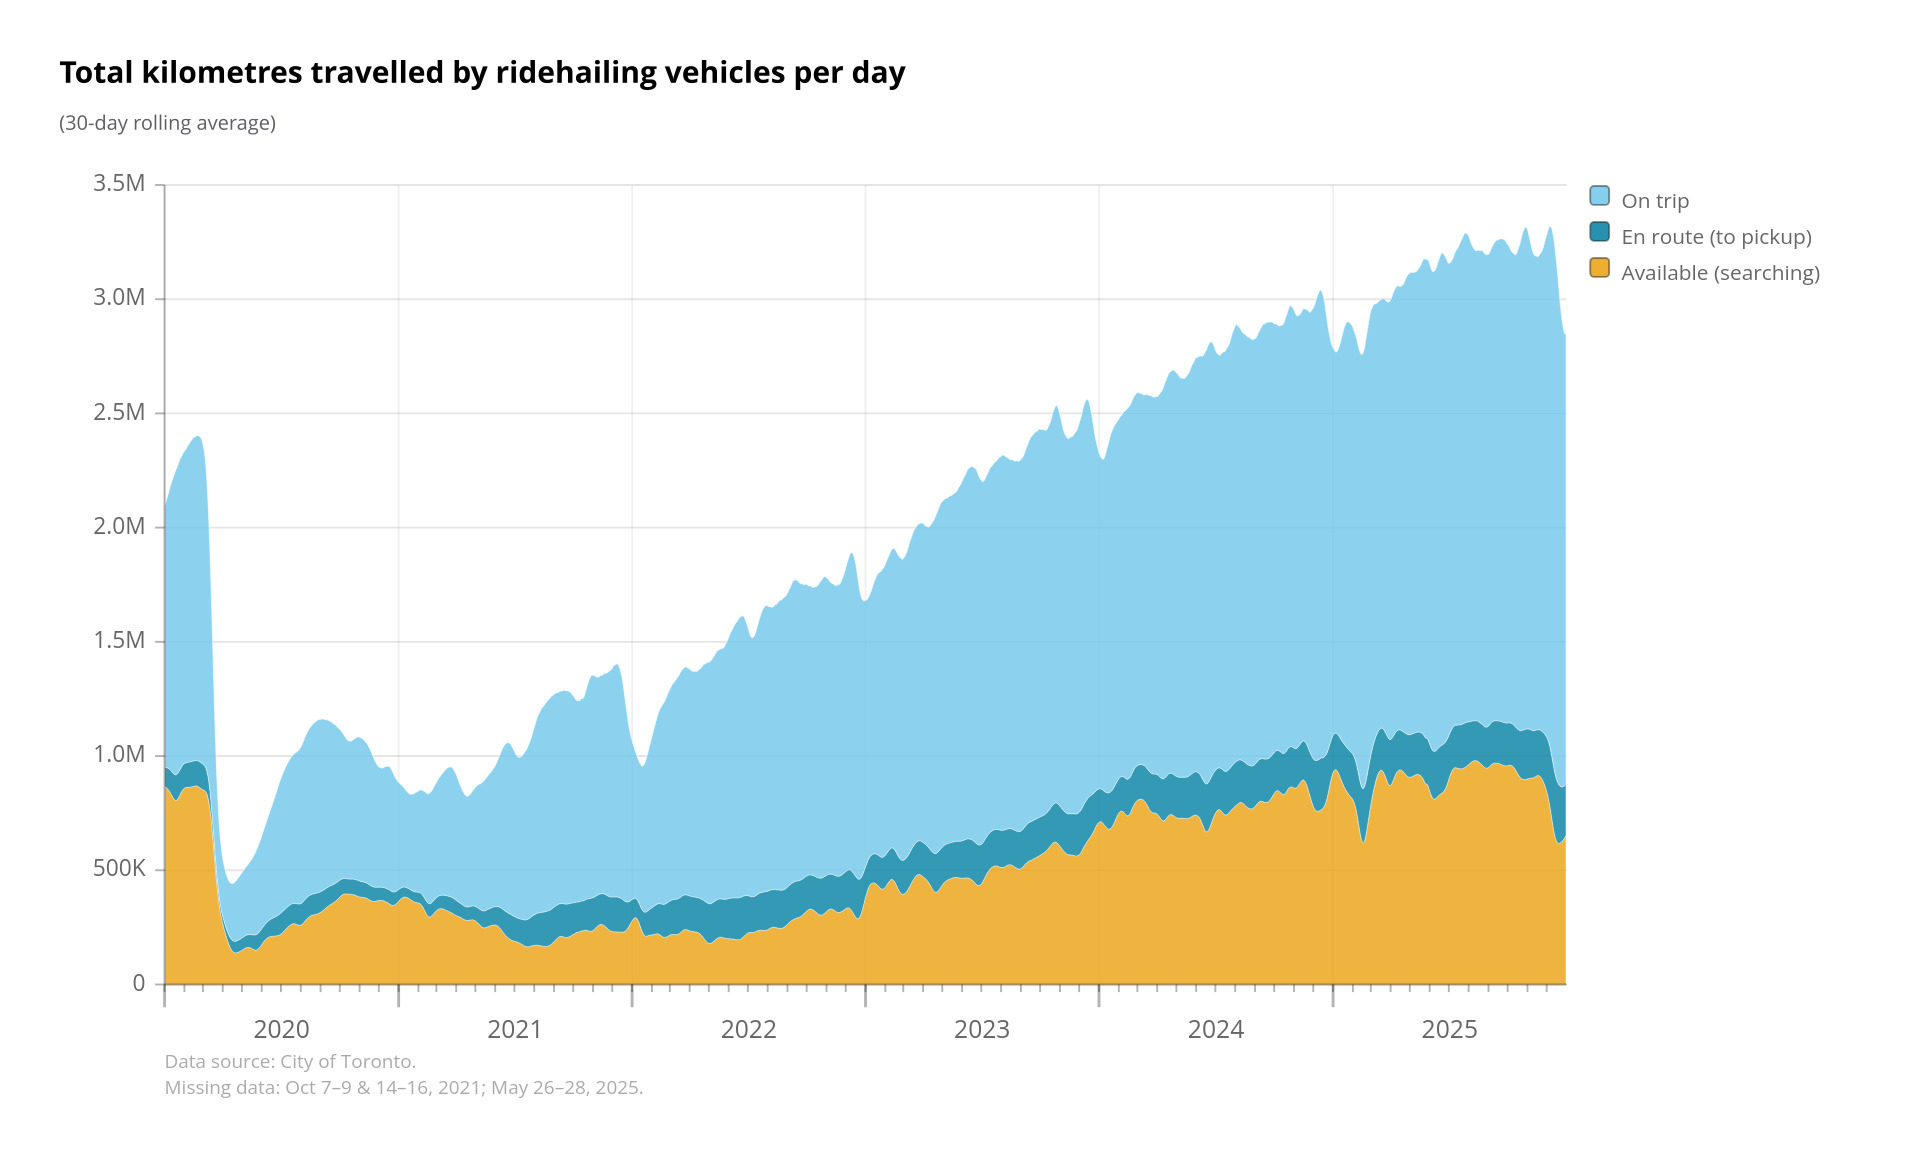
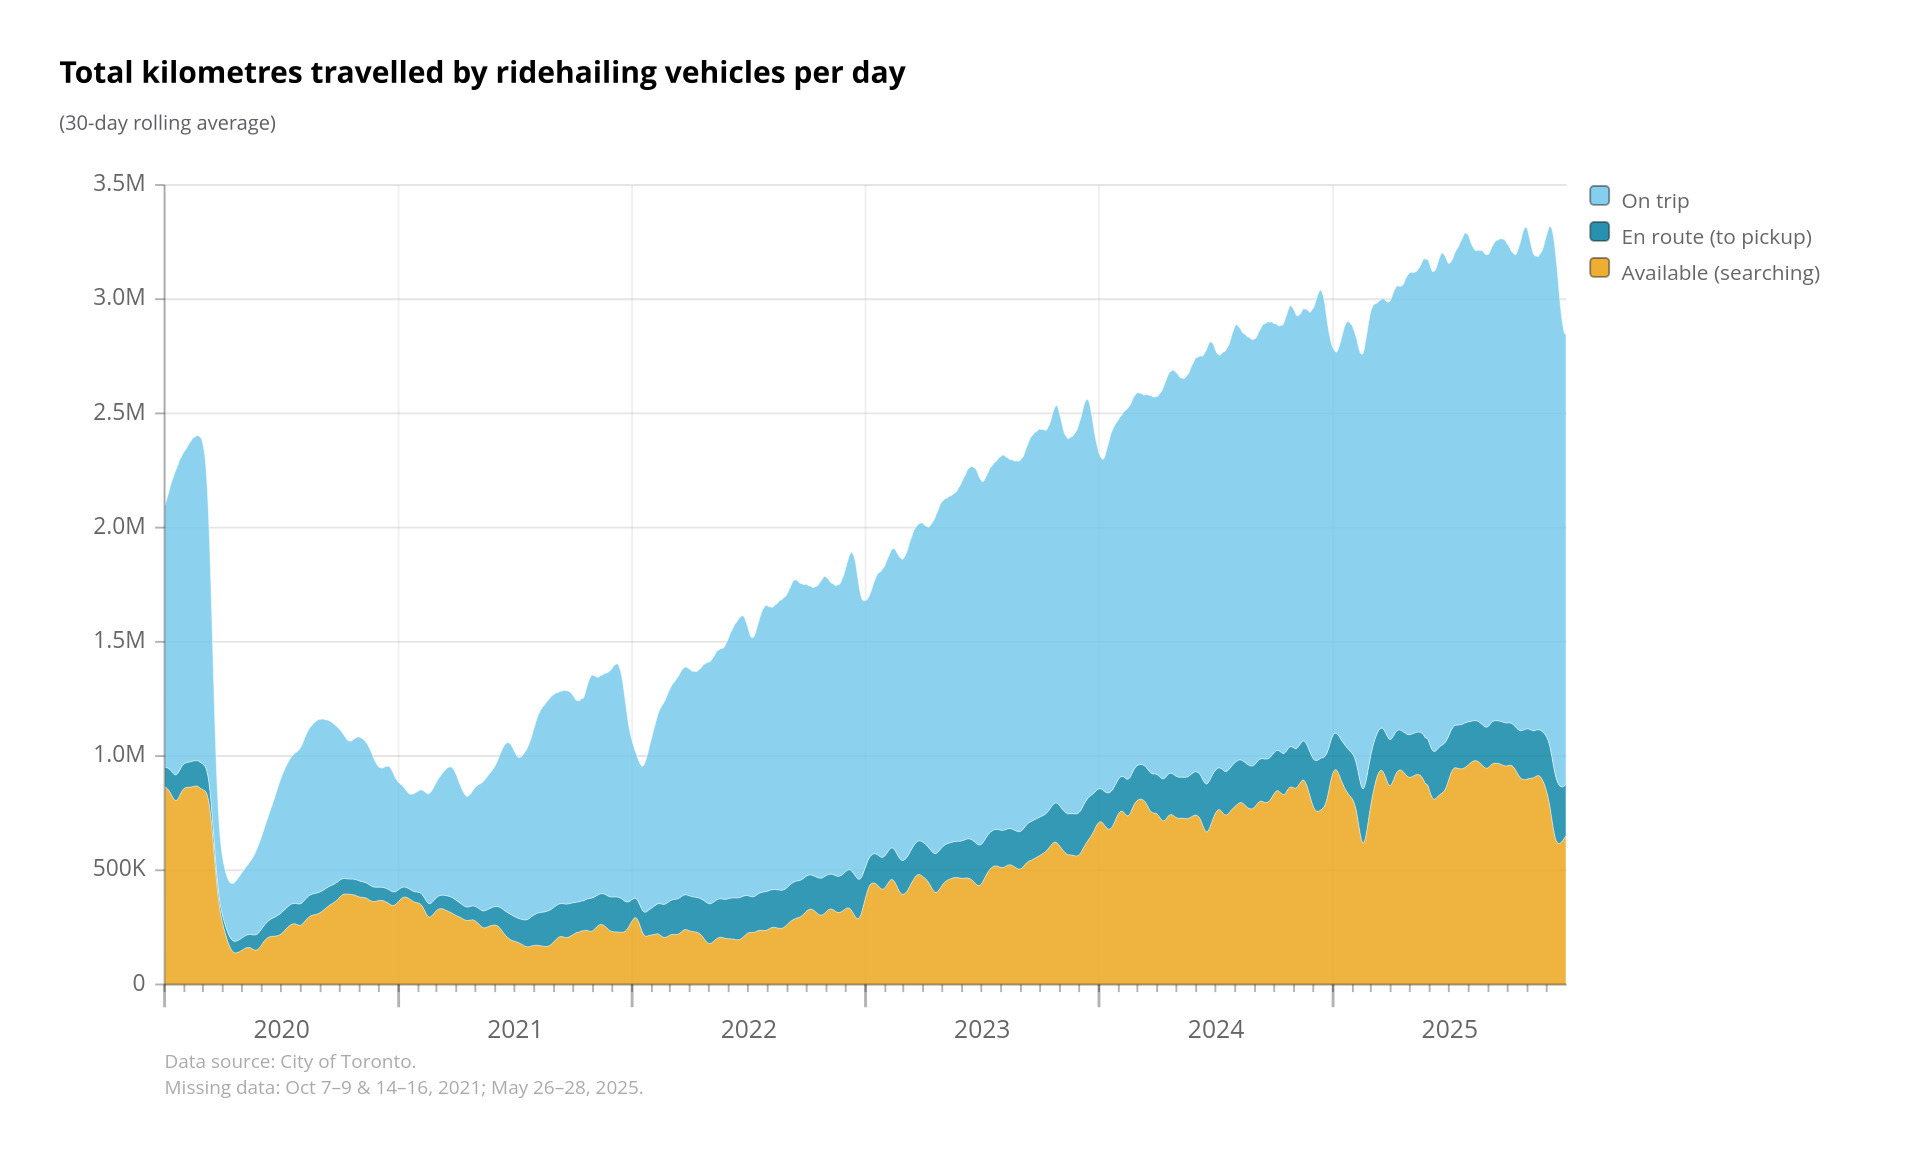
This growth in ridehail ridership can also be observed through the evolution of its VKT footprint. Figure 2 illustrates the total daily VKT generated by ridehailing in Toronto, disaggregated by phases of travel. Total daily ridehailing VKT exceeded 3 million kilometers in 2025, with deadheading (yellow and dark blue segments) accounting for roughly one-third of that total amount (approximately 1.08 million kilometers). These are kilometers that would likely not have occurred had passengers used their own private vehicles[2], and are widely seen as a contributor to rising traffic congestion (Ling et al. 2025; Roy et al. 2020).
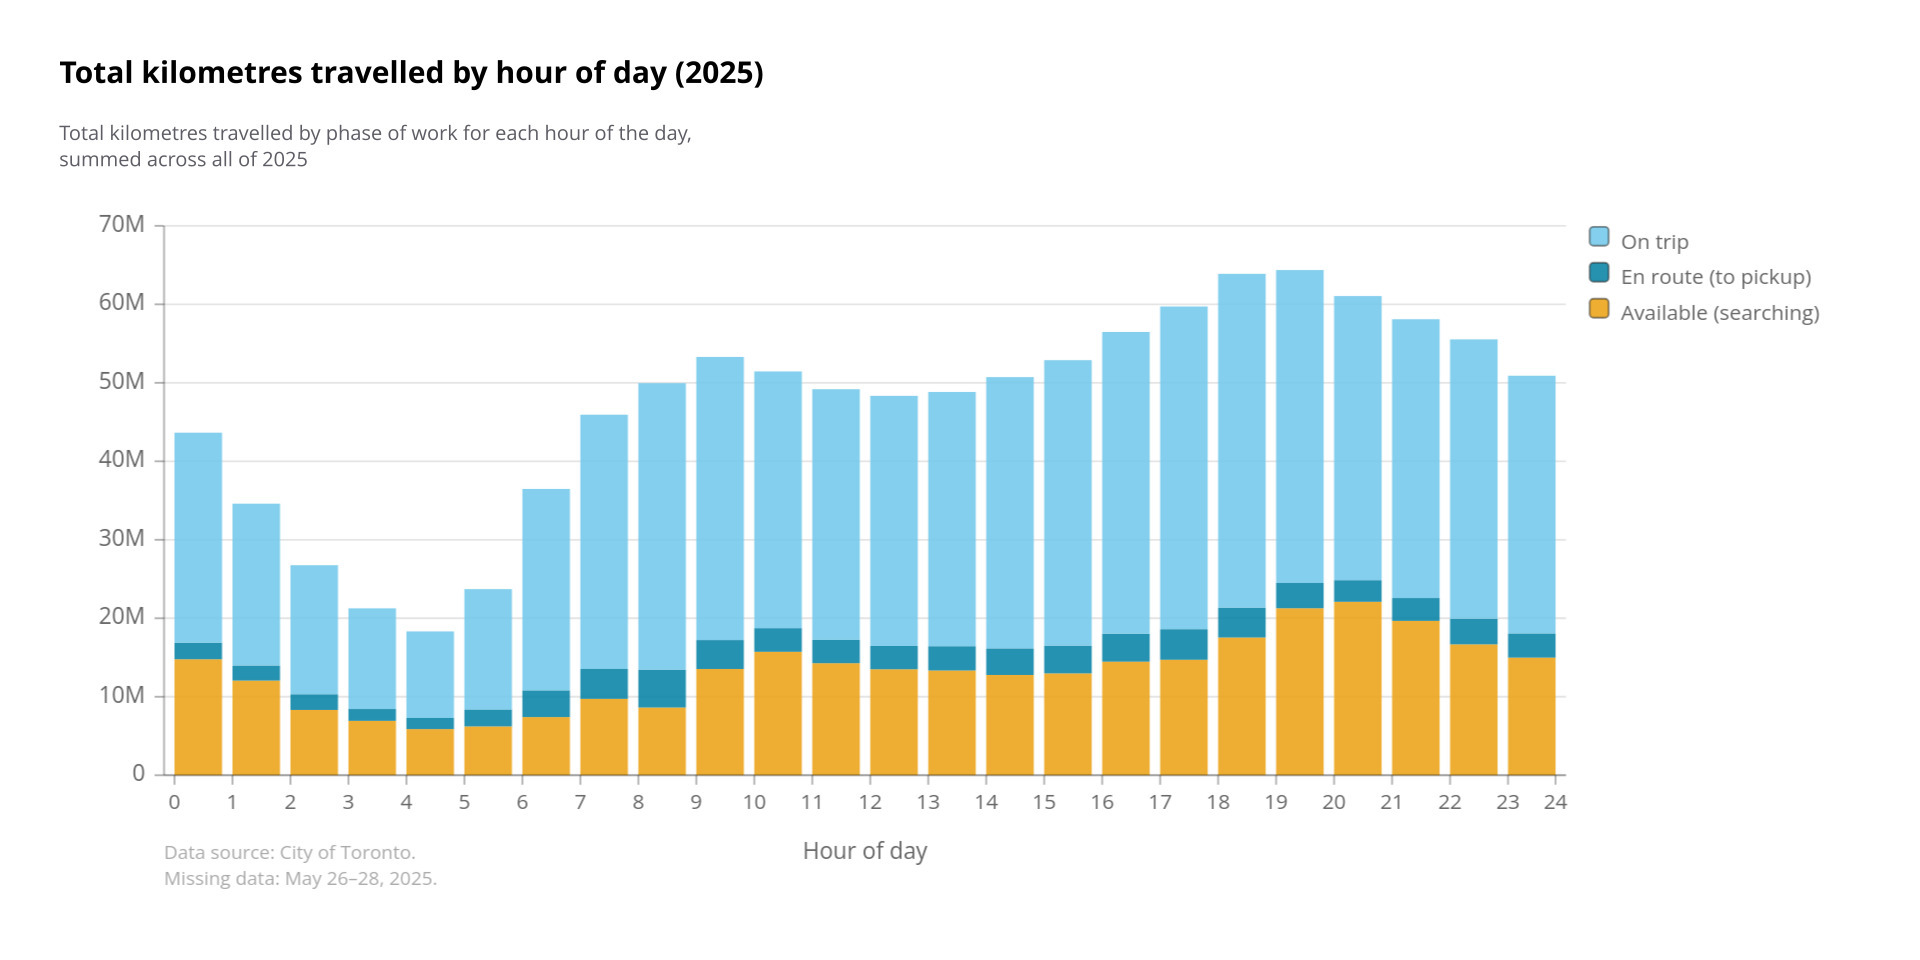
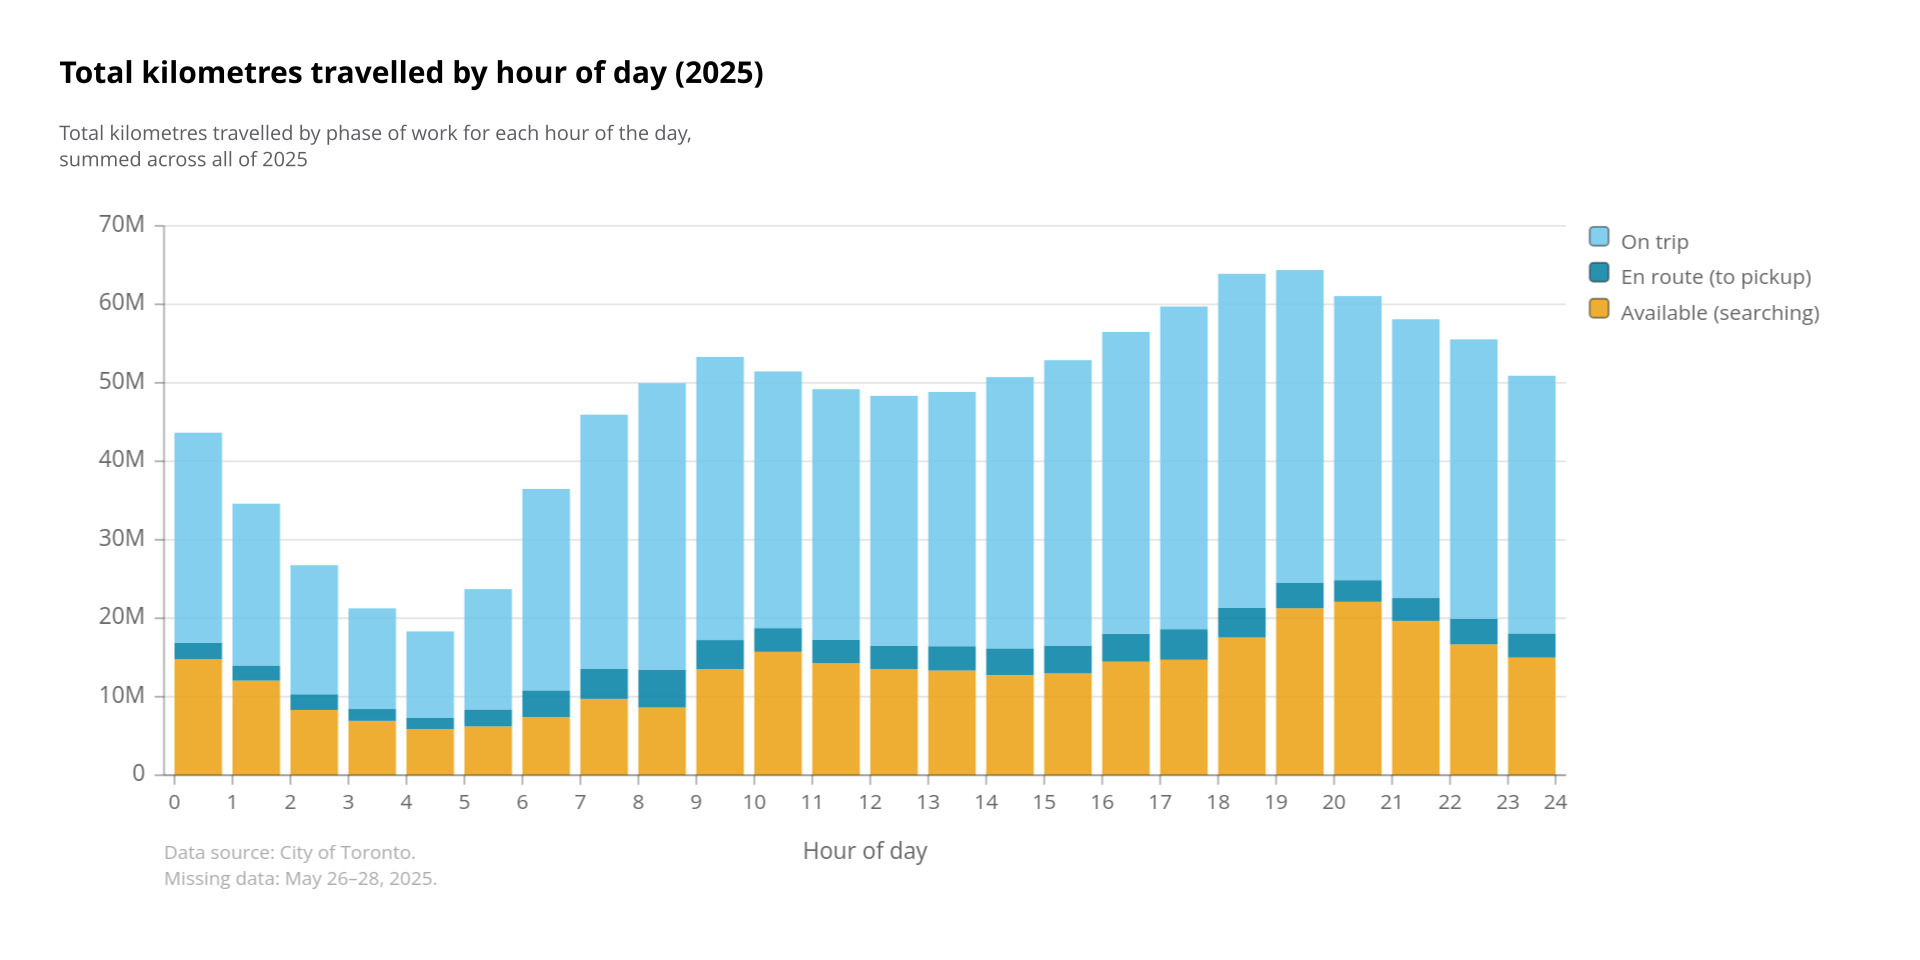
That said, the extent to which deadheading contributes to congestion depends in part on when ridehail trips occur. Additional VKT generated during the early morning hours, when roads are typically uncongested, will not have the same impact as VKT added during already-busy peak periods. To assess this, we disaggregate total kilometres travelled by trip phase for each hour of the day in 2025 (Figure 3). Although ridehail VKT appear to peak between 7-8PM, a noticeable share of trips, and the associated VKT, occurs during the morning and evening peak periods, which supports the notion that ridehailing may be contributing to congestion.
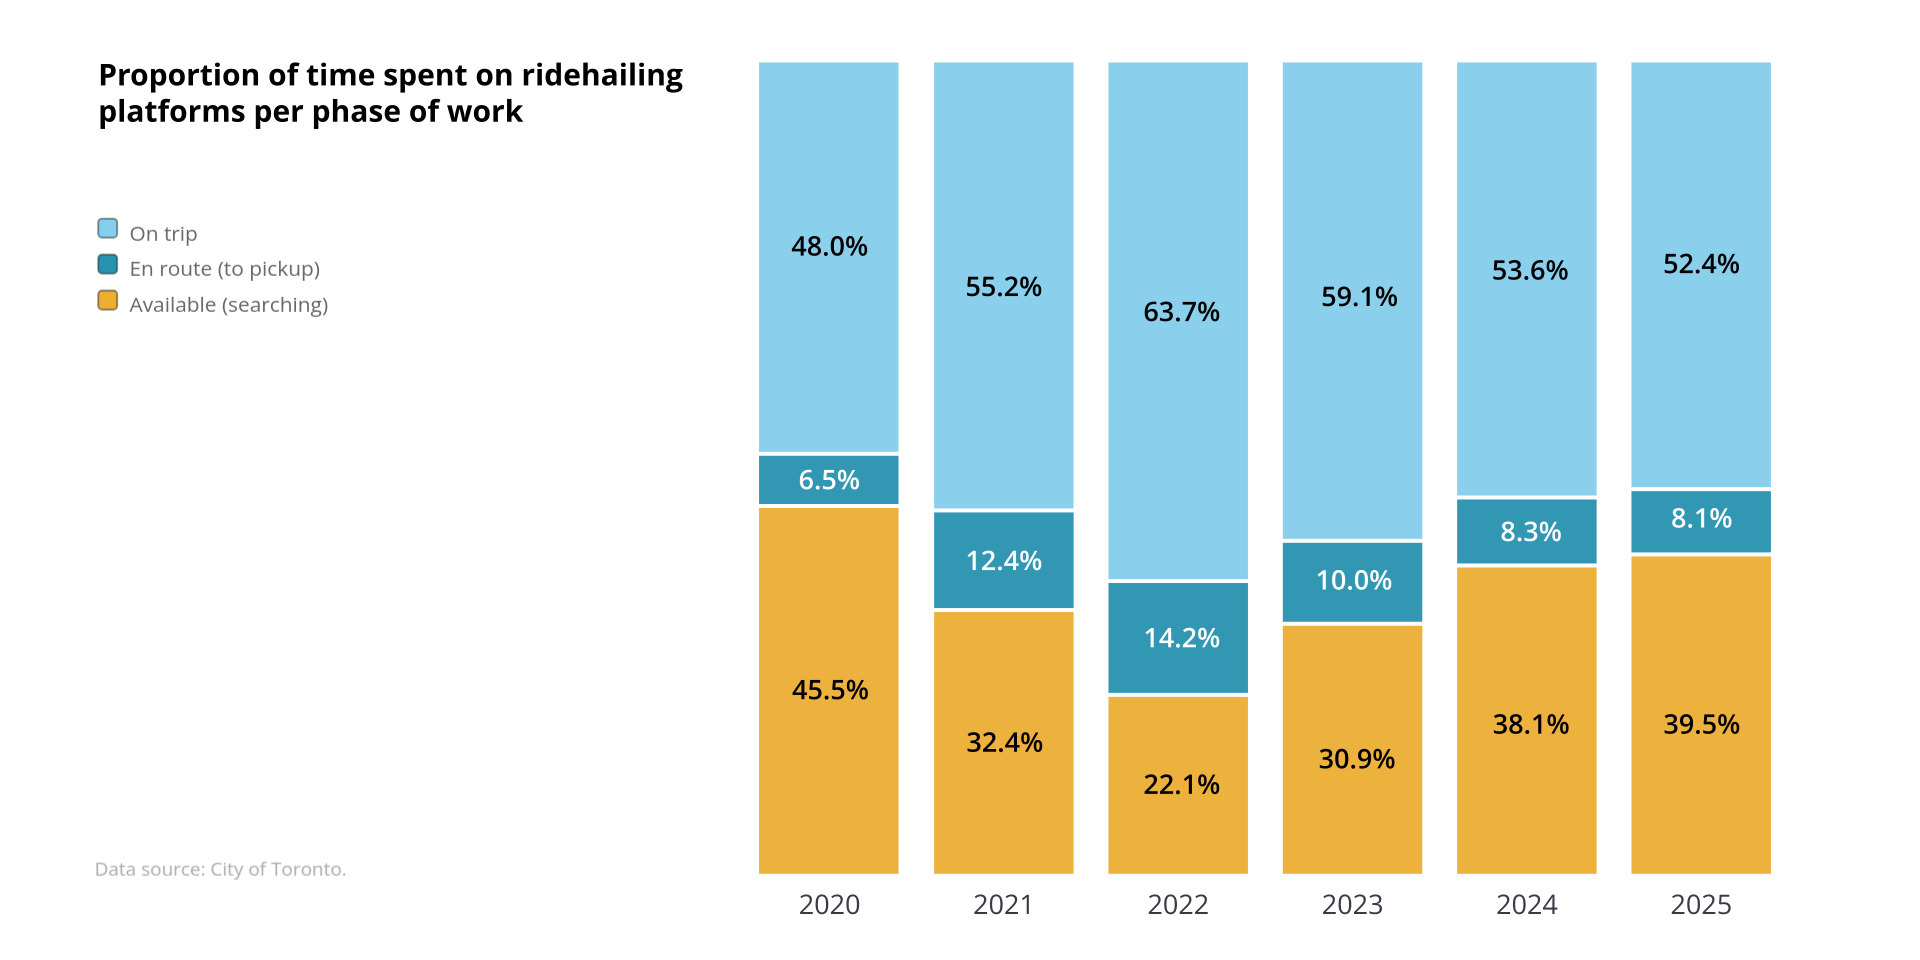
Beyond deadheading’s share of total VKT, the proportion of time drivers spend actually on trips is equally important, particularly for understanding drivers’ hourly earnings. Tracking how this proportion has evolved over time reveals shifts in the amount of in‑app time that is actually spent generating income. As shown in Figure 4, drivers spent only 48% of their in‑app time on trips in 2020, during the height of the COVID‑19 pandemic. This share rose in the following years, peaking at 63.7% in 2022, but has since steadily declined to 52.4% in 2025.
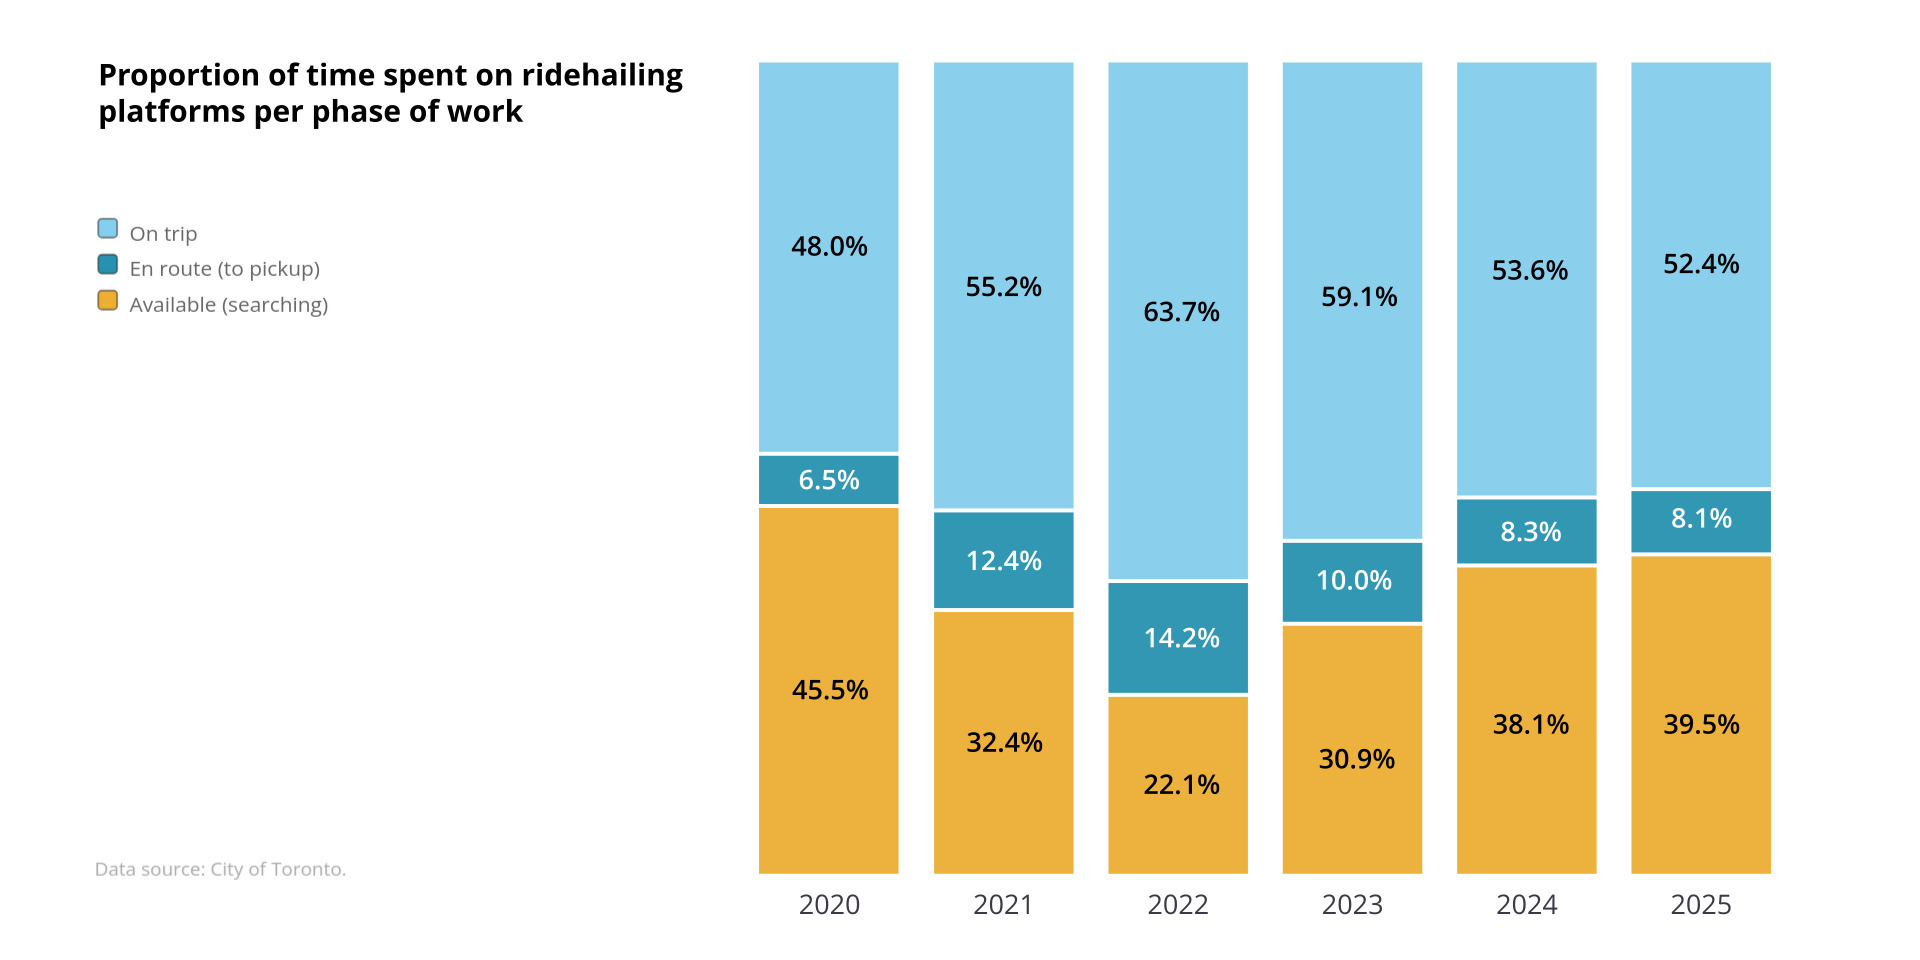
Because most ridehail platforms – including both operating in Toronto, when this data was collected – solely pay drivers for time spent on trips[3], any increase in deadheading, holding all else constant, effectively reduces their hourly earnings. To put this in perspective, at the 2022 deadheading rate of 36.3%, drivers earned income for roughly 38 minutes of every hour logged into the platforms, whereas using the 2025 deadheading rate, that paid time falls to 31 minutes per hour.
The precision and completeness of publicly available ridehail data in Toronto allow for a more accurate assessment of both the share of VKT and the proportion of time attributable to deadheading. In turn, this improves our understanding of deadheading’s implications for congestion and driver earnings.
Data availability
The data used in the study are available on the City of Toronto’s Open Data portal: https://open.toronto.ca/dataset/private-transportation-companies-vehicle-operating-data/. All the code used in this paper is available on the author’s GitHub repository at https://github.com/schoolofcities/ridehailing.
The data extends back to January 1, 2018, but records prior to 2020 lack sufficient detail to be usable for our analysis.
A portion of this added VKT would be offset if ridehailing passengers had chosen to drive themselves, as private-vehicle travel also includes VKT associated with the search for parking. Nevertheless, most estimates place cruising for parking at only 5–6% of vehicle trips (Weinberger et al. 2020), far below the levels observed for ridehail deadheading.
Drivers are also compensated while waiting at the passenger’s pickup location, although at a substantially lower rate than on trips. In this study, wait-time, which represents roughly 4% of total in-app time, was included within trip time to capture all periods of time which drivers earn income on the platforms.