

1. Questions
Aotearoa New Zealand (NZ) is one of the most car dependent countries in the world; 96 percent of households have access to a car. Alongside this 91 percent of distance travelled, and 83 percent of all trips in New Zealand are made by car or van (Waka Kotahi NZ Transport Agency 2019).
When transport costs increase, the financial burden of car dependency increases. Those who cannot afford the increased costs spend less on other items, such as food, home heating or healthcare (Martiskainen et al. 2023; Sovacool et al. 2023) or travel less, restricting their ability to participate in out of home activities.
The impacts of fuel price increases are spatially uneven (Dodson and Sipe 2007; Mattioli et al. 2023; Mattioli and Fischer 2024; Mattioli et al. 2018). A previous study in Ōtautahi Christchurch concluded that most households could either maintain or adapt to fuel price increases, though some peri-urban areas were at risk (Rendall et al. 2014).
Our research questions are:
-
What are the spatial patterns of vulnerability to motor fuel price increases in Aotearoa New Zealand?
-
How is vulnerability distributed across different socio-demographic groups?
2. Methods
We draw on established methods to calculate and index fuel price vulnerability at the Statistical Area 2 (SA2)[1] level as a function of three factors: exposure, sensitivity, and income (Mattioli and Fischer 2024; Mattioli et al. 2018).
Exposure
Exposure considers reliance on motor vehicle and therefore the level of susceptibility to fuel price changes, typically measured using metrics of car dependency, including household car ownership, proportion of travel by car and mode share or fuel expenditure (Mattioli et al. 2018). We use motorisation rate measured as the number of vehicles per 1000 population (Mattioli and Fischer 2024) (50%). A weighted proportion of work or education trips undertaken by car or van was also included in the exposure index (50%). These weights are defined as:
\[wTTWi = \frac{TTWi}{TTWi + TTEi}\]
\[wTTEi = \ \frac{TTEi}{TTWi + TTEi}\]
Where :
TTW = proportion of all trips to work that are made by car as driver or passenger
TTE – proportion of all trips to education that are made by car as driver or passenger
Exposure is expressed as:
\[Ei = 0.5Mi + 0.5(wTTWiTTWi + wTTEiTTEi)\]
Where:
M=motorisation rate
Sensitivity
Sensitivity considers the extent to which the population is affected by price change, often measured using socio-economic disadvantage, household income or unemployment (Mattioli et al. 2018). We use median household income from Census 2023 adjusted with regional equivalised values and cost of living, to reflect considerable disparities in housing costs between regions. We calculated the proportional difference between median household gross income and equivalised disposable income after deducting housing costs at the regional level and applied the difference to SA2 level median income (adjustments are in the Appendix)[2].
Adaptive capacity
Adaptive capacity refers to potential to reduce demand for fuel typically measured through access to public transport (Mattioli et al. 2018).
We calculated the number of public transport stops within an 800m (~10minute) walk of population weighted meshblock[3] centroids and then calculated the mean number of stops accessible from meshblocks within each SA2. We combine access to all stops with access to stops with a frequent service
Given the lack of public transport outside of main urban centres, we propose that proximity to services, even where public transport does not exist, is an important component of adaptive capacity. More accessible services means that people face shorter car-based travel distances. Furthermore, where people are able to access destinations closer to home, they may be able to adapt by walking or cycling.
We therefore use the access to service domain from the 2023 New Zealand Index of Multiple Deprivation (IMD). IMD measures the concentration of deprivation by small neighbourhood area and can be disaggregated into its component domains (Exeter et al. 2023). The access to services domain is an index of drive time-based accessibility to the nearest 3 of each of the following services: health, education, supermarket and service stations.
Adaptive capacity is:
\[ACi = 0.5Ai - 0.25PTi - 0.25PTFi\]
Where:
A = Access to services domain of the index of multiple deprivation
PT = Mean number of bus stops accessible within 800m from meshblock centroids within SA2
PTF = Mean number of bus stops with a frequent service accessible within 800m from meshblock centroids within SA2
The overall index can be expressed as:
\[VIi = \frac{Ei - Si + ACi}{3}\]
Table 1 details the components of the index and the sources of data.
We excluded SA2s with a usual resident population of less than 12 as they had missing data for other census variables. We also deleted SA2s with no IMD measure, typically oceanic or coastal inlet areas. The final dataset includes 2265 SA2s.
We analyse the index according to socio-demographic characteristics to understand how vulnerability is distributed across different groups. We consider the following socio-demographic characteristics: age, gender, ethnicity, disability (Census 2023) rurality (NZ Geographic Classification for Health (Whitehead et al. 2021), and area level socioeconomic deprivation based on the New Zealand Index of Deprivation (Atkinson et al. 2024).
3. Findings
Figure 1 shows the spatial distribution of the overall fuel vulnerability index, which can also be viewed as a web map. Rural and peri-urban areas are relatively more vulnerable to fuel price increases than main urban centres. 10.5% of the population in main urban areas are in the highest fuel vulnerability quintile (Table 2). Peri-urban or rural areas with high accessibility to urban centres are more likely to be in the highest risk quintile, with 38.8% of the population in these areas in VQ5 (Vulnerability Quintile 5). A smaller proportion of those in the most remote rural areas are in the most vulnerable quintile (16.8%), although over half of the population in remote rural areas are in the two most vulnerable quintiles. In absolute terms, there is a considerable number of people in the highest risk vulnerability index living in urban areas. Of 883,848 people in the most vulnerable quintile, 92% are in urban or peri-urban areas.
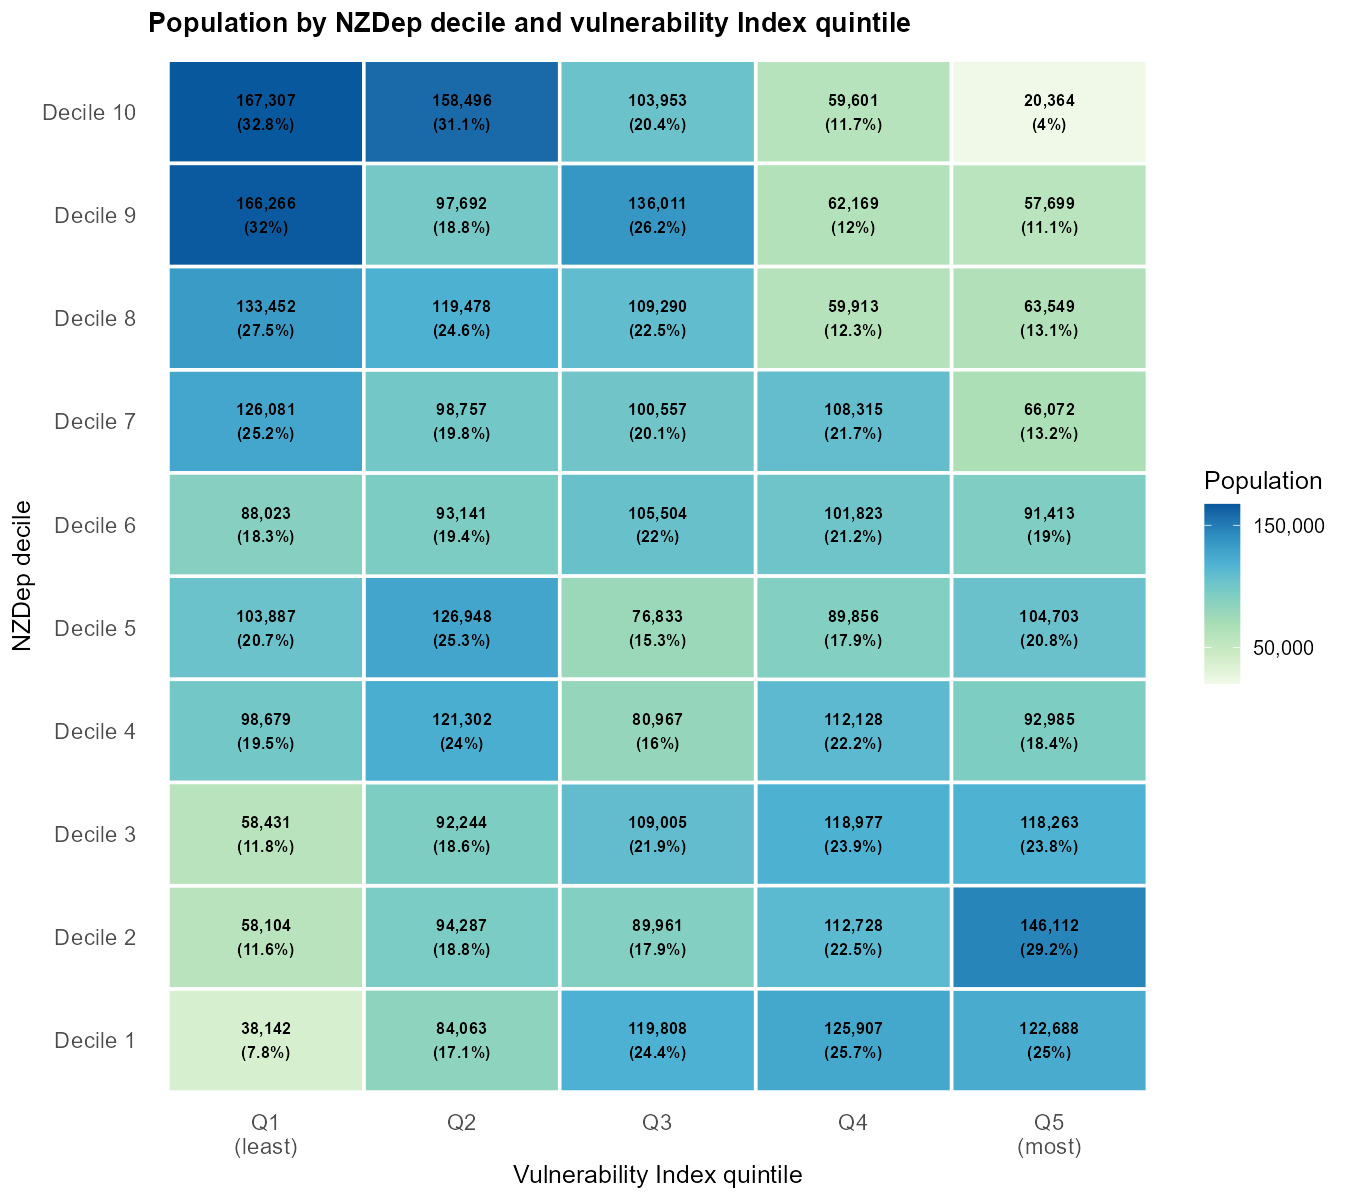
Those living in the most socioeconomically deprived areas are less likely to live in an area vulnerable to fuel price changes according to this index (Figure 3), as a result of proximity to services, including public transport, and slightly lower motorisation rates. Nevertheless, there are almost 200,000 people living in the most socioeconomically deprived areas (NZDep Deciles 9 and 10) who also live in areas most vulnerable to fuel price increases (VQ4 and VQ5).
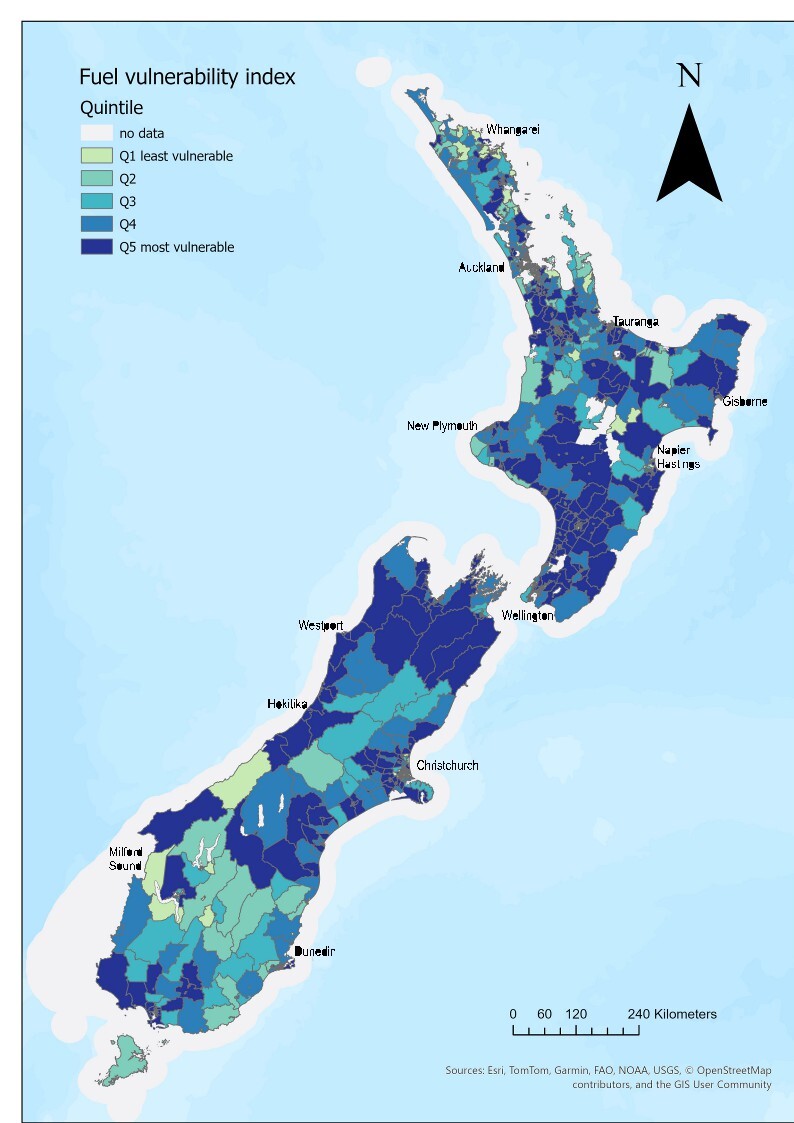
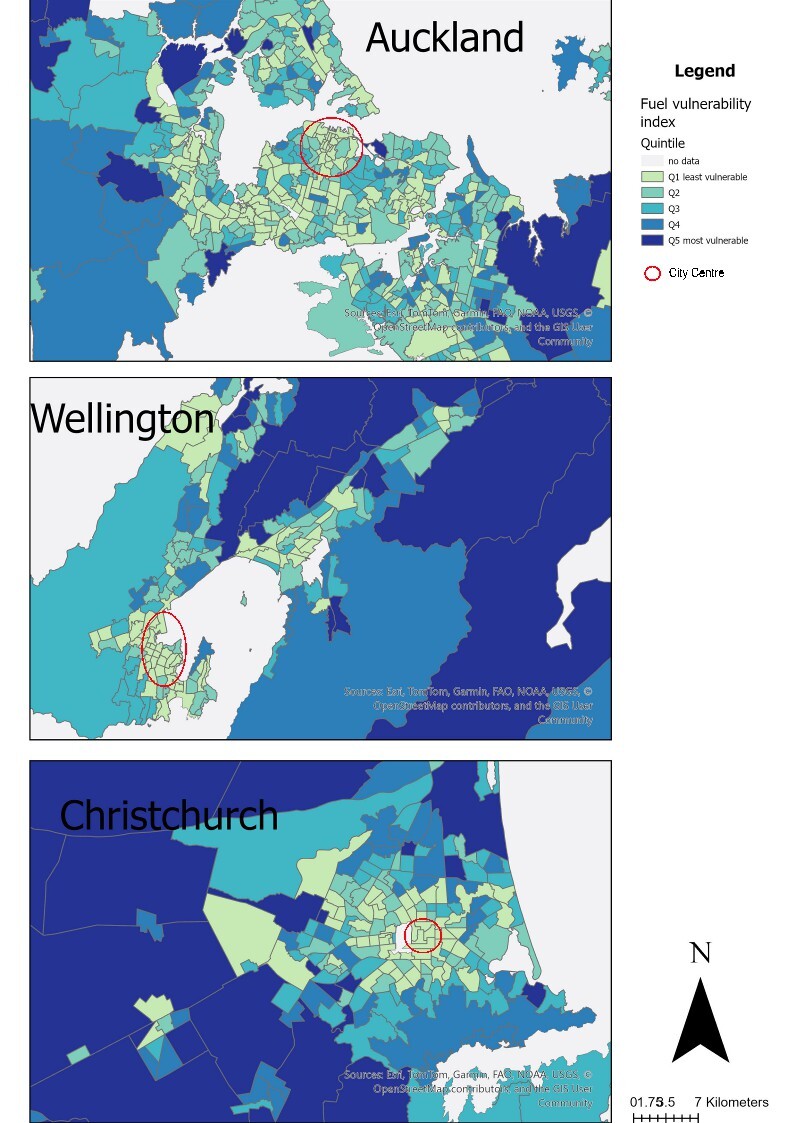

Table 2 shows the distribution of fuel vulnerability quintiles by age, gender, ethnicity, rurality and disability.
Both younger (<15 years) and older (≥ 65 years) age groups are more likely to live in areas more vulnerable to fuel price increases. However, the median age increases across vulnerability quintiles, indicating that fuel price vulnerability may have a particularly large impact on older New Zealanders. Both European and Māori ethnic groups are substantially more likely to live in more areas with high vulnerability to fuel prices than other ethnic groups[4], likely reflecting the urban social geography. There are no notable differences in spatial vulnerability between disabled and non-disabled populations or by gender.
While the most urban (U1) areas of NZ had the highest proportion of residents living in areas of low fuel price vulnerability (VQ1), a high proportion of residents in Urban 2 (U2, provincial centres), Rural 1, and Rural 2 areas lived in VQ5 areas of highest fuel price vulnerability. This likely reflects higher levels of motor vehicle reliance, lower levels of income, and the lack of available public transportation in rural and regional NZ, as well as longer travel times to services. Interestingly, the most remote communities (R3) had a relatively low proportion of people living in VQ5 areas of high fuel price vulnerability. This may reflect the strong relationship between socioeconomic deprivation and remoteness in NZ (Whitehead et al., 2024), and potentially lower rates of motor vehicle ownership in areas of high socioeconomic deprivation. Figure 3 suggests an inverse relationship between socioeconomic deprivation and the Fuel Vulnerability Index, potentially because car ownership is component of NZDep. In NZDep low car ownership is associated with higher levels of socio-economic deprivation, whereas in our index, households relying on car use are more vulnerable. This relationship could be further explored in future research.
Further, the indicator is an area-based measure of vulnerability to change in fuel prices in terms of the affordability of car use. Some populations in “less vulnerable” areas are likely to already have suppressed travel because of low motorisation and affordability difficulties – but may be in areas of high socio-economic disadvantage. Although we presented the distribution of the vulnerability index across different socio-demographic groups it is important to note that distributional analyses do not account for pre-existing injustices. Just because a particular group is less vulnerable to change, potentially because of reduced car reliance, does not mean that they are not transport deprived already because of limited car use.
As an area-based index, we present area level vulnerability but note that does not necessarily apply equally to individuals within those areas. For example, Adaptive capacity is based on spatial access to destinations or the public transport network, not on individuals’ capacity to adapt based on socio-demographic circumstances. While the results show that disabled people are no more likely to live in areas that are most vulnerable to fuel price changes, the index does not account for social variations in adaptive capacity, and some disabled people may find it harder to use public transport.
Also important to note is that this is a relative index, showing areas that are most at risk. Being least vulnerable does not mean people living in those areas are not impacted by fuel price increases, but that relative to other areas, they may be less likely to experience the worst effects. However, as already noted, New Zealand is highly car dependent, meaning most people are likely to face some impacts.