
1. Questions
Strategic freight transport planning requires internalizing environmental externalities, yet few frameworks quantify how carbon costs reshape infrastructure efficiency under uncertainty. We address this gap by asking:
-
How does introducing a $50/ton CO₂ shadow price affect the Z-number DEA efficiency scores and rankings of the 59 candidate Logistics Centers (LCs) in Iran’s multimodal freight transport network?
-
To what extent do modal characteristics—particularly the rail-to-road freight share—explain variations in efficiency changes after carbon cost internalization?
-
How robust are the carbon-adjusted efficiency rankings under uncertainty in emissions estimation and transport demand, as represented through the α-cut and Z-number reliability structure?
-
How are carbon-induced efficiency gains and losses spatially distributed across Iran’s national freight transport network?
These four questions are designed to progressively move from (1) direct empirical measurement of carbon pricing impacts on efficiency rankings, to (2) identification of the mechanism (modal split), to (3) testing the robustness of results under uncertainty, and finally to (4) maps the spatial distribution of efficiency gains and losses across the national network. This structure ensures that findings in Section 3 directly corresponds to research questions.
2. Methods
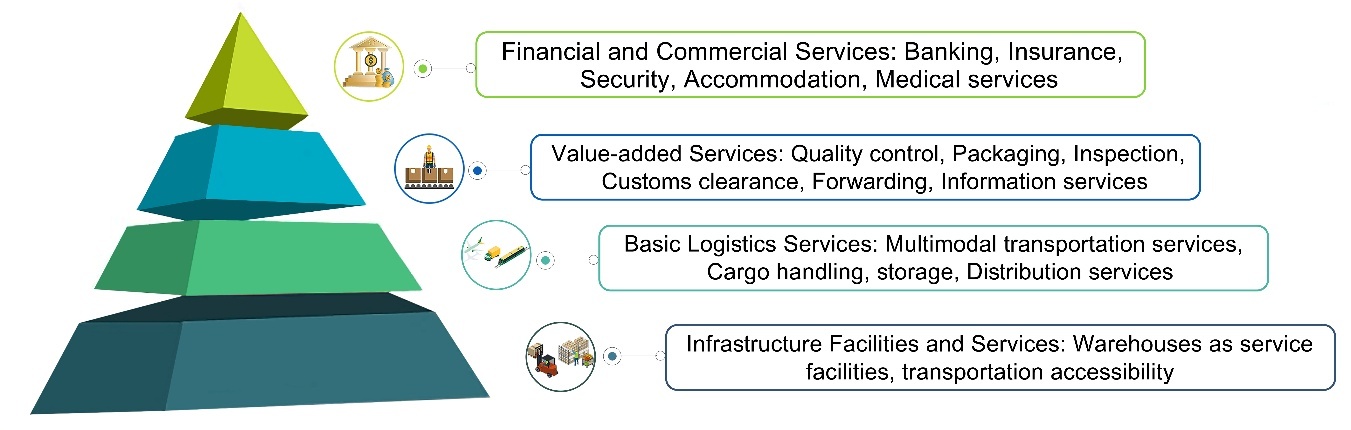
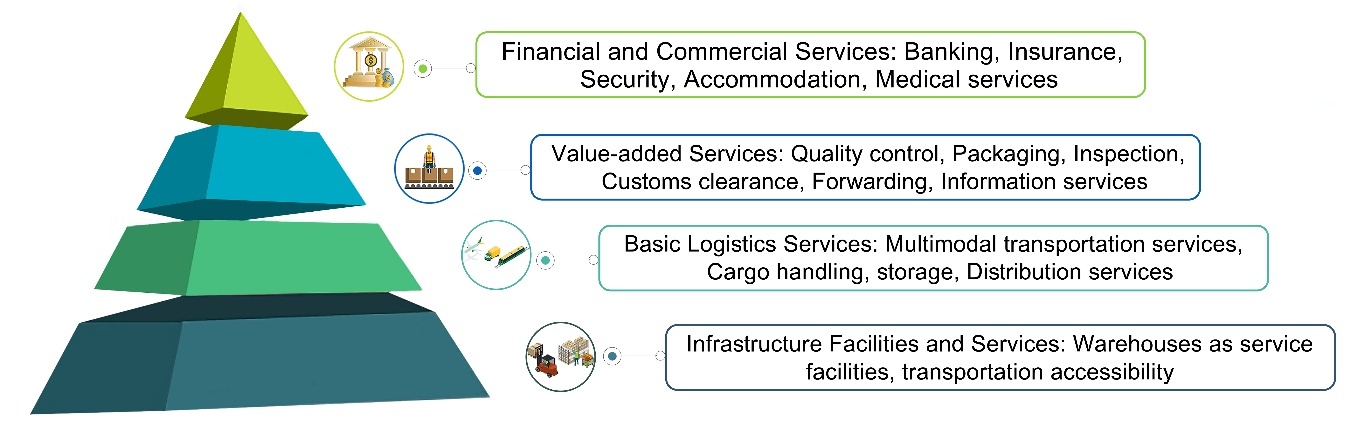
Data and Scope. We analyze 59 Logistics Centers (LCs) across Iran, including 29 Logistics Cities (LCIs) and 30 Logistics Villages (LVIs). Each LC is characterized by location, throughput, and modal split. Demand allocation derives from 124 customer zones within a national freight distribution network (Ministry of Roads and Urban Development of the Islamic Republic of Iran 2019). The two LC types perform complementary roles in hub-and-spoke freight transport structures and corridor-based logistics flows ((Roso 2008); Table 1 and Figure 1).
Carbon Intensity Calculation. For each LC, CO₂ intensity (g CO₂/ton·km) was computed using the Global Logistics Emissions Council (GLEC) Framework v3.0 factors: road = 62 g/ton·km, rail = 24 g/ton·km, weighted by each site’s modal mix. Annual CO₂ emissions (ktons) = intensity (g/ton·km) × throughput (tons) × haul distance (km) / 10⁶.
Carbon Cost Integration. A shadow price of $50/ton CO₂—aligned with the World Bank’s 2024 Guidance Note on Shadow Price of Carbon in Economic Analysis and Iran’s climate policy benchmarks—was applied to annual emissions to derive an annual carbon cost (M), introduced as an additional undesirable fuzzy input (A-component) in the Z-number DEA model, capturing environmental externalities in freight transport decision-making. The reliability component (B = 0.85) reflects uncertainty in emission estimation and transport demand variability.
Z-number DEA Specification. We employ a Z-number DEA framework (Azadeh and Kokabi 2016) that incorporates both data imprecision and estimate reliability. Following Zadeh (2011), each variable is represented as a Z-number pair (A, B), where A is the fuzzy value and B is the reliability score. For computational efficiency, we convert each Z-number to a weighted fuzzy number (Wang and Chin 2011) by multiplying A by B. The reliability component B = 0.85 is applied to carbon cost estimates.
Output-Oriented BCC-DEA with
The efficiency score for each at a given level is obtained by solving:
\[{Min\ \theta}_{j}(\alpha)\]
\[s.t.\]
\[\sum_{k}^{\mathstrut}\lambda_{k}X_{ik}(\alpha) \leq \ \theta_{j}(\alpha).X_{ij}(\alpha)\ \forall i\ (inputs)\]
\[\sum_{k}^{\mathstrut}\lambda_{k}Y_{rk}(\alpha) \geq \ Y_{rj}(\alpha)\ \forall r\ (outputs)\]
\[\sum_{k}^{\mathstrut}\lambda_{k} = 1,\ \ \lambda_{k} \geq 0\]
where for inputs, and for outputs. The original inputs cover economic, financial, and climatic dimensions (see Table 2).. The outputs capture demand potential, service requirement, and social benefit. The intensity variables represent the contribution of peer to the efficiency frontier. Carbon cost enters as an undesirable fuzzy input in the carbon-adjusted scenario, allowing the model to evaluate trade-offs between economic efficiency and transport-related emissions. Uncertainty is handled via α-cut at α = 0.01; the lower bound reflects conservative transport assessment under uncertainty. Following output-oriented BCC-DEA convention (Charnes et al. 1978), scores greater than 1 indicate inefficiency (proportional output expansion needed). For the carbon-adjusted scenario, carbon cost enters as an additional undesirable input.
DEA Indicators
Within DEA framework, criteria that contribute positively to regional logistics suitability are classified as outputs, whereas variables imposing operational or environmental constraints are considered as input variables. Relative humidity is included as an environmental constraint in the model due to its recognized impact on warehouse durability, climate-control energy demand, and packaging integrity. This approach aligns with broader IPCC assessments on the vulnerability of infrastructure systems to climatic stressors (IPCC 2022). The selected indicators were limited to variables with nationally consistent spatial coverage across all candidate logistics centers. Future studies may incorporate additional climate-related indicators such as temperature variability, flood exposure, or extreme heat risk. The specific input and output indicators are detailed in Table 2. The choice of indicators may be adapted based on data availability in different country contexts, enhancing the framework’s transferability across emerging economies.
Replication. All Python code, Z-number DEA specifications, and synthetic logistics dataset are provided in Supplemental Information. Raw data are restricted due to confidentiality agreements with national transport authorities; researchers can apply provided code to their own regional transport data.
Model Parameters. Key parameters and data sources are summarized in Table 3.
3. Findings
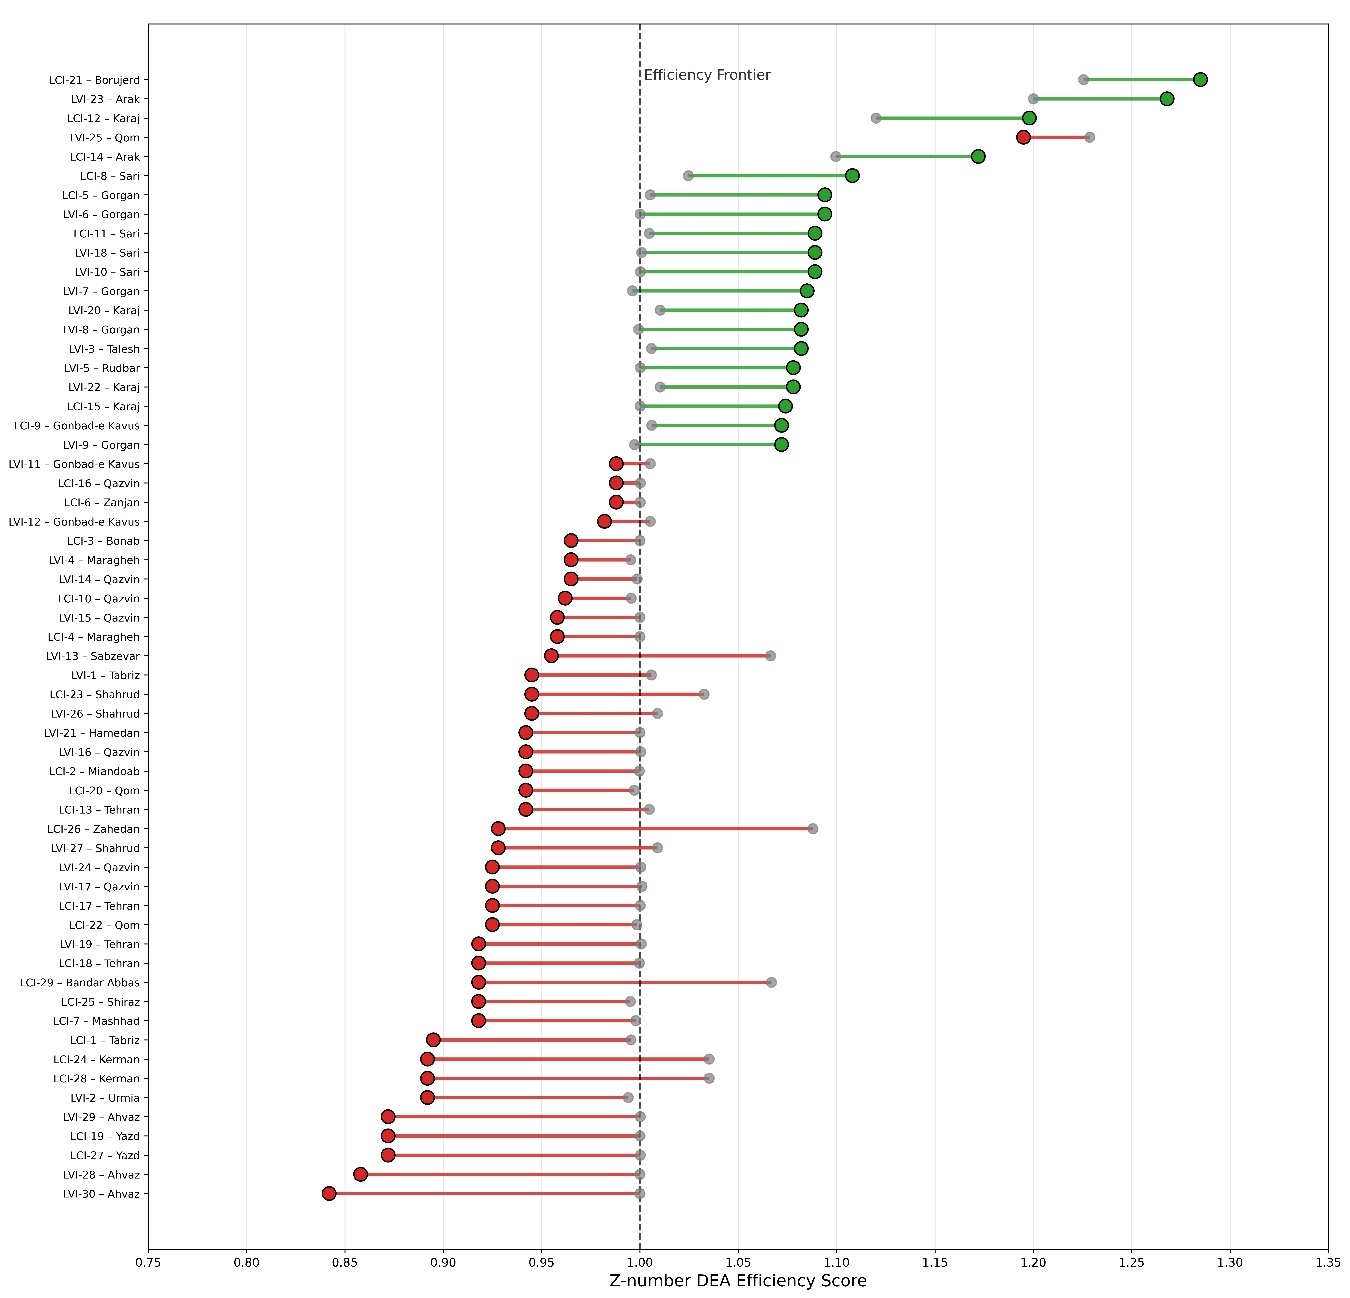
Rank Shifts and Score Changes. After carbon adjustment, 45% of LCs (27/59) changed rank by ≥ 5 positions. Rail-dominant sites improved their rankings: Gorgan (rank change +5, score +8.9%), Sari (rank change +4, score +8.1%), Rudbar (rank change +3, score +7.8%). Conversely, road-dependent hubs lost rank positions: Ahvaz (rank change -28, score -15.8%), Bandar Abbas (rank change -24, score -14.0%), Zahedan (rank change -22, score -14.7%). This confirms that modal structure critically determines freight transport efficiency rankings under carbon pricing (Figure 2).
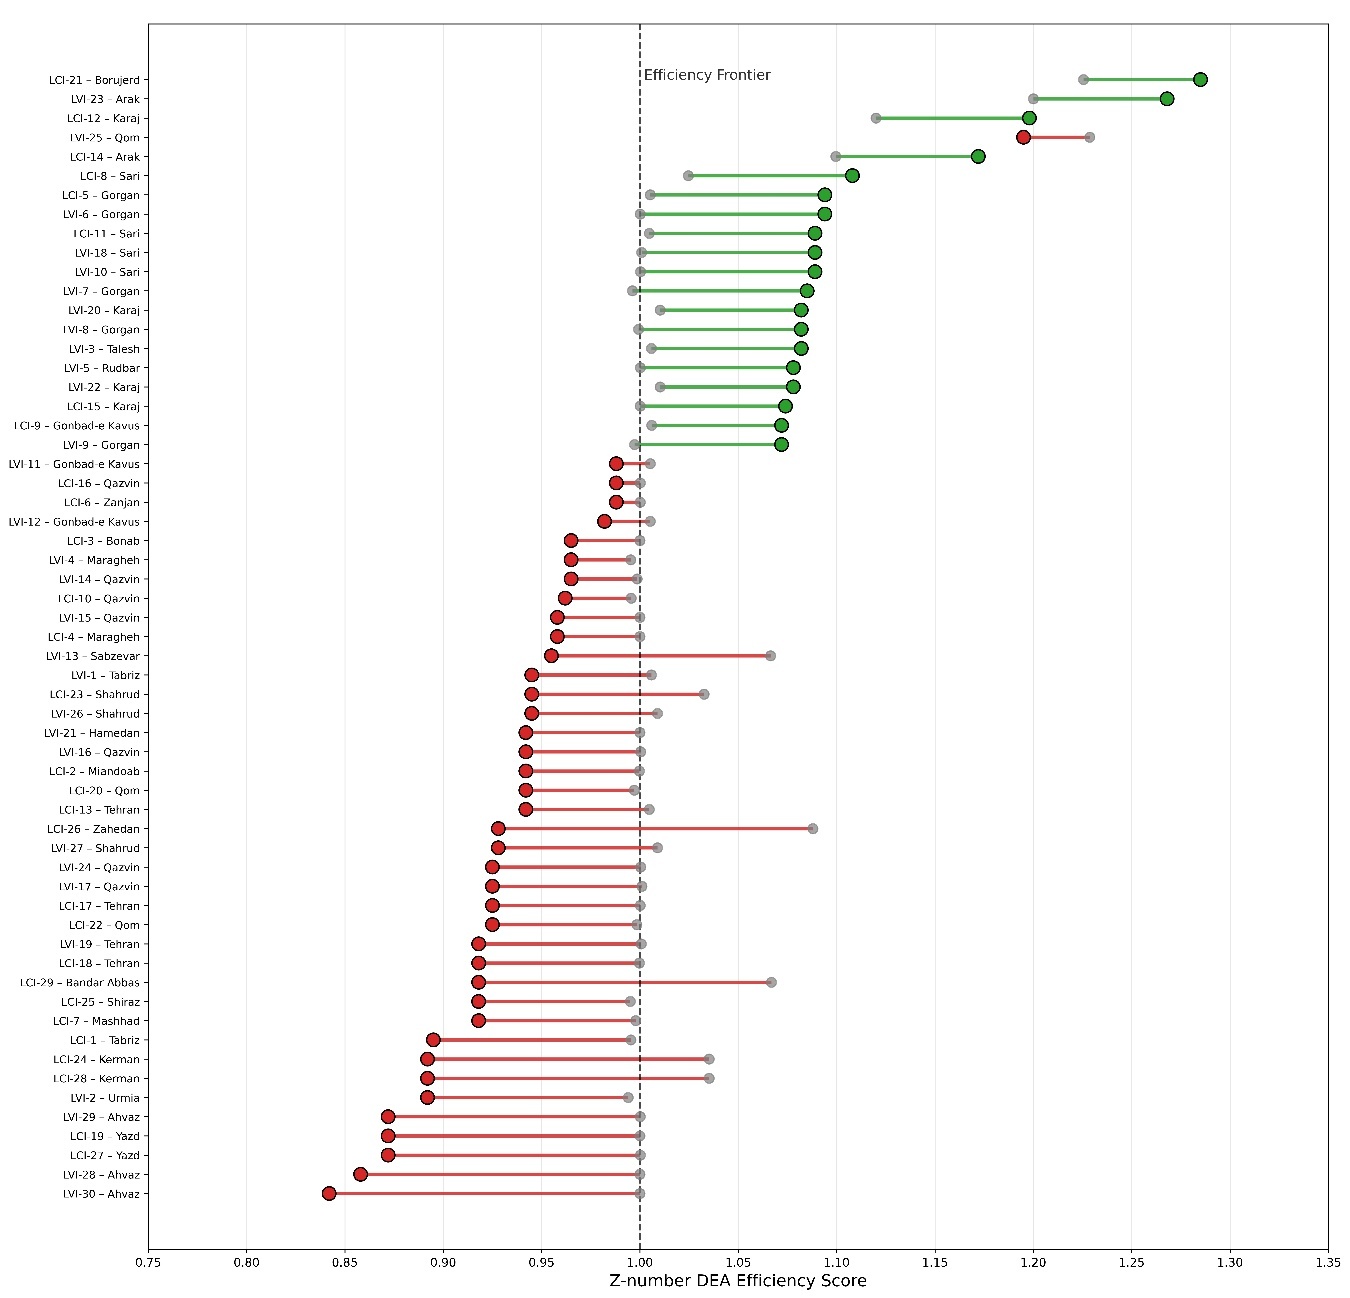
Modal Share Correlation. Rail share strongly correlates with rank change (Pearson r = -0.94, p < 0.001). Freight systems with higher rail share are more carbon-efficient and economically resilient under carbon pricing. Sites with rail share ≥ 80% (n=14) gained an average of +4.2 ranks; those with rail share ≤ 40% (n=11) lost an average of -16.3 ranks. This pattern confirms that modal composition governs environmental and economic performance in freight transport systems (Figure 2).
Top Performer Stability. Karaj (LCI-12), baseline #1 (85% rail, score 1.120), retained its #1 position after carbon adjustment, with its score increasing to 1.198 (+7.0%). The top-five post-adjustment ranks are all held by LCs with rail share ≥ 75%, indicating that high-efficiency hubs with strong rail connectivity remain robust under environmental cost internalization.
Sensitivity and Robustness. Varying the uncertainty parameter α from 0.01 to 0.10 altered absolute scores by ≤ 3.2% but preserved the rank order of the top-10 rail-intensive LCs. The correlation between rail share and rank change remained strong (r ∈ [-0.91, -0.96]) across all α values, with r = -0.94 at α = 0.01, indicating that the core finding is robust to plausible variations in uncertainty modeling.
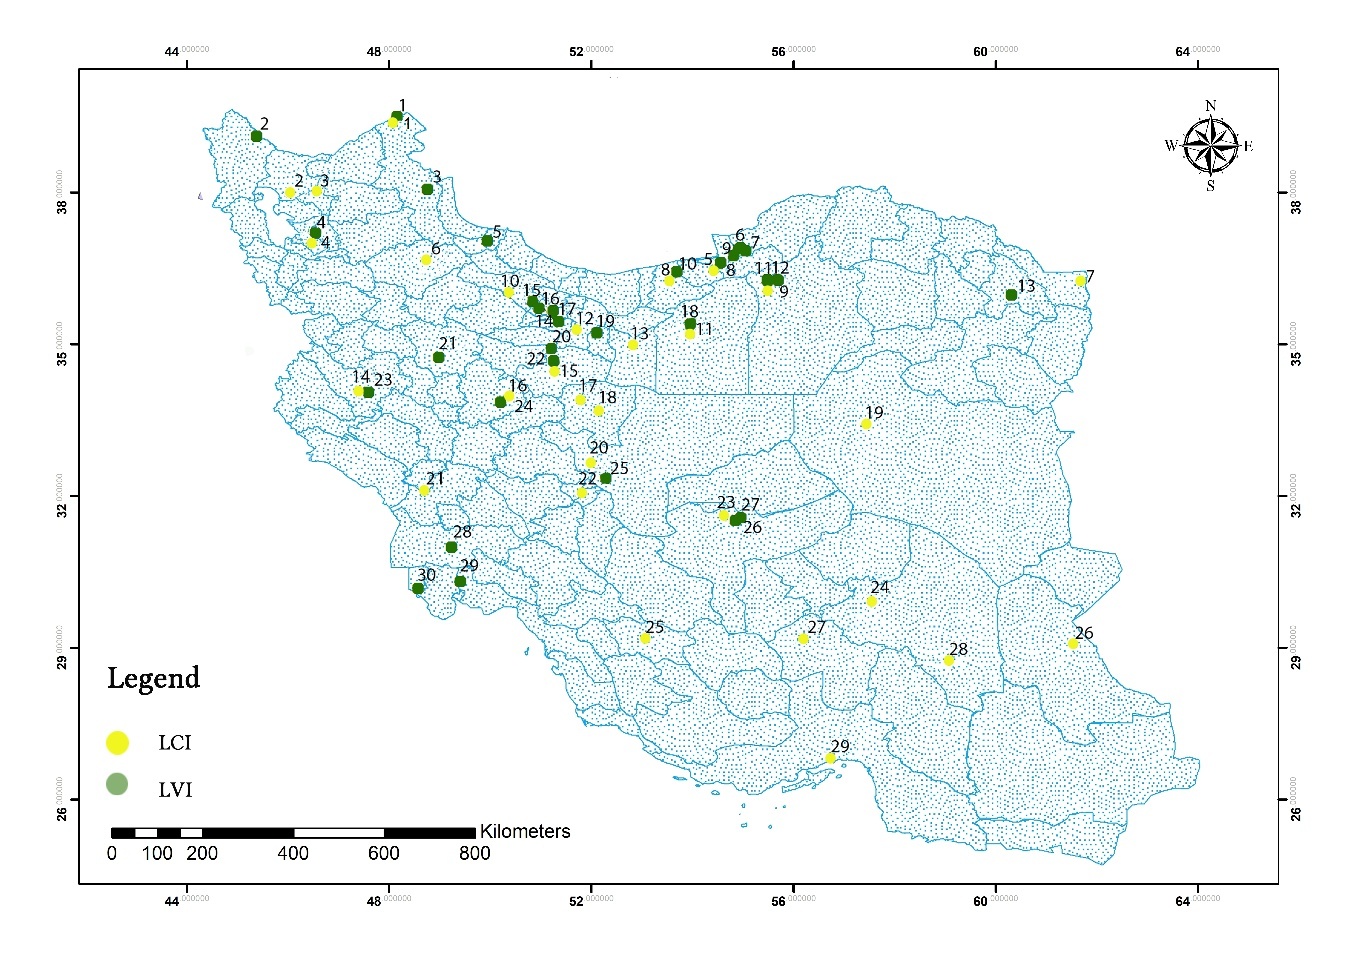
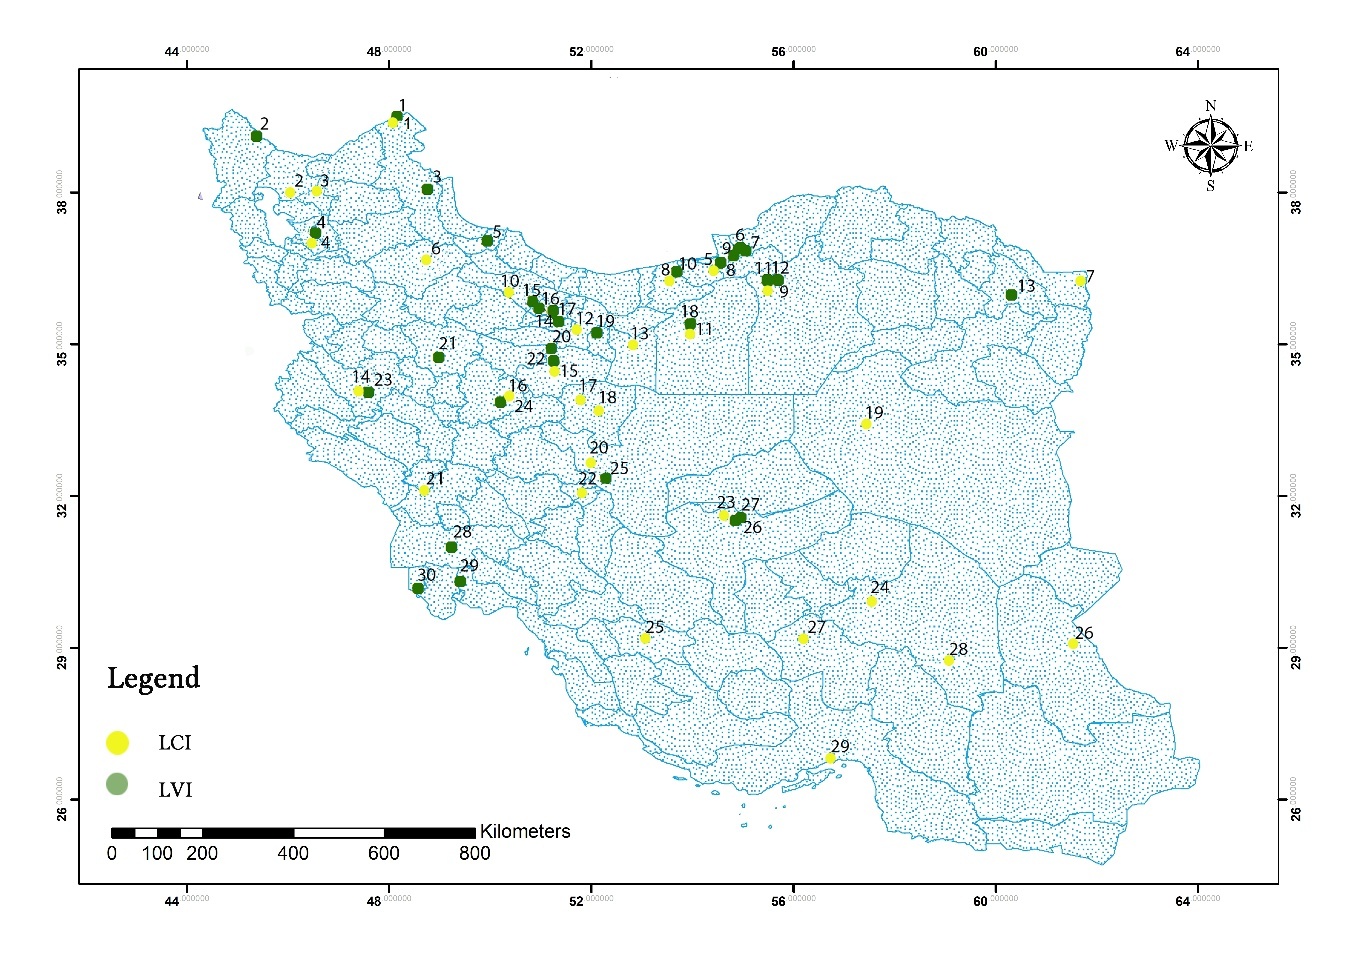
Spatial and Structural Synthesis. Building on the observed rank shifts (45% of LCs changing by ≥5 positions), gaining sites cluster in northern and northwestern Iran, where historical rail connectivity to agricultural production zones corresponds with lower carbon intensity. Losing sites concentrate in southern and southeastern corridors, where road dominance persists despite strategic port access (Figure 3). This spatial divergence corresponds directly to modal composition: sites with ≥ 75% rail share consistently retain or improve rankings, while road-dependent nodes (< 40% rail) exhibit compounded efficiency penalties. The consistency of these patterns across all α-cut specifications (α ∈ [0.01, 0.10]) confirms that the observed rank shifts are structurally determined by modal mix rather than transient cost fluctuations. These findings quantify how carbon cost internalization systematically differentiates infrastructure performance across Iran’s multimodal freight network, providing a transparent baseline for resilience-aware assessment under uncertainty.
Acknowledgements
The authors thank the journal editors and anonymous reviewers for their constructive feedback.