1. Questions
How responsive is bus ridership to fare changes in a large Brazilian city after the pandemic? Short-run urban transit price elasticities cluster between and with central values around to (Goodwin 1992; Balcombe et al. 2004; Paulley et al. 2006; McCollom and Pratt 2004). I test the hypothesis that bus demand in Belo Horizonte sits at the lower, most inelastic end of this range, conditional on two system features: heavy reliance on captive users with limited modal alternatives, and electronic payment in over 80 percent of transactions.
Between January 2022 and March 2026 the city’s two tariff groups, Trunk and Circular/Feeder, followed distinct fare paths. In July 2023 the Trunk fare was cut 25 percent (R$ 6.00 to R$ 4.50) by litigation and a subsidy decision rather than by demand, while the Circular fare held, leaving the Circular group as a contemporaneous within-system control.
2. Methods
Data are the monthly operational reports of the Belo Horizonte bus regulator (SUMOB): 51 consecutive months from January 2022 to March 2026, with line-month ridership for all regular and bus rapid transit lines (16,783 observations across 355 lines) and system aggregates such as fleet, trips operated, and revenue. Fares are observed by tariff group and deflated to constant prices by the Brazilian national consumer price index (IPCA), with January 2022 as the base. The system charges a single per-boarding fare with no daily, weekly, or monthly pass; over 80 percent is paid by smart card.
Table 1 lists the six fare adjustments with contemporaneous fleet and trips. Fleet and trips operated were essentially unchanged around the July 2023 cut, so the estimate does not capture a service expansion; the cut came within a broader contract reform (per-kilometer remuneration, fleet renewal, expanded gratuities) applied across the network and absorbed by the within-system control.
The Trunk group aggregates diametrical (DI), semi-express (SE), perimetral (PE), radial (RA), bus rapid transit (MOVE), trunk-express (TO), station-gate (BLQ), and direct-radial (RD) lines; the Circular/Feeder group aggregates feeder (AL), downtown-circular (CI), and metro-feeder (AM) lines. VF (Vilas e Favelas, a low-income periphery service) and EC (executiva, a premium service suspended in the period) lines are excluded: the 14 VF lines, about 4 percent of lines and 1 percent of boardings, have carried no fare since April 2023 and so offer no price variation to identify a response; the post-April 2023 indicator absorbs that regime and their small share makes any spillover onto the estimated lines negligible.
The preferred specification is a line-level panel with line fixed effects:
log(Plt)=αl+βlog(τg(l)t)+γRt+δt+12∑m=2θmDmt+εlt,
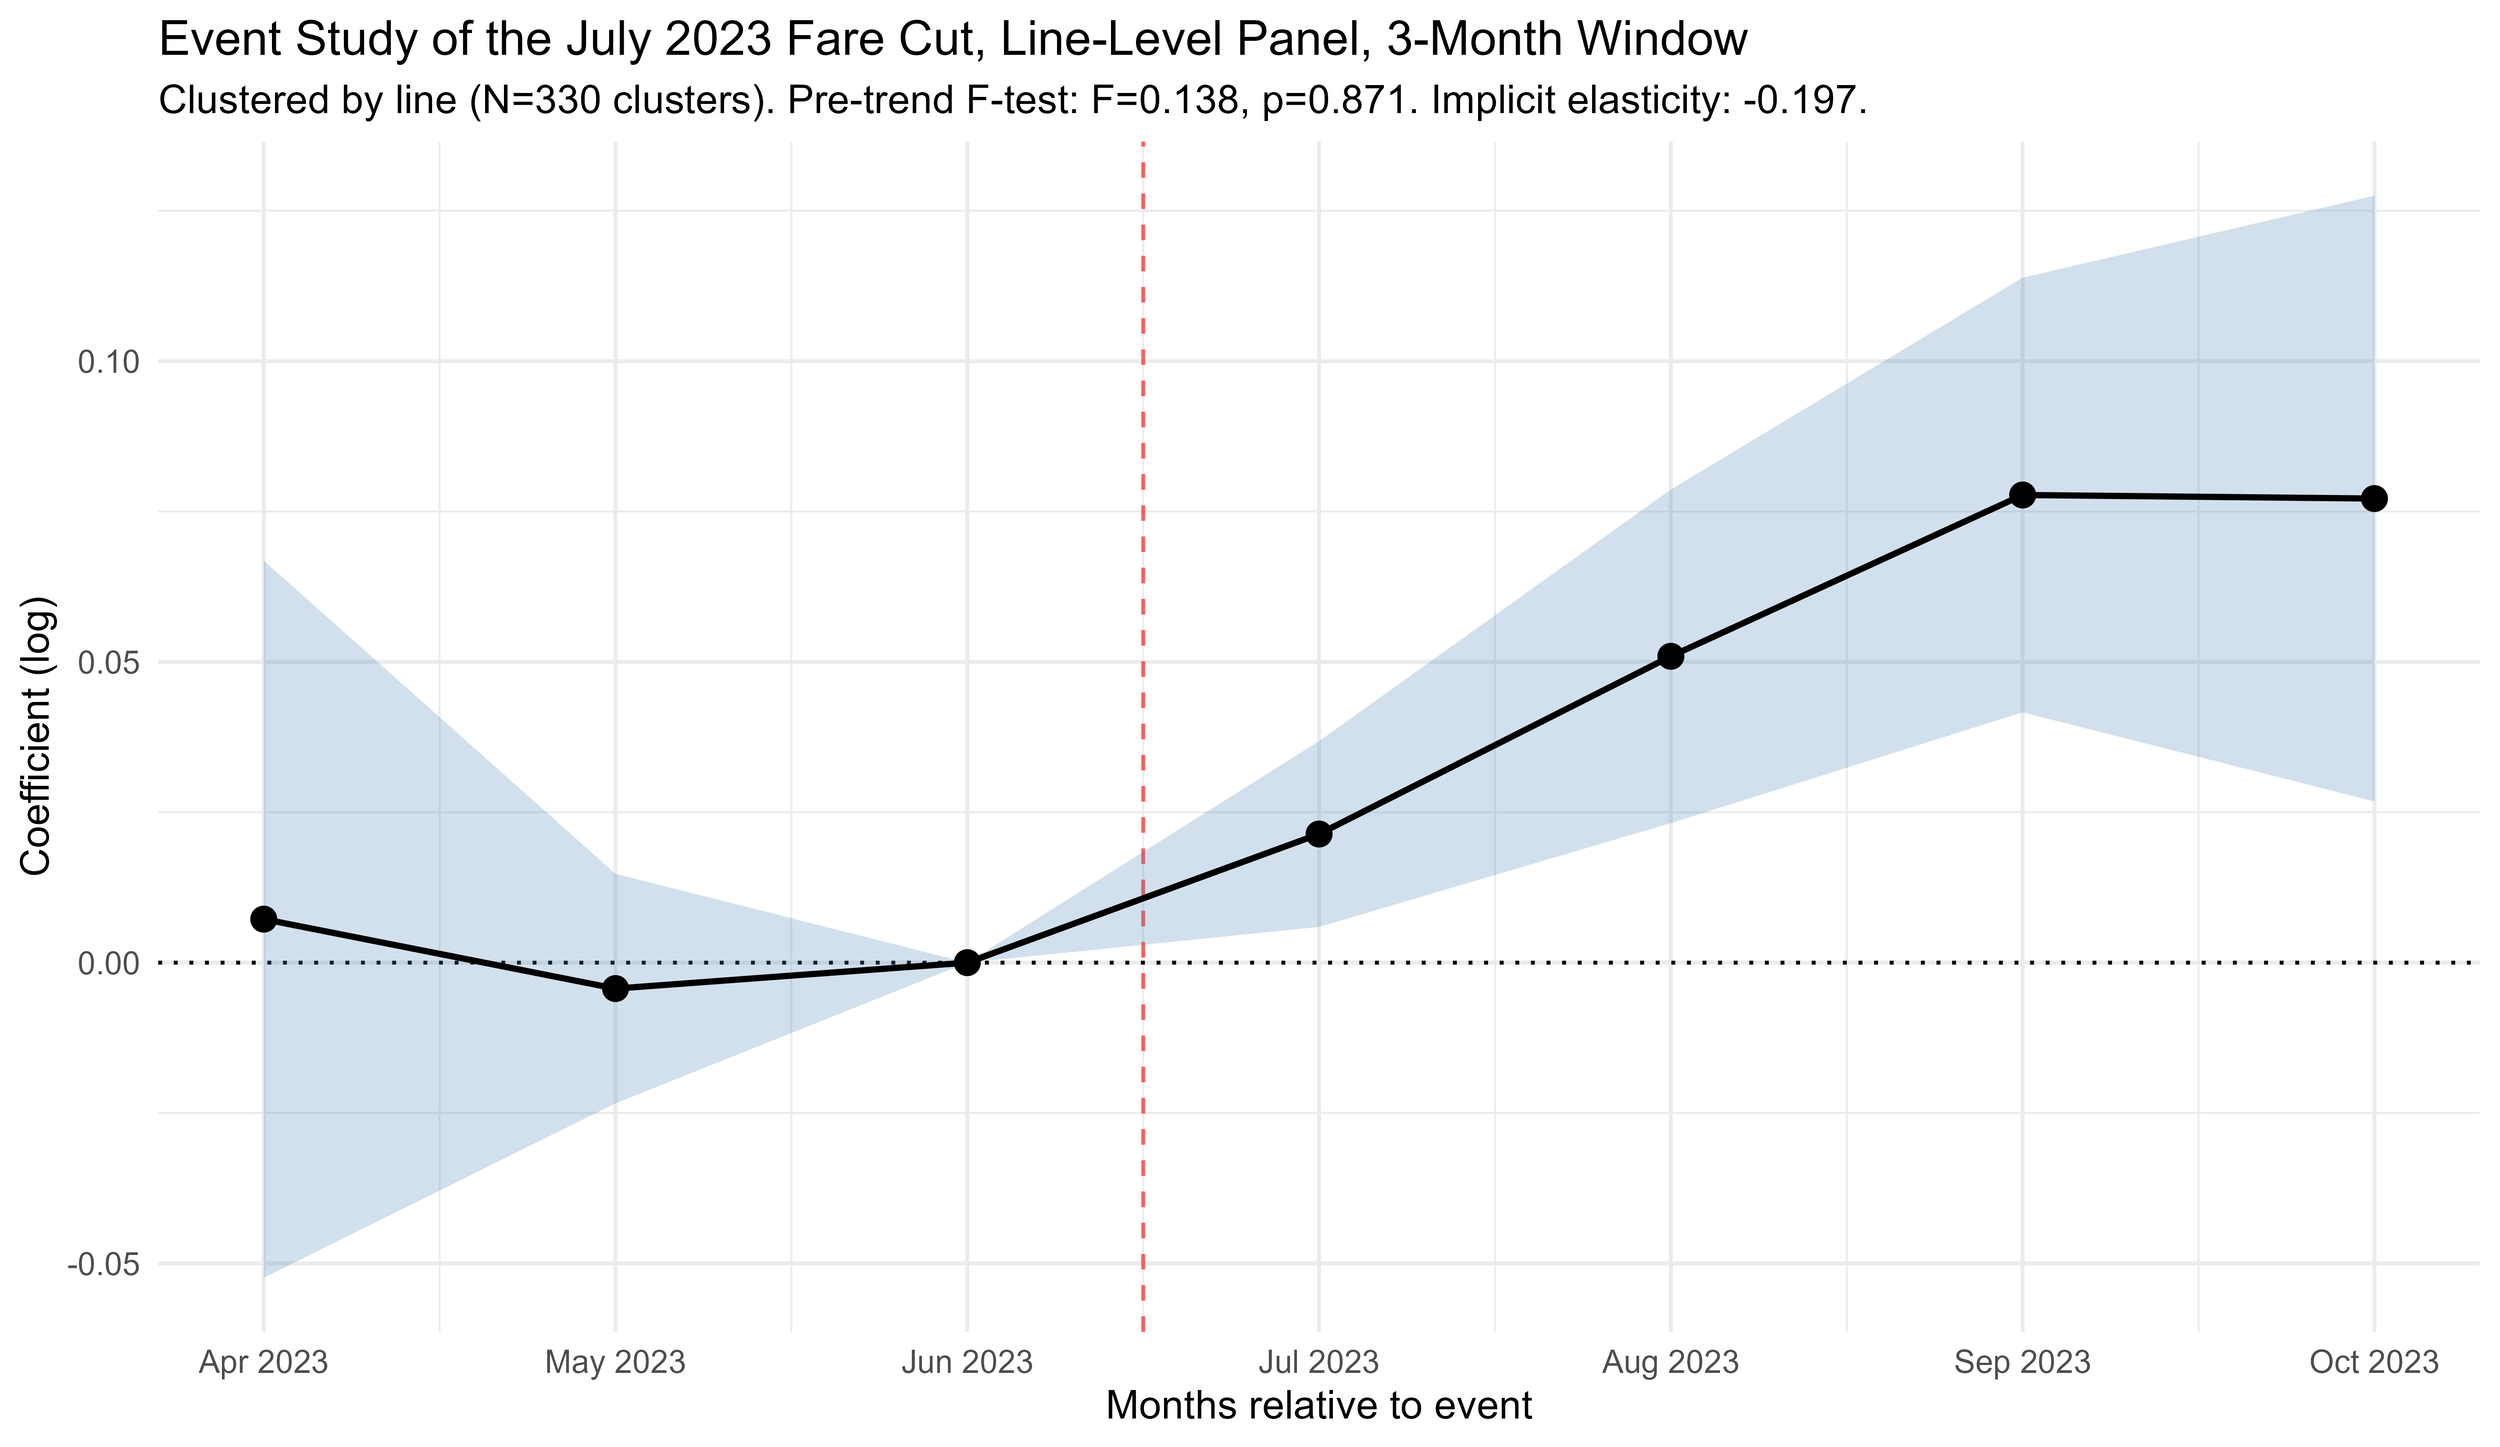
where is monthly passengers on line in month the real fare of its tariff group, the post-April 2023 zero-fare regime indicator, a linear trend, and month-of-year dummies; standard errors are clustered by line (355 clusters) and is the elasticity. A three-month event study centered on the cut is the causal benchmark: the narrow window isolates July 2023 from the April 2023 adjustment that raised both groups, and a placebo centered on July 2024 (stable fares) tests for spurious effects. Six aggregate specifications serve as cross-checks.
The two groups share the same regulator, operators, and integrated network, so the within-system comparison differences out the macroeconomic, seasonal, and post-pandemic shocks common to both. They differ in network function, route length, and frequency, but these fixed differences load on the line fixed effects, not on which is identified from the differential fare change. Identification rests on common trends, which the event study supports (parallel pre-trends
3. Findings
The line-level panel gives a short-run own-price elasticity of (clustered SE line-months, 355 clusters), and the event study gives (parallel pre-trends Six aggregate specifications span to so the central estimate is about It is robust: adding trips-operated and fleet controls leaves the aggregate at (SE and dropping the month dummies from the line panel gives (SE both inelastic and significant. A placebo event study on July 2024 returns noise around zero, unlike the monotonic post-treatment rise in the real window.
Pre-event coefficients are statistically indistinguishable from zero; post-event coefficients rise monotonically to about percent in log ridership three months after the cut (Figure 1). Dividing the average post-treatment effect by the log change in nominal fare yields
__differ.jpg)
By service type (Table 2), the bus rapid transit corridor (MOVE) responds at more than double the system average, while the diametrical lines (DI), over a third of ridership, are essentially inelastic feeder, semi-express, and radial lines sit near the average. These estimates are exploratory: those on small shares (Perimetral and Direct Radial, together under 4 percent of ridership, and the imprecise Metro Feeder) likely reflect within-system reclassification or noise rather than genuine responses, and are not interpreted further. The robust pattern is the contrast between the elastic rapid-transit corridor and the near-inelastic high-volume diametrical lines.
Acknowledgements
The data extraction routines, exploratory analysis, and successive drafts of this manuscript were developed with the assistance of ClaudeAI (Anthropic). The AI tool supported coding, table generation, and prose refinement. The research questions, identification strategy, interpretation of findings, and final manuscript content are the responsibility of the author. The author declares no financial or other conflicts of interest. No external funding supported this research.