1. Questions
The number of road traffic deaths in Japan has fallen in recent years. According to the National Police Agency (2026), annual road traffic deaths (within 24 hours of the accident) declined from 16765 in 1970 to 2547 in 2025. Despite this progress, pedestrian accidents involving children remain a particular concern. A pronounced peak in accident rates has been observed for children of age seven. Children reach this age in Grade 1 of elementary school. According to the Public Relations Office of the Government of Japan, between 2021 and 2025, Grade 1 pupils were about 2.5 times more likely than Grade 6 pupils to be killed or seriously injured while walking (Public Relations Office 2026). This concept of a ‘critical age of seven’—heightened vulnerability of first graders to traffic environments—has become widely recognised and is frequently cited in media coverage.
The increased risk to children of age seven is generally attributed to children entering elementary school at that age. In Japan, children typically walk to and from school independently, either alone or in small groups, without parental escort. Prior to entering elementary school, children have very limited opportunities for independent walking; however, upon entering elementary school, they begin commuting on their own. This substantially increases their exposure to traffic and the associated risks.
This study questions the concept of a ‘critical age of seven’, a catchy phrase that has attracted considerable public and academic attention. The concept is based on the historically high number of casualties among seven-year-olds and first-grade pupils, who often begin travelling independently after entering elementary school. However, the widely accepted concept has rarely been rigorously examined empirically, partly because it is logical to assume that accident risk increases when children start commuting to school without parental supervision.
Much of the existing literature has instead focused on more specific aspects of this issue. One aspect is the causal factors underlying accidents, such as rule violations and the circumstances in which they occur (during the commute to and from school or at other times) (Onishi and Fujiu 2021; Hagita 2020). A second aspect is children’s cognitive development and judgment (Inagaki et al. 2015).
Miyazaki and Matsuo (2021) show that, when accounting for exposure in terms of walking time, accident rates decline from ages 5 to 6 and from 6 to 7. However, the present study goes further by showing that casualties at age seven are not particularly high even without accounting for exposure, thereby providing stronger evidence that the perception of age seven as a particularly dangerous age is a misconception.
2. Methods
Table 1 summarises traffic casualty and population data by school year (grade) and age. The school-year analysis is restricted to Grades 1–6 of elementary school because preschool data are unavailable. The age-based analysis covers children aged 5–12 years, ranging from before entering elementary school to the highest age in elementary school. This study analyses pedestrian traffic accident casualties (fatalities and injuries combined), as fatalities alone are too few in number for reliable analysis. The casualty data were obtained from published aggregate tables, not individual crash records. No crash-level cleaning was performed and no data were excluded. Accident data by school year and age are reported by calendar year (January–December). In contrast, grade-based population data are compiled on a fiscal-year basis (April–March). Therefore, the grade-based population data is adjusted to align with the calendar year. Age-based population figures are measured as of 1 October. Data is compiled by sex and total.
The null hypothesis is that pedestrian casualties are independent of adjacent school years and age groups.
Table 2 presents the contingency table used for Pearson’s chi-squared test of independence. The notation is as follows: Ci denotes the number of casualties and Pi the population in group i; Pi – Ci represents the number of non-casualties. Multiple accidents per individual are assumed to be negligible. The number of contingency tables for each year equals the total number of groups minus one. This is because comparisons were restricted a priori to adjacent groups, which were the focus of the analysis. R (R Core Team 2025) was used for analyses.
3. Findings
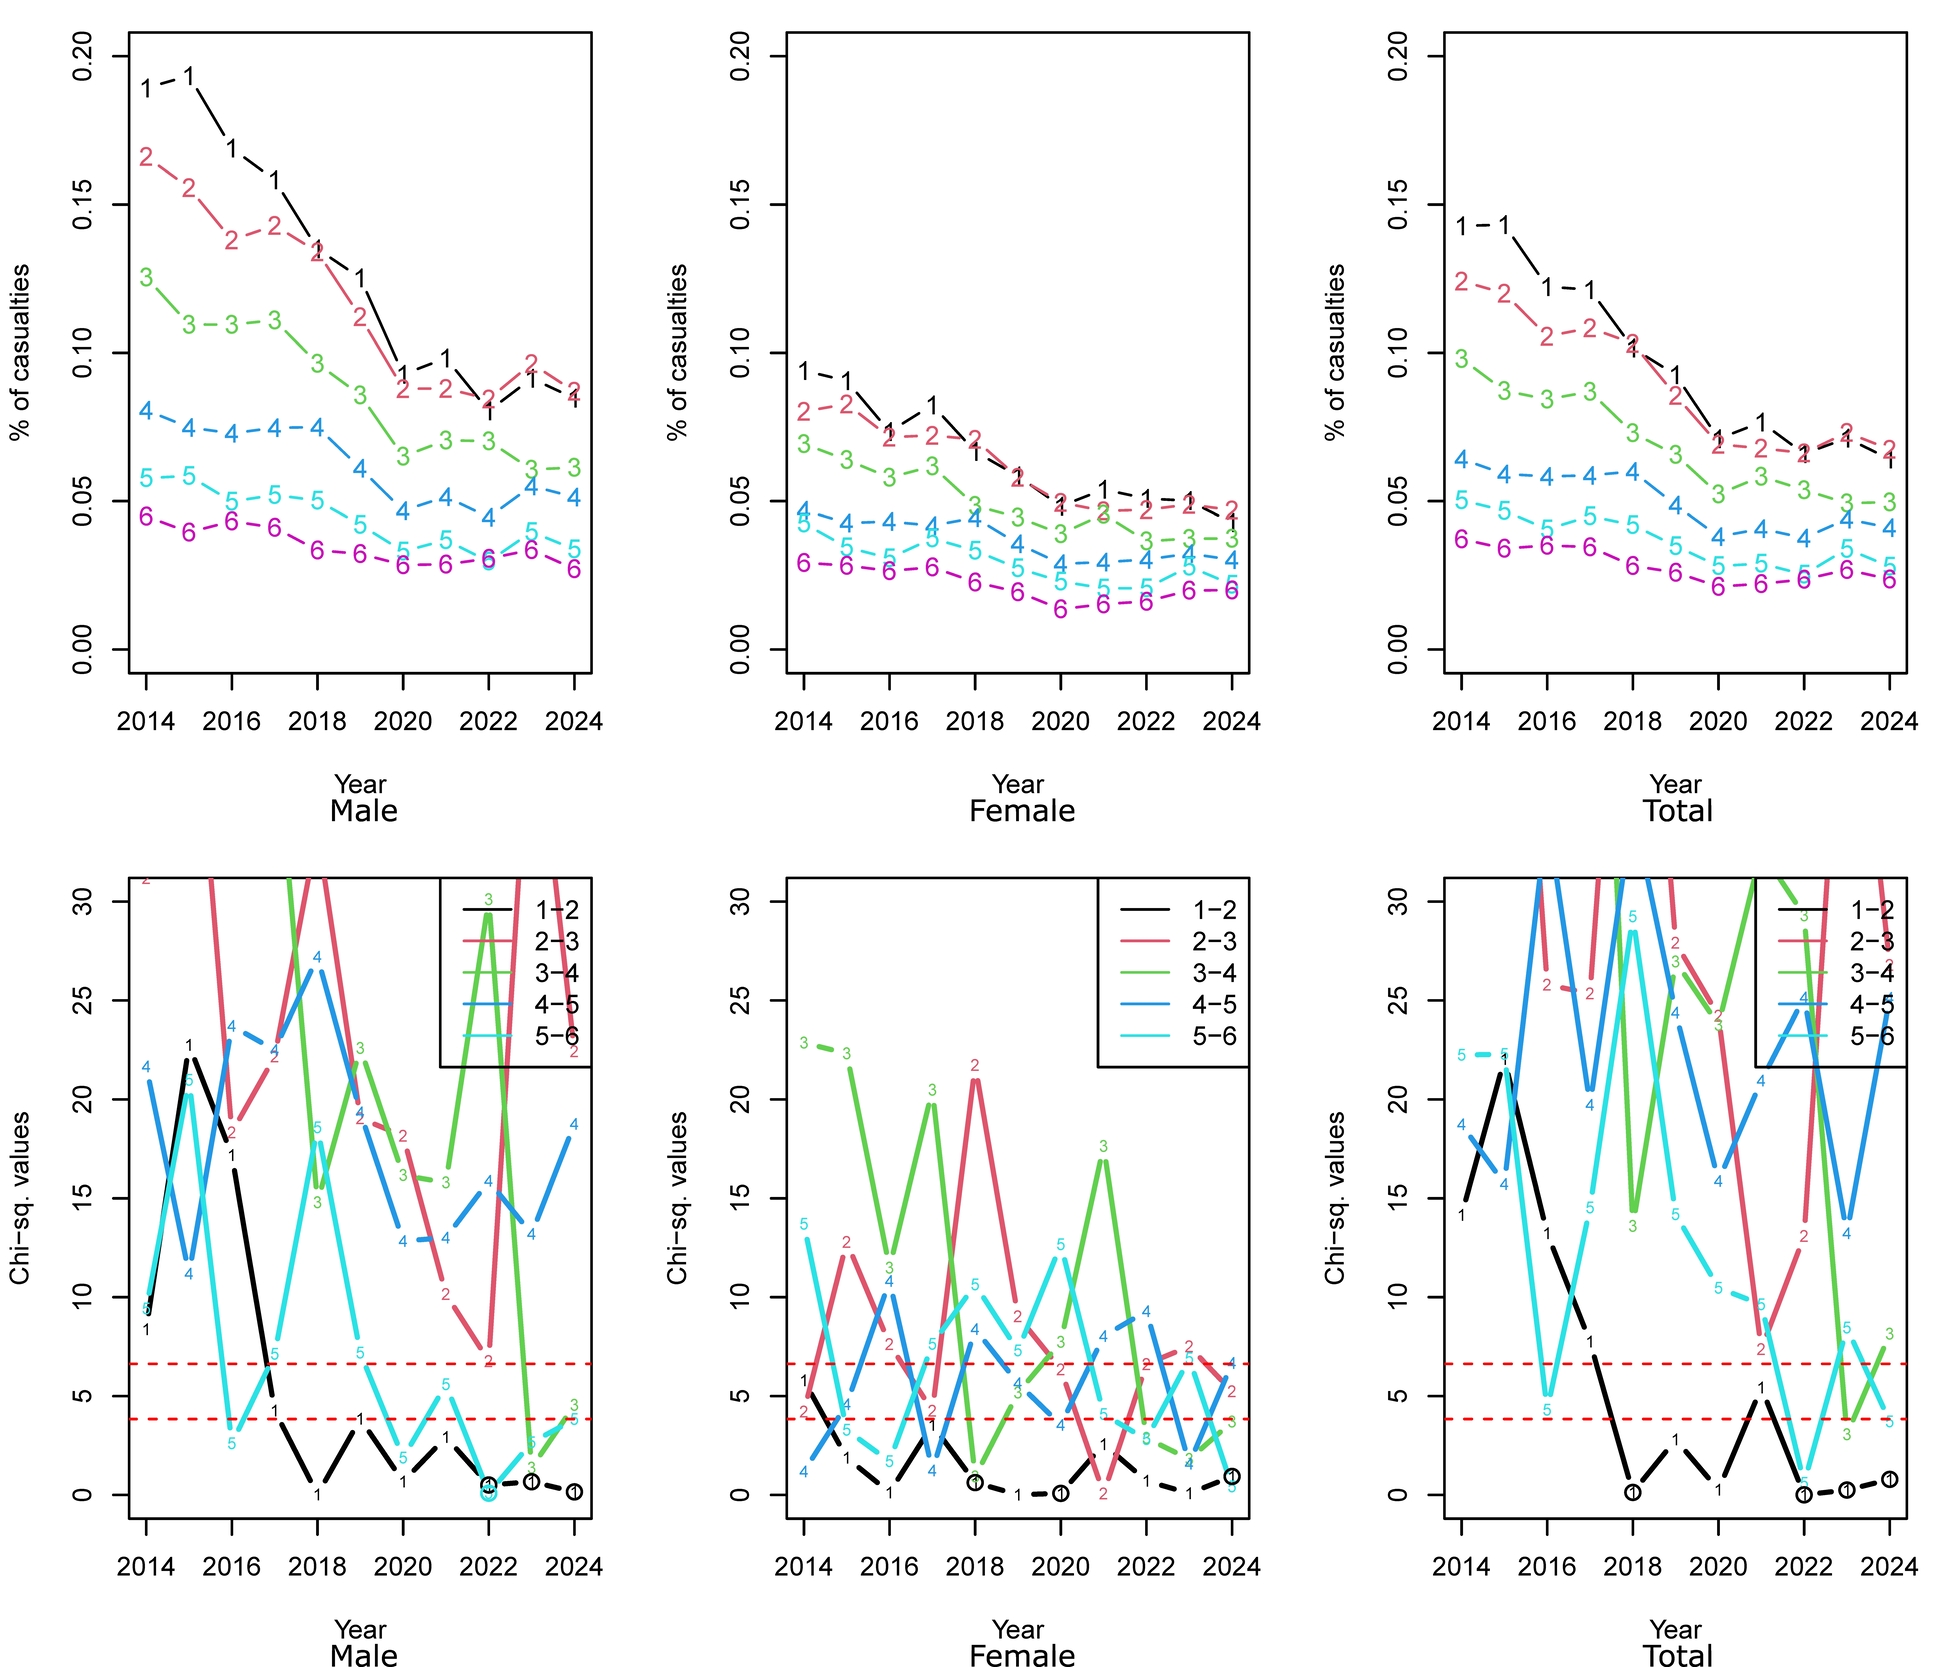
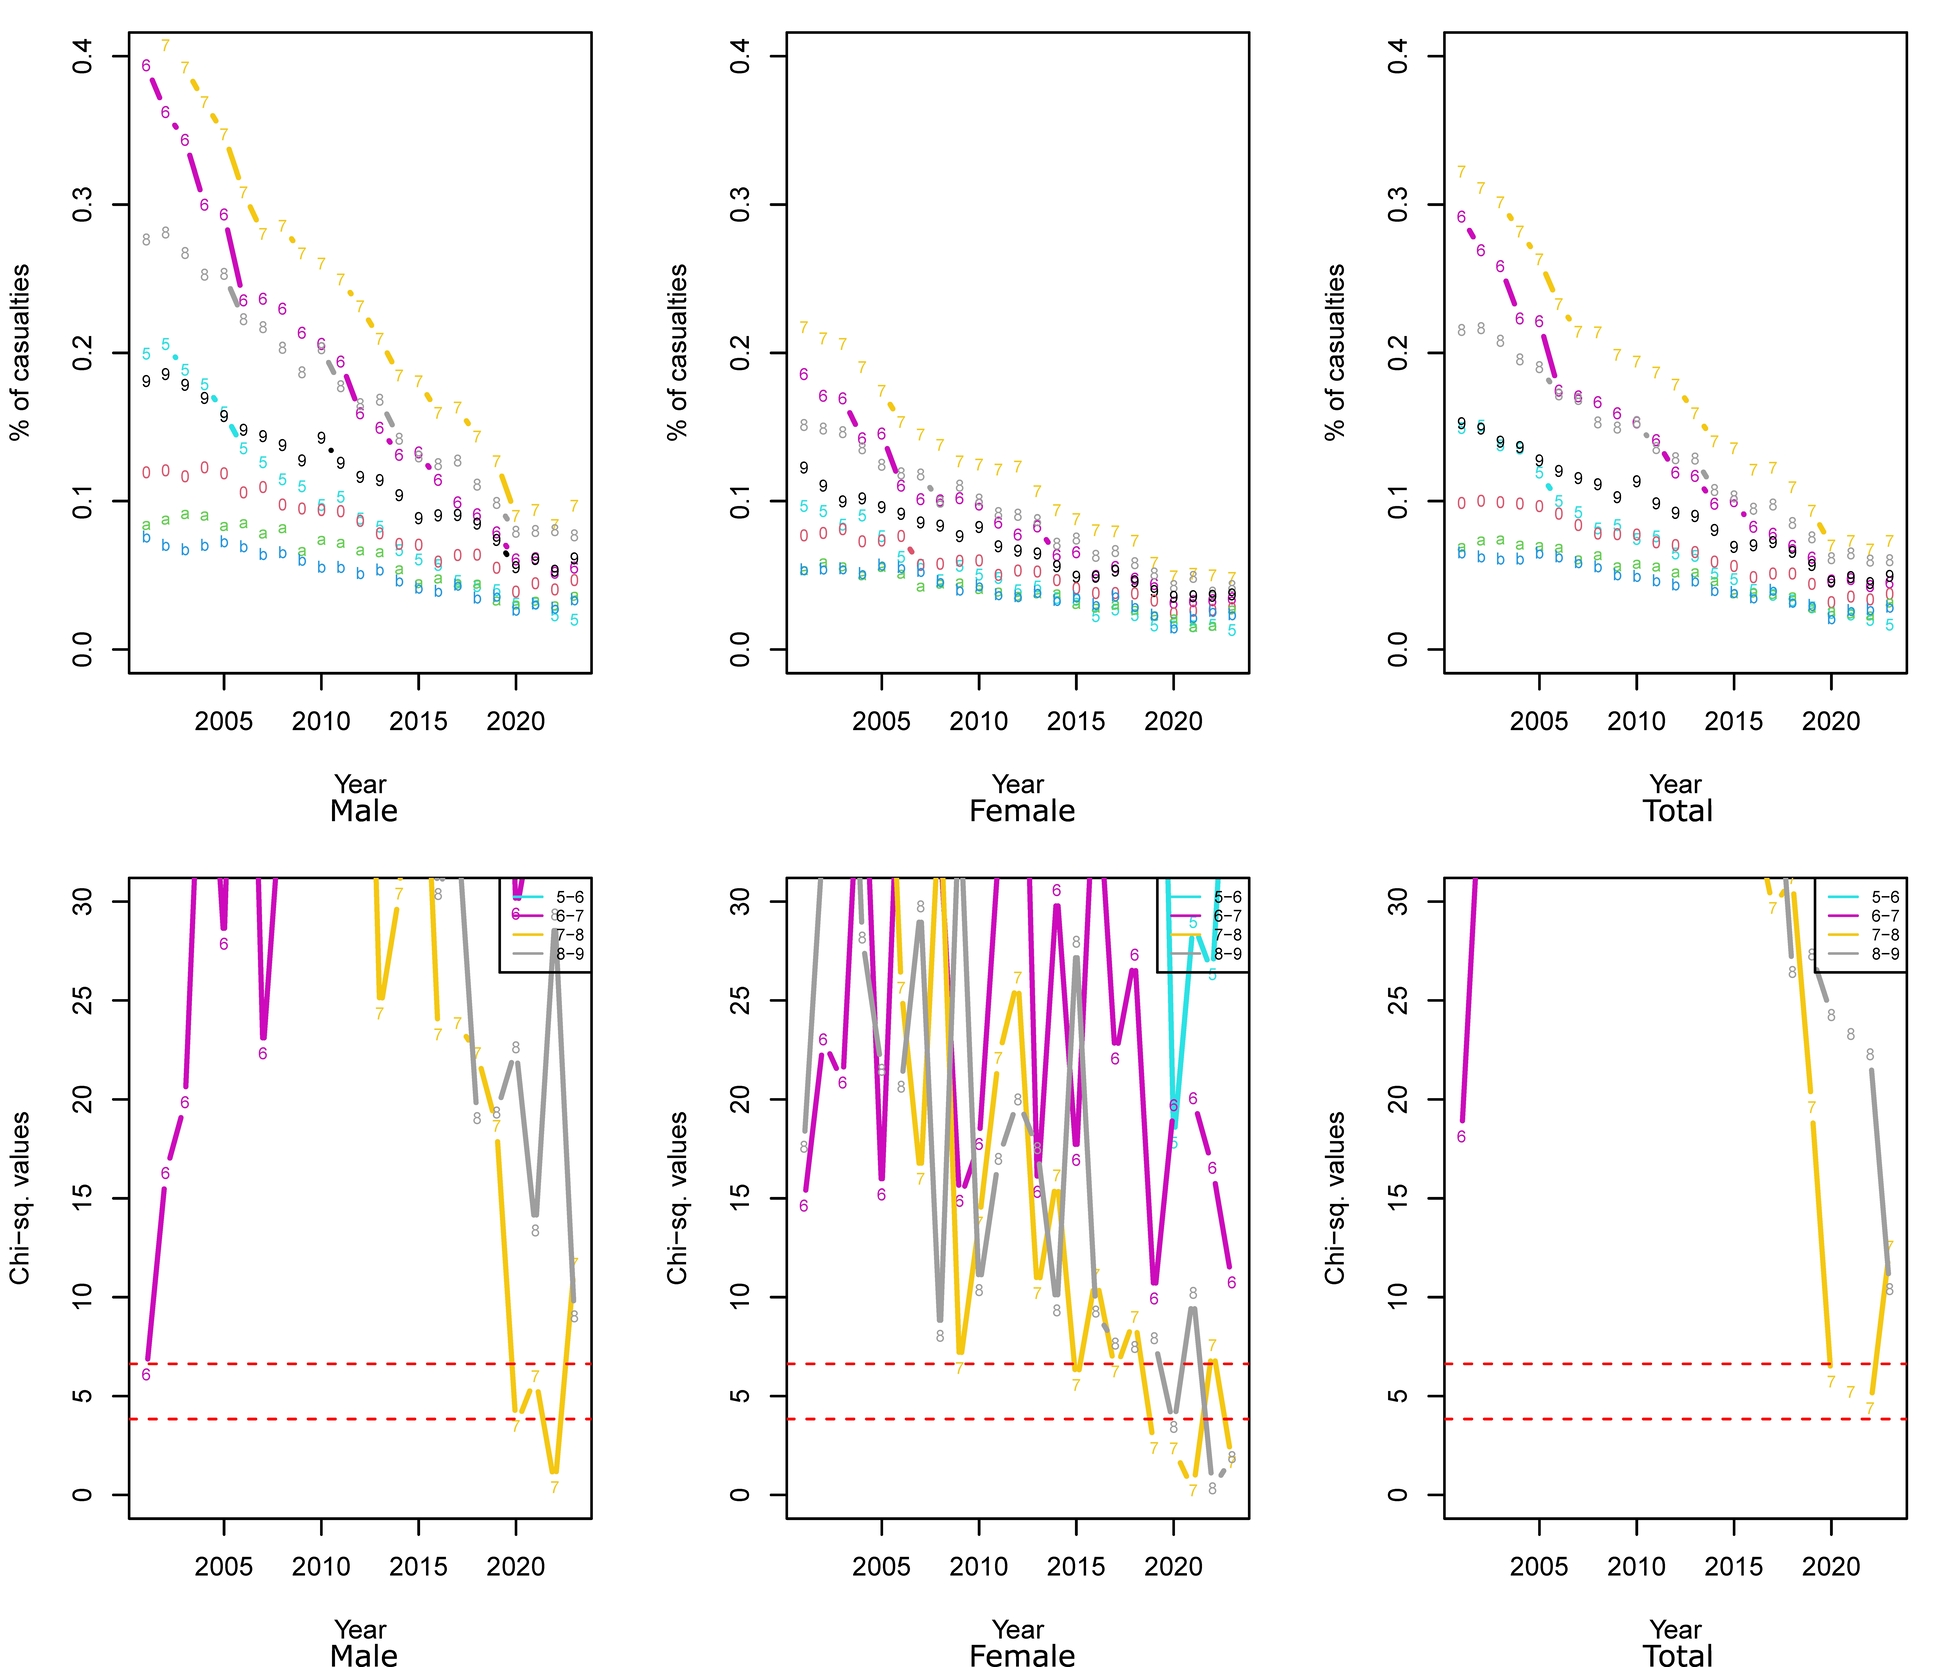
Figures 1 and 2 show pedestrian casualty rates (upper panels) and chi-squared test results across adjacent groups (lower panels). The rates and results are based on school year data and age data, respectively, for males, females, and total. In most cases, the highest casualty rates are observed for Grade 1 in Figure 1 and for age 7 in Figure 2. Casualty rates rise in early childhood, reach a peak around age seven, and then decline. Note that each grade includes two adjacent ages (e.g., Grade 1 includes ages 6 and 7; Grade 2 includes ages 7 and 8).
_and_chi-squared_values_of_independence_tests_betw.jpg)
_and_chi-squared_values_of_independence_tests_betw.jpg)
Casualty rates have steadily declined across all grades and ages. The rates for Grade 1 declined from 0.189% in 2014 to 0.085% in 2024 (2024-to-2014 ratio: 0.447) for males, from 0.094% to 0.043% (0.455) for females, and from 0.143% to 0.064% (0.449) for the total. The trend in the decline is moderate for other grades; the ratios for Grade 2 are 0.524 for males, 0.586 for females, and 0.543 for the total. Differences in casualty rates across school grades narrow during this time, especially between Grades 1 and 2, with Grade 2 rates occasionally exceeding those of Grade 1. Although males have higher casualty rates than females, the rate of decline does not differ substantially by sex.
A similar pattern was observed in the age-based analysis. Among the ages corresponding to Grade 1, the total casualty rate declined from 0.292% in 2001 to 0.045% in 2023 for age 6 (2023-to-2001 ratio: 0.154) and from 0.322% to 0.073% for age 7 (0.227). The decline is more moderate for age 8, with the total casualty rate decreasing from 0.215% to 0.060% (0.279). Although the ratio itself is smaller for age 5 (from 0.149% to 0.017%; ratio: 0.111), the absolute reductions in rates are greater for ages 6 and 7 than for ages 5 and 8.
The chi-squared test results further indicate that the null hypothesis of independence cannot be rejected for groups around age seven (i.e., Grades 1–2 and ages 7–8), suggesting that elevated risk is not confined to a single age.
These findings imply that the widely accepted concept of the ‘critical age of seven’ may now be outdated or misleading for both males and females. If interpreted as suggesting that only first graders or seven-year-olds are at risk, it could lead to misguided policy decisions. One possible interpretation is that the long-standing emphasis on the ‘critical age of seven’ has successfully reduced casualty rates among first graders and seven-year-olds. However, it remains unclear whether the observed shift primarily reflects 1) the success of these efforts, 2) insufficient attention to Grade 2 children, or 3) other factors.
Acknowledgements
The authors gratefully acknowledge the valuable comments received at the meeting of the Research Subcommittee on the Practical Use of Near-Miss Information for Pedestrian and Bicycle Traffic Safety Management (Committee of Infrastructure Planning and Management, Japan Society of Civil Engineers). The authors also appreciate the constructive comments provided by two anonymous reviewers and the editor.