1. Questions
Winter weather chronically disrupts road transportation in cold-climate metropolitan regions, yet empirical evidence of network-wide impacts remains spatially limited and corridor-specific (Andrey et al. 2003; Datla and Sharma 2008; 2010). The Greater Toronto Area (GTA) presents a compelling case for studying winter mobility, given its high automobile dependence and long commute durations. In 2025, 69.4% of workers drove personal vehicles in the Toronto Census Metropolitan Area, which also had the longest average commute time in Canada at 34.9 minutes; meanwhile, the share of employees working from home continued to decline relative to highs during the COVID-19 pandemic (Statistics Canada 2025). Sensor-based studies have quantified snow-related traffic reductions on individual highway segments (Hanbali and Kuemmel 1993; Roh 2024), but understanding how impacts vary by trip distance and road type across an entire metropolitan network requires spatially comprehensive data.
This paper explores three research questions: 1) what is the quantitative relationship between snowfall magnitude and trip volume across the GTA? 2) do winter-related changes in trip volumes vary by route distance or road type? and 3) how do trip volumes change before, during, and after temporally independent major snowfall events?
2. Methods
We collected daily snowfall data from the NAVCAN Toronto Pearson weather station (WMO 71624) for August 2021 through December 2025 (Environment and Climate Change Canada 2025). Spatial variability in snowfall across the region, including potential lake-effect enhancement and urban heat island effects, represents a limitation of the single-station approach; however, the major events captured by the ≥5 cm threshold are predominantly driven by synoptic-scale systems affecting the broader region. We used total snowfall, defined as the daily accumulation of fresh snow (in cm). Two thresholds were applied to represent any snowfall (≥1 cm; n=96 days) and major snowfall (≥5 cm; n=37 days), the latter aligned with City of Toronto plowing initiation (City of Toronto 2024).
We used de-identified, aggregated network mobility data from TELUS Communications Inc. through their Data for Good program (TELUS 2020) to derive trip volumes. The dataset captures a subset of the GTA population based on cellular network subscribers and may under-represent certain demographic groups or travel modes. We measured trip volumes as origin-destination (OD) flows between aggregate dissemination areas (ADAs; n = 744, approximate population 5,000-100,000) within the GTA. Each day was divided into two 12-hour periods to capture morning and evening commutes and subsequently aggregated into daily observations. For each OD pair, a shifting baseline was calculated following Tsapakis et al. (2013) as the median trip volume from a 9-week window (4 weeks before, 4 weeks after), matched by OD pair, day-of-week, and time-of-day. The baseline definition is sensitive to seasonal variability while resilient to outliers (Tsapakis et al. 2013). We calculated the relative change in trip volumes as the percentage difference between observed and baseline trips which should be interpreted as higher (positive) or lower (negative) trip volumes relative to the baseline. We refer to this relative-to-baseline measure as mobility deviation.
The mobility data does not characterize individual travel routes, therefore we estimated route distances between OD pairs using the Open Source Routing Machine (Luxen and Vetter 2011) on OpenStreetMap data, enabling stratification by distance category (Very Short: <2 km, Short: 2–5 km, Medium: 5–10 km, Long: 10–20 km, Very Long: >20 km) and OSM road type (Datla et al. 2013). Vehicle-kilometers traveled (VKT) was calculated by multiplying trip volumes by route distances, then decomposed by road class proportions.
To analyze changes in mobility deviation before and after snowfalls, we first identified all major snowfall days with ≥5 cm of recorded daily snowfall (n = 37 days). Consecutive major snowfall days were grouped into storm events, retaining only events where every day within the event met the ≥5 cm threshold and where neither the immediately preceding nor the immediately following day also recorded ≥5 cm. This yielded 23 temporally independent major snowfall events: 19 single-day events and 4 two-day events. For each event, the “during” period is the mean daily mobility deviation across the one or two storm days. The “pre” period is the calendar day immediately preceding the event, and the “post” period is the calendar day immediately following the event. The full 37-day sample characterizes aggregate major-snowfall-day impacts on trip volumes and VKT, while the 23-event subset provides a cleaner test of short-term anticipatory and recovery responses around independent storm episodes. This filtering improves the interpretability of the pre-, during-, and post-event comparison, but excludes multi-day storms with varying precipitation that may produce more disruptive mobility patterns.
We conducted paired t-tests comparing pre-, during-, and post-event mobility deviation, with Cohen’s d for effect size (Khattak and De Palma 1997). We also employed the Brown-Forsythe test to assess variance heterogeneity in mobility deviation across pre-, during-, and post-event observations (Brown and Forsythe 1974). As a sensitivity analysis, we repeated the paired comparisons using ±2-day pre- and post-event windows, averaging mobility deviation across the two days before and two days after each event.
3. Findings
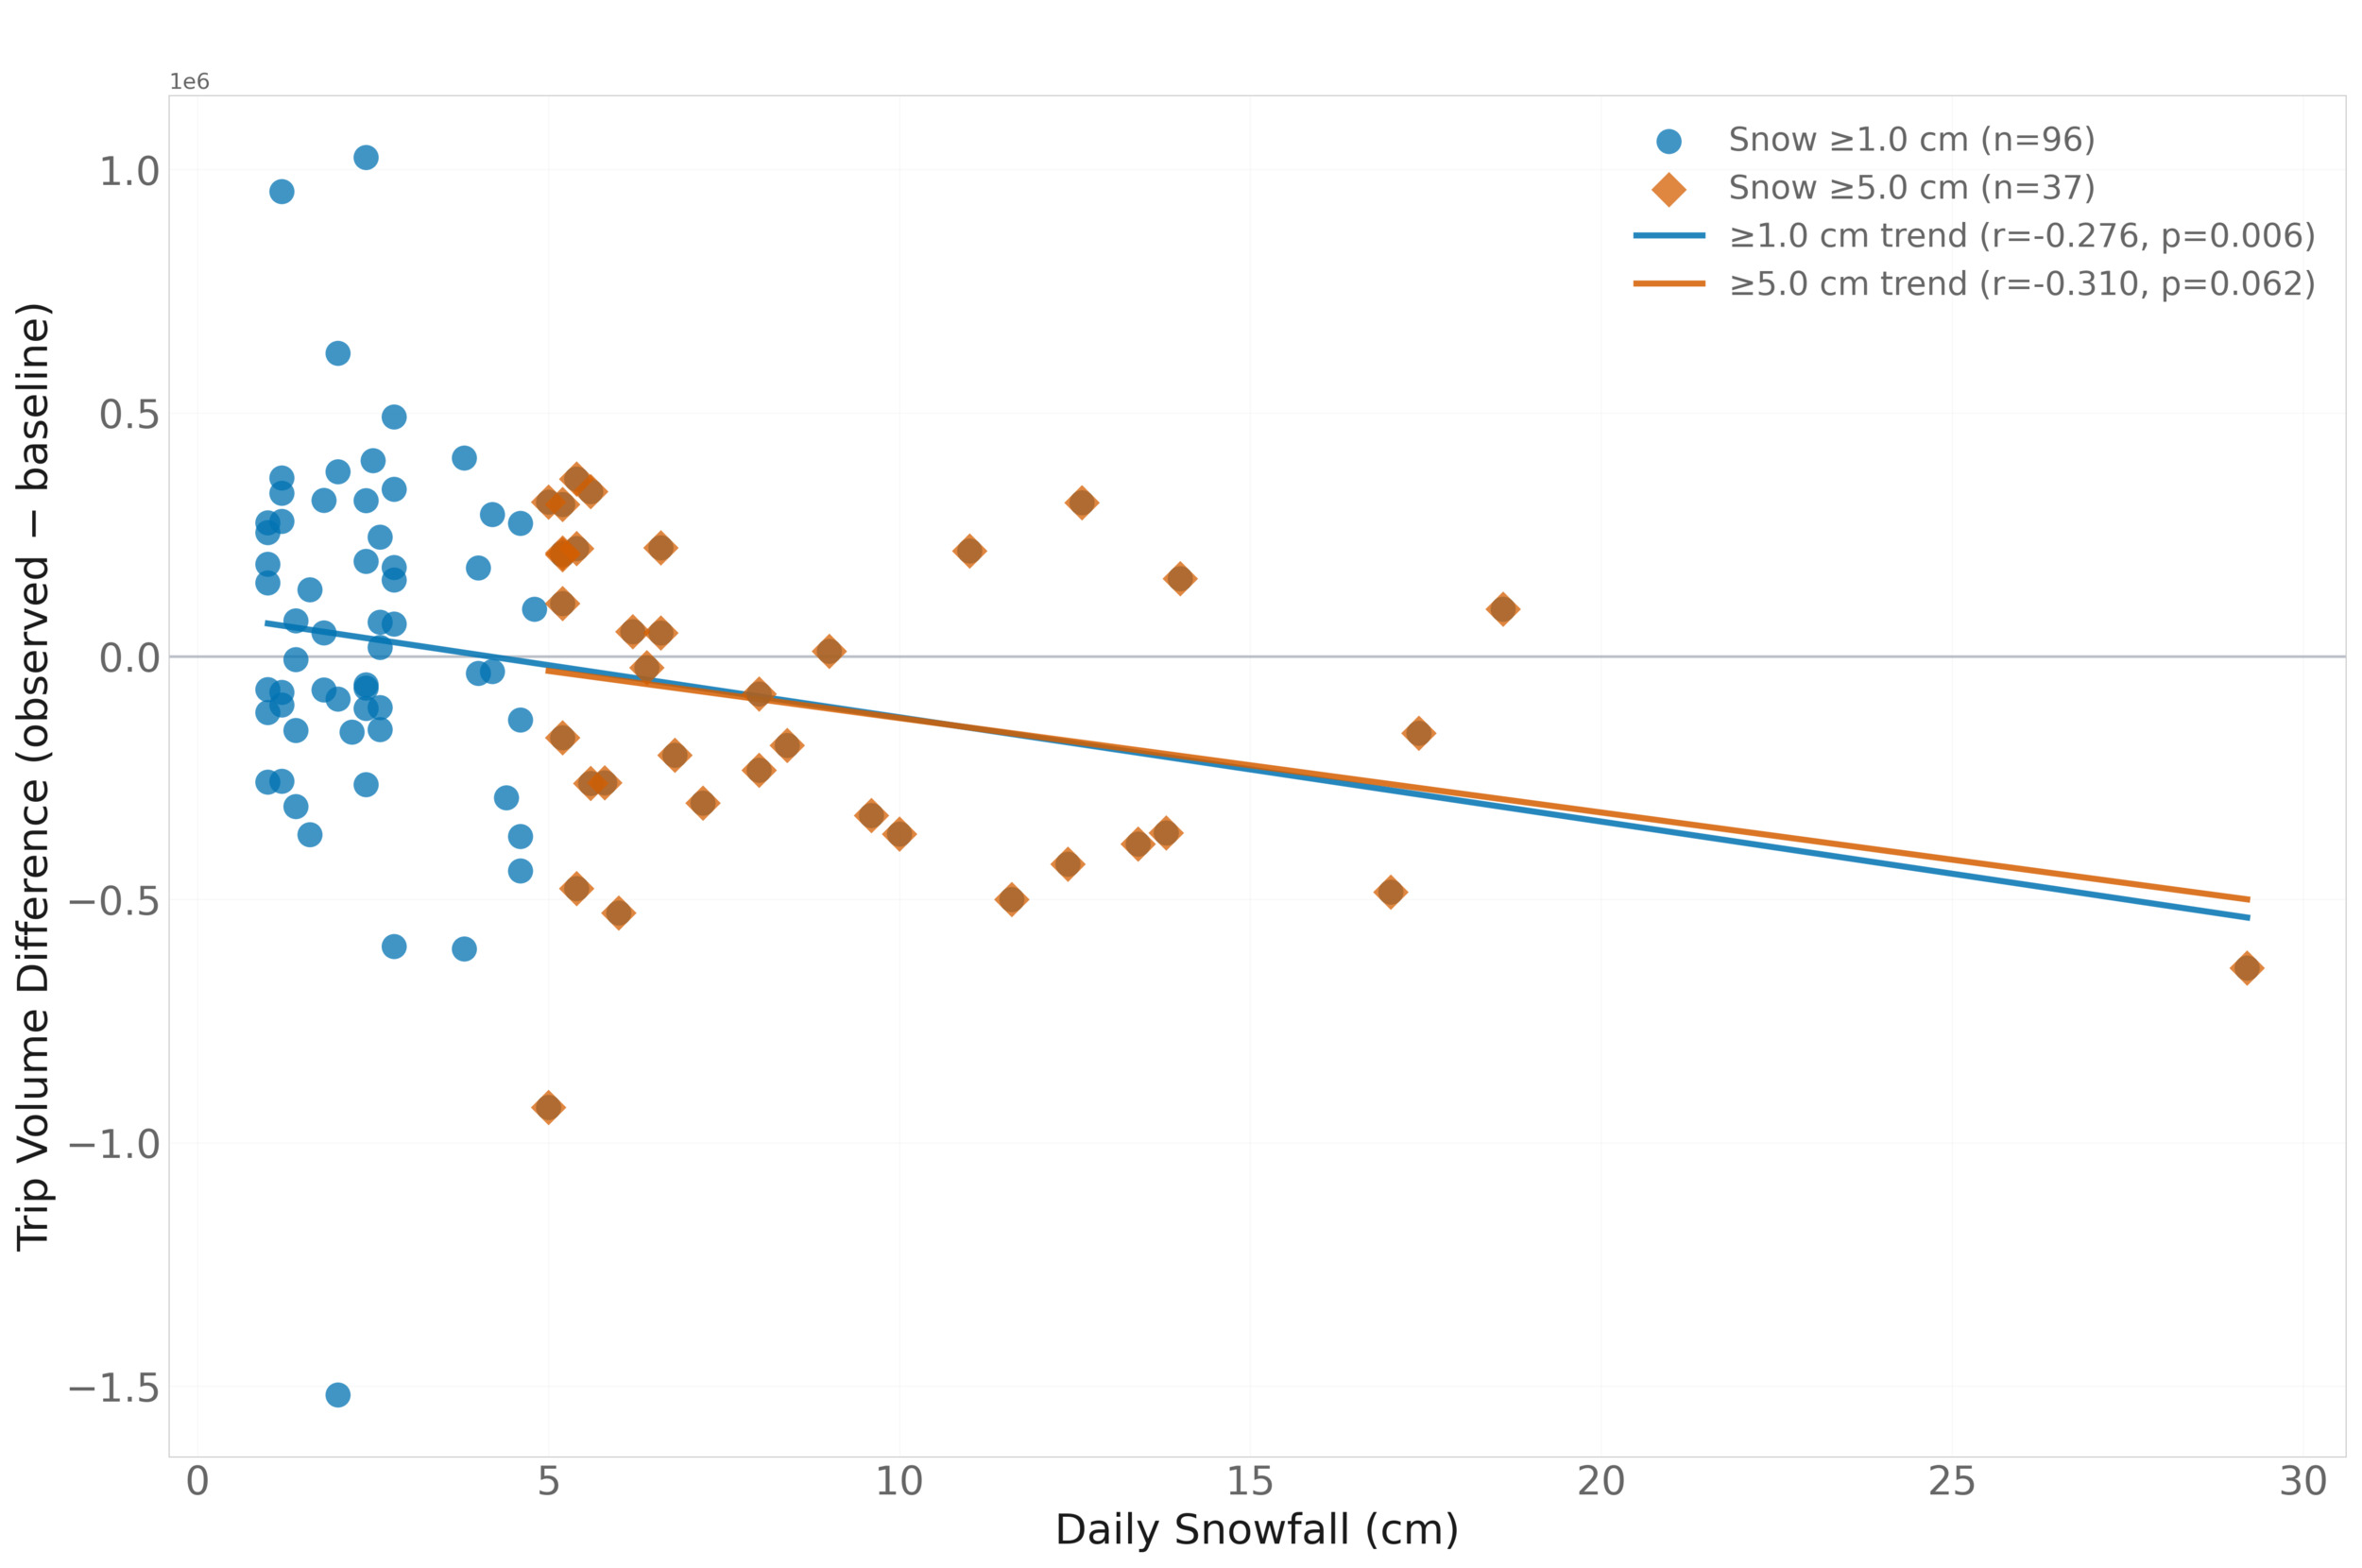
Daily snowfall accumulation exhibited a negative relationship with trip volume across the GTA. For days with ≥1 cm of snowfall, trip volumes decline significantly relative to baseline as snowfall increases (r=-0.276, p=0.006; Figure 1). Focusing only on the major snowfall days (≥5 cm) yields a comparable effect, albeit with the smaller sample (r=-0.310, p=0.062).
Considerable dispersion is observed at moderate snowfall levels (approximately 5–15 cm), indicating that daily accumulation alone does not fully determine mobility response. This variability likely reflects intra-day snowfall distribution, temperature conditions, and operational factors such as road clearance timing. Observations above 20 cm are limited, precluding reliable inference regarding extreme snowfall impacts.

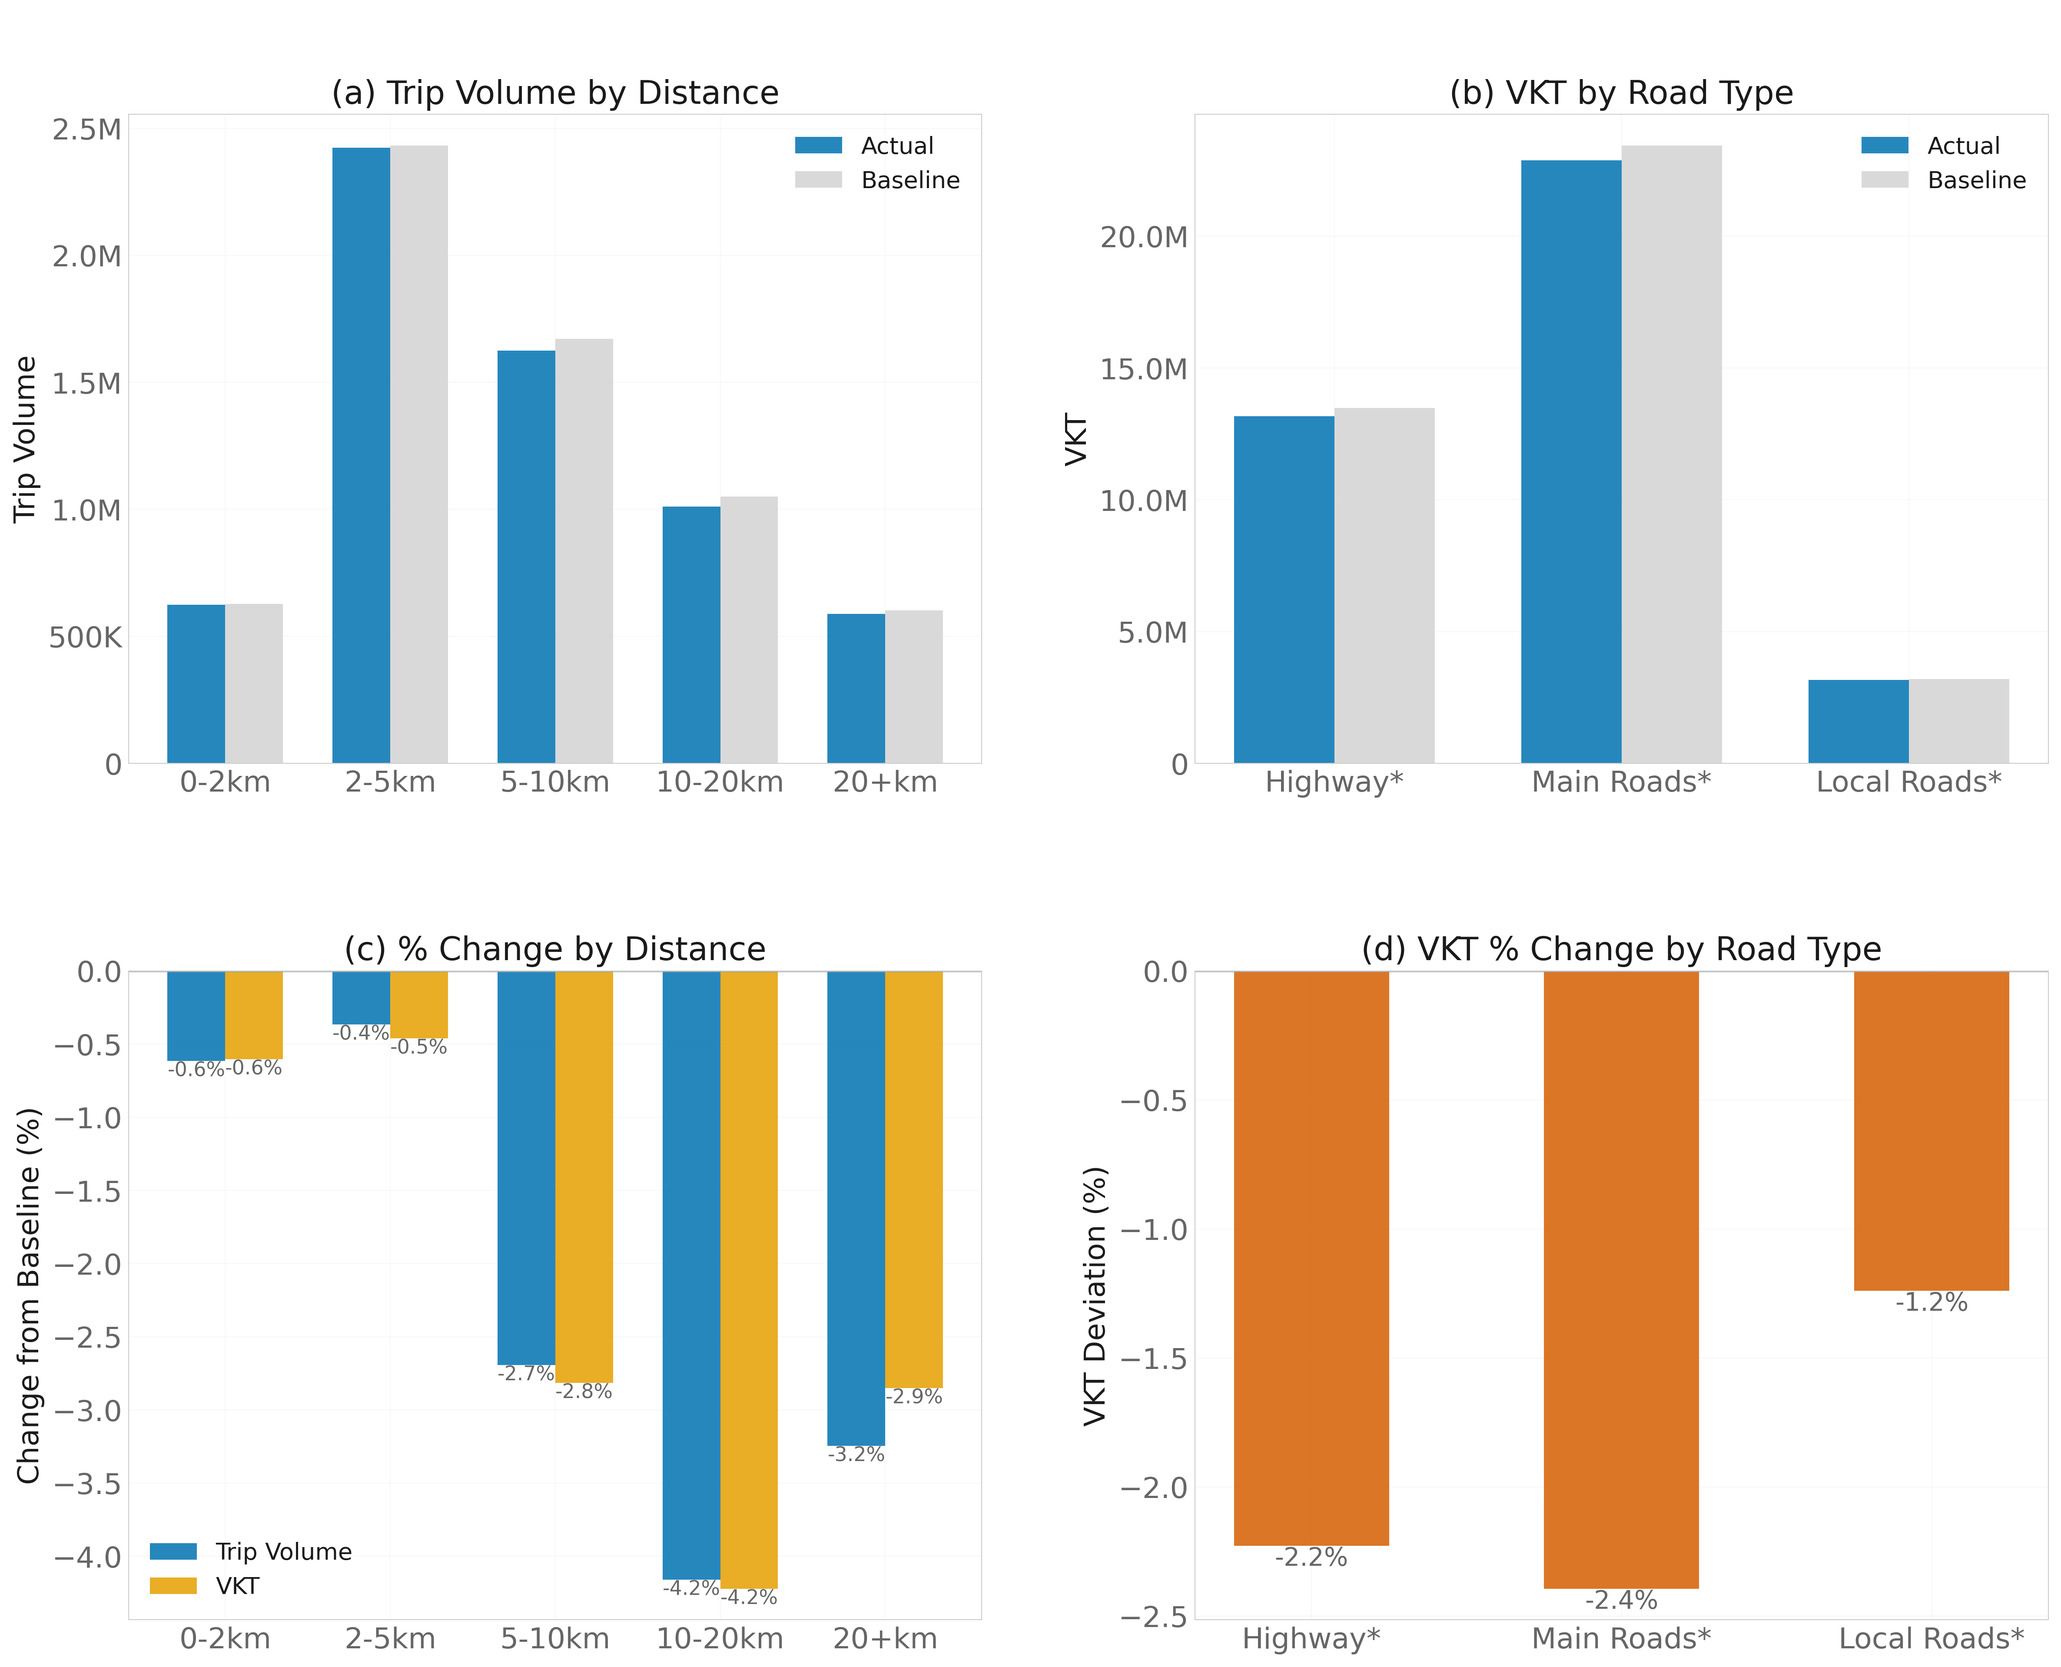
Across the 37 days with ≥5 cm of snow, we observed a mean 1.7% reduction in trip volumes (s.d. = 5.66 percentage points [pp]) and mean 2.3% reduction for VKT (s.d. = 6.85 pp; Figure 2). The larger VKT decrease is evidence that snowfall disproportionately impacts longer trips. Long-distance routes (10-20km) experienced the greatest decrease in both volume (−4.2%) and VKT (−4.2%), while shorter trips (2–5 km) showed lesser decreases (−0.4% and −0.5% respectively). Among road types, main roads experienced the largest VKT decreases in trip volume (−2.4%), followed by highways (−2.2%). Local roads were the most consistent with baseline conditions, with a modest decrease −1.2%. This heterogeneity likely reflects two reinforcing mechanisms. First, longer trips on high-speed facilities are more discretionary and therefore more readily deferred; second, higher operating speeds demand better road surface conditions, increasing driver sensitivity to snow accumulation and reduced visibility (Hanbali and Kuemmel 1993).
_response_during_major_snowfall_days_(5_.png)
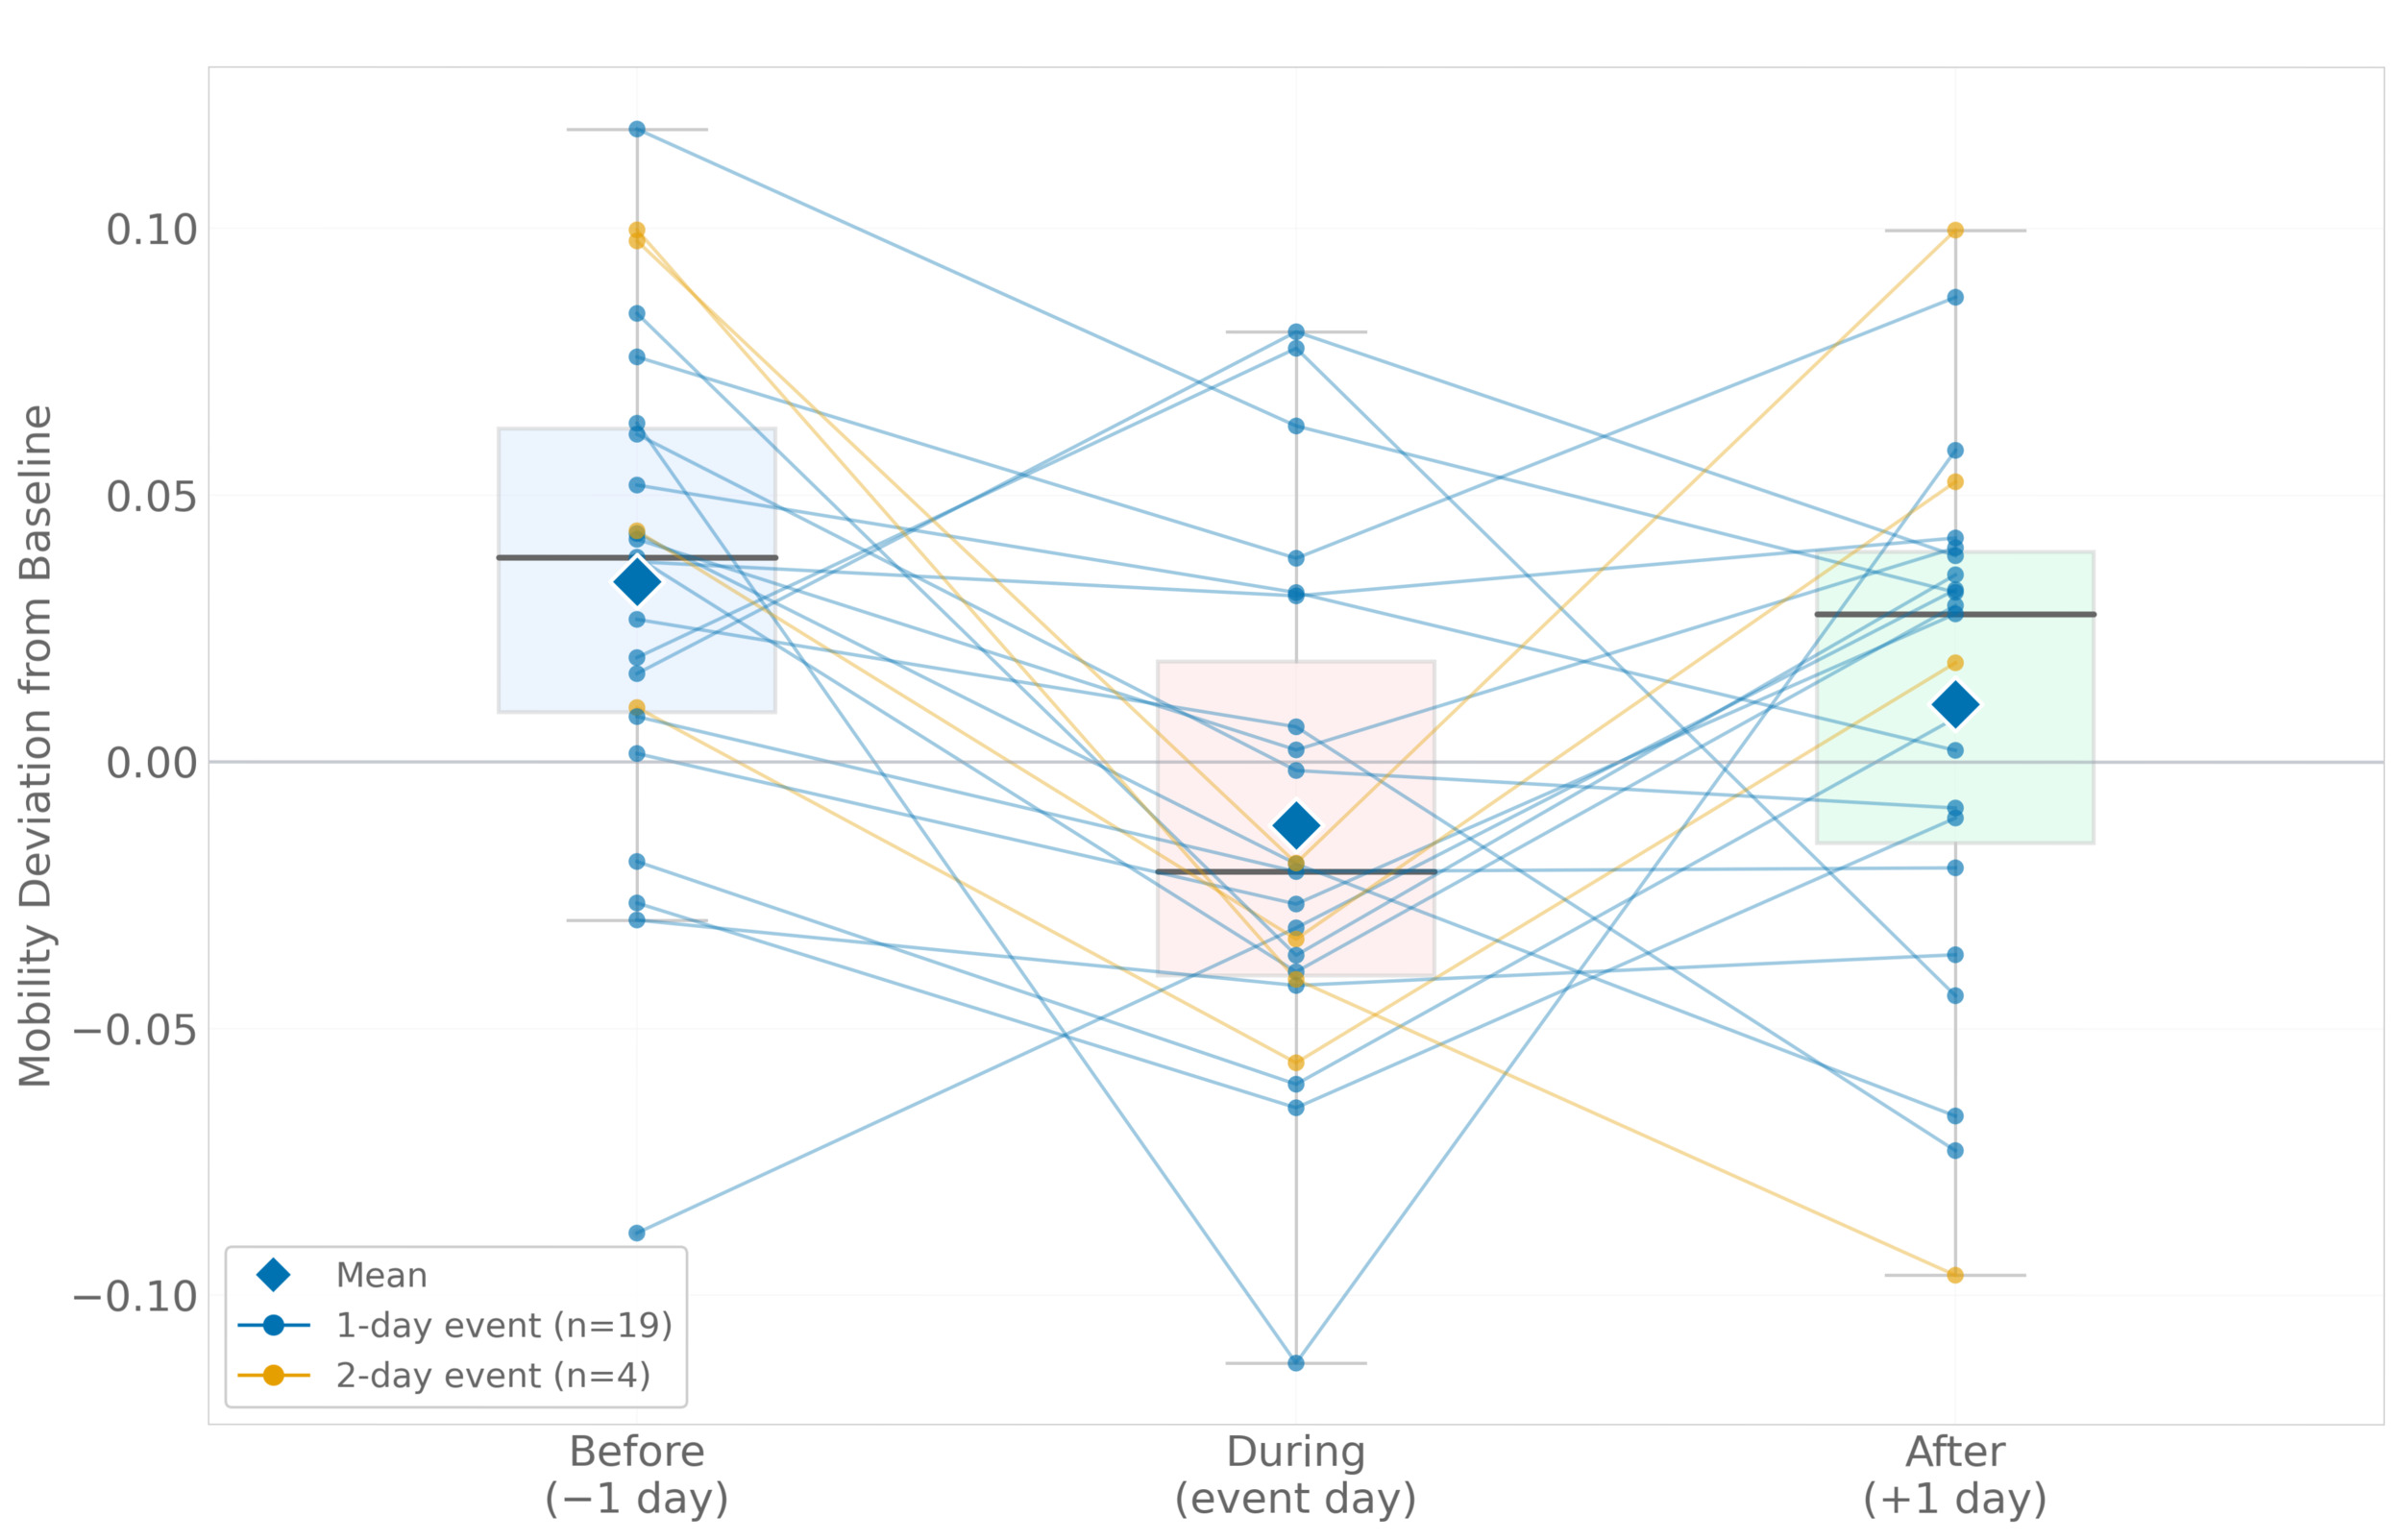
For the 23 temporally independent major snowfall events, mobility deviation averaged +3.37% (s.d. = 4.78 pp) on the day before the snowfall event, −1.19% (s.d. = 4.80 pp) during the snowfall event, and +1.09% (s.d. = 4.95 pp) on the day after the event. The blue and orange traces in Figure 3 represent individual one- and two-day events respectively, while the blue diamonds show the mean of before, during, and after observations. Variance heterogeneity across pre-, during-, and post-event periods was not statistically significant (Brown-Forsythe, p = 0.974), nor was the pre- versus post-event variance difference (p = 0.828). Therefore, unlike the full 37-day sample, the temporally independent subset does not support a strong post-event fan-out interpretation.
The main temporal signal in the independent-event subset is elevated pre-event mobility. Taken across the ±1-day window, the net mobility deviation is modestly positive, driven primarily by the pre-event increase rather than by post-event rebound. This does not imply that snowfall generally increases travel. Rather, it suggests that forecasted snowfall may induce anticipatory trip-making, potentially including errands, commuting adjustments, shopping, or other activities before conditions deteriorate. In this sense, the short-term mobility response to snow is not purely suppressive; it also reflects forecast-driven temporal redistribution (Cools et al. 2010; Cools and Creemers 2013; Wang et al. 2017).

Mobility deviation was significantly higher in the days before a snow event, in comparison to the days during a snow event (Table 1). This finding suggests anticipatory travel behavior, whereby individuals adjust activity-travel patterns in response to forecasted conditions by advancing or rescheduling trips before the snowfall event (Cools and Creemers 2013). This interpretation is consistent with prior evidence that weather forecasts can alter activity-travel decisions, although the direction of response may differ by context. For example, Yang et al. 2021 found that snow forecasts reduced intercity freeway travel in China, whereas our results suggest that urban and regional mobility in the GTA may increase before snowfall, potentially due to localized preparation trips or schedule adjustments.
During- versus post-event differences were not statistically significant, indicating no clear compensatory rebound after snowfall (Table 1). Pre- versus post-event differences were also not statistically significant in the independent-event sample. The modest positive net deviation across the ±1-day window suggests that, in aggregate, elevated pre-event mobility may offset or exceed same-day reductions for independent snowfall events. This does not imply that snowfall generally increases travel. Rather, it suggests that forecasted snowfall may induce anticipatory trip-making, potentially including errands, shopping, commuting adjustments, or other activities before conditions deteriorate.
Our research makes three main contributions using large-sample network mobility derived from mobile phones. First, we demonstrate that routine snowfall produces measurable trip volume decreases with effects concentrated on longer trips and higher-speed road types. Second, using the temporally independent major snowfall event subset, we show that independent snowfall events are associated with elevated pre-event mobility, suggesting that forecasted snow may trigger anticipatory trip-making. This pre-event increase can offset or exceed same-day suppression over a short ±1-day window, indicating that snowfall impacts are not only a matter of reduced travel but also of temporal redistribution. Third, the relative resilience of short-distance local travel during snow events suggests that neighborhood-scale accessibility may support essential activities during winter weather conditions, consistent with evidence from other weather-disruption contexts.
Data and Code Availability
The original TELUS network mobility data cannot be provided openly due to data-sharing and privacy restrictions. To allow other researchers to follow our methodology, we provide reproducible code and simulated mobility data that preserve the structure of the analysis workflow but do not reproduce the original data. Daily snowfall data are publicly available from Environment and Climate Change Canada. The code and simulated mobility data can be found at https://github.com/haoruizhou/snowfall-mobility-gta.