

1. Questions
While most battery electric vehicle (BEV) charging occurs at home (Hardman et al. 2025) there is a need for public charging to facilitate long distance travel in BEVs (Sawant and Zambare 2024), support drivers without home charging (Ge et al. 2021), and for other occasional charging needs. In the US the development of a direct current fast charging (DCFC) network has been supported by public funds (U.S. Department of Energy 2025). However, funds from initiatives like the National Electric Vehicle Infrastructure (NEVI) program were previously blocked or delayed, though funds are now being distributed again. However, any funding beyond 2026 is uncertain. Many DCFC locations are not profitable without subsidies (Jenn 2025; Kim et al. 2022). To address profitability providers may need to identify additional sources of revenue, as well as increasing revenue from charging. One potential revenue source could be capturing expenditure of drivers while they are using DCFC, like the business model of gasoline stations. There is little evidence on what BEV drivers do while charging, if they purchase anything, and how much they spend.
This paper aims to explore the activities and expenditures of BEV drivers while charging. The paper meets this aim using survey data collected from BEV drivers in California who were asked to recall information about the last time they visited a public DCFC. This paper is descriptive, documenting activities and expenditures to provide foundational empirical evidence and novel data that can inform future research and practice in this area. Consistent with established guidance on the appropriate use of descriptive research, our goal is to explore and characterize a phenomenon rather than to explain it (Grimes and Schulz 2002; Nassaji 2015).
2. Methods
Survey data was collected in June and July 2025 by the author of this study. The survey was administered via email to 10,497 households, of these 3,933 started the survey and 3,350 completed it. A PDF of the questionnaire survey is available as a supplemental file. Respondents were recruited from a database of Californian households that at one time owned a BEV or a plug-in hybrid electric vehicle (PHEV), and of 3,350 respondents all but 240 still own a BEV or PHEV (see Supplemental Information for sample demographics and the BEVs respondents own). For this paper, only survey responses from BEV owners who could recall their last public DCFC session were used (n=1,898). Only six survey responses were obtained from owners of DCFC-capable PHEVs, and none of these respondents reported using DCFC. Some analysis uses a smaller sample size because respondents could not recall certain information, or because questions were not relevant to them, for example, items purchased or expenditure for respondents who did not purchase anything. Of the charging sessions, recalled the majority (56%) occurred in the months the data was collected (June and July 2025), with 85% of sessions occurring in 2025.
3. Findings
The mean cost of a DCFC session was $10.35. This figure is low because 34% of survey respondents reported paying $0 to charge. This was due to having free charging perks or charging credits. The mean charging cost excluding those with free charging was $16.07. The average duration of charging sessions was 32 minutes.
Activities and expenditure while charging
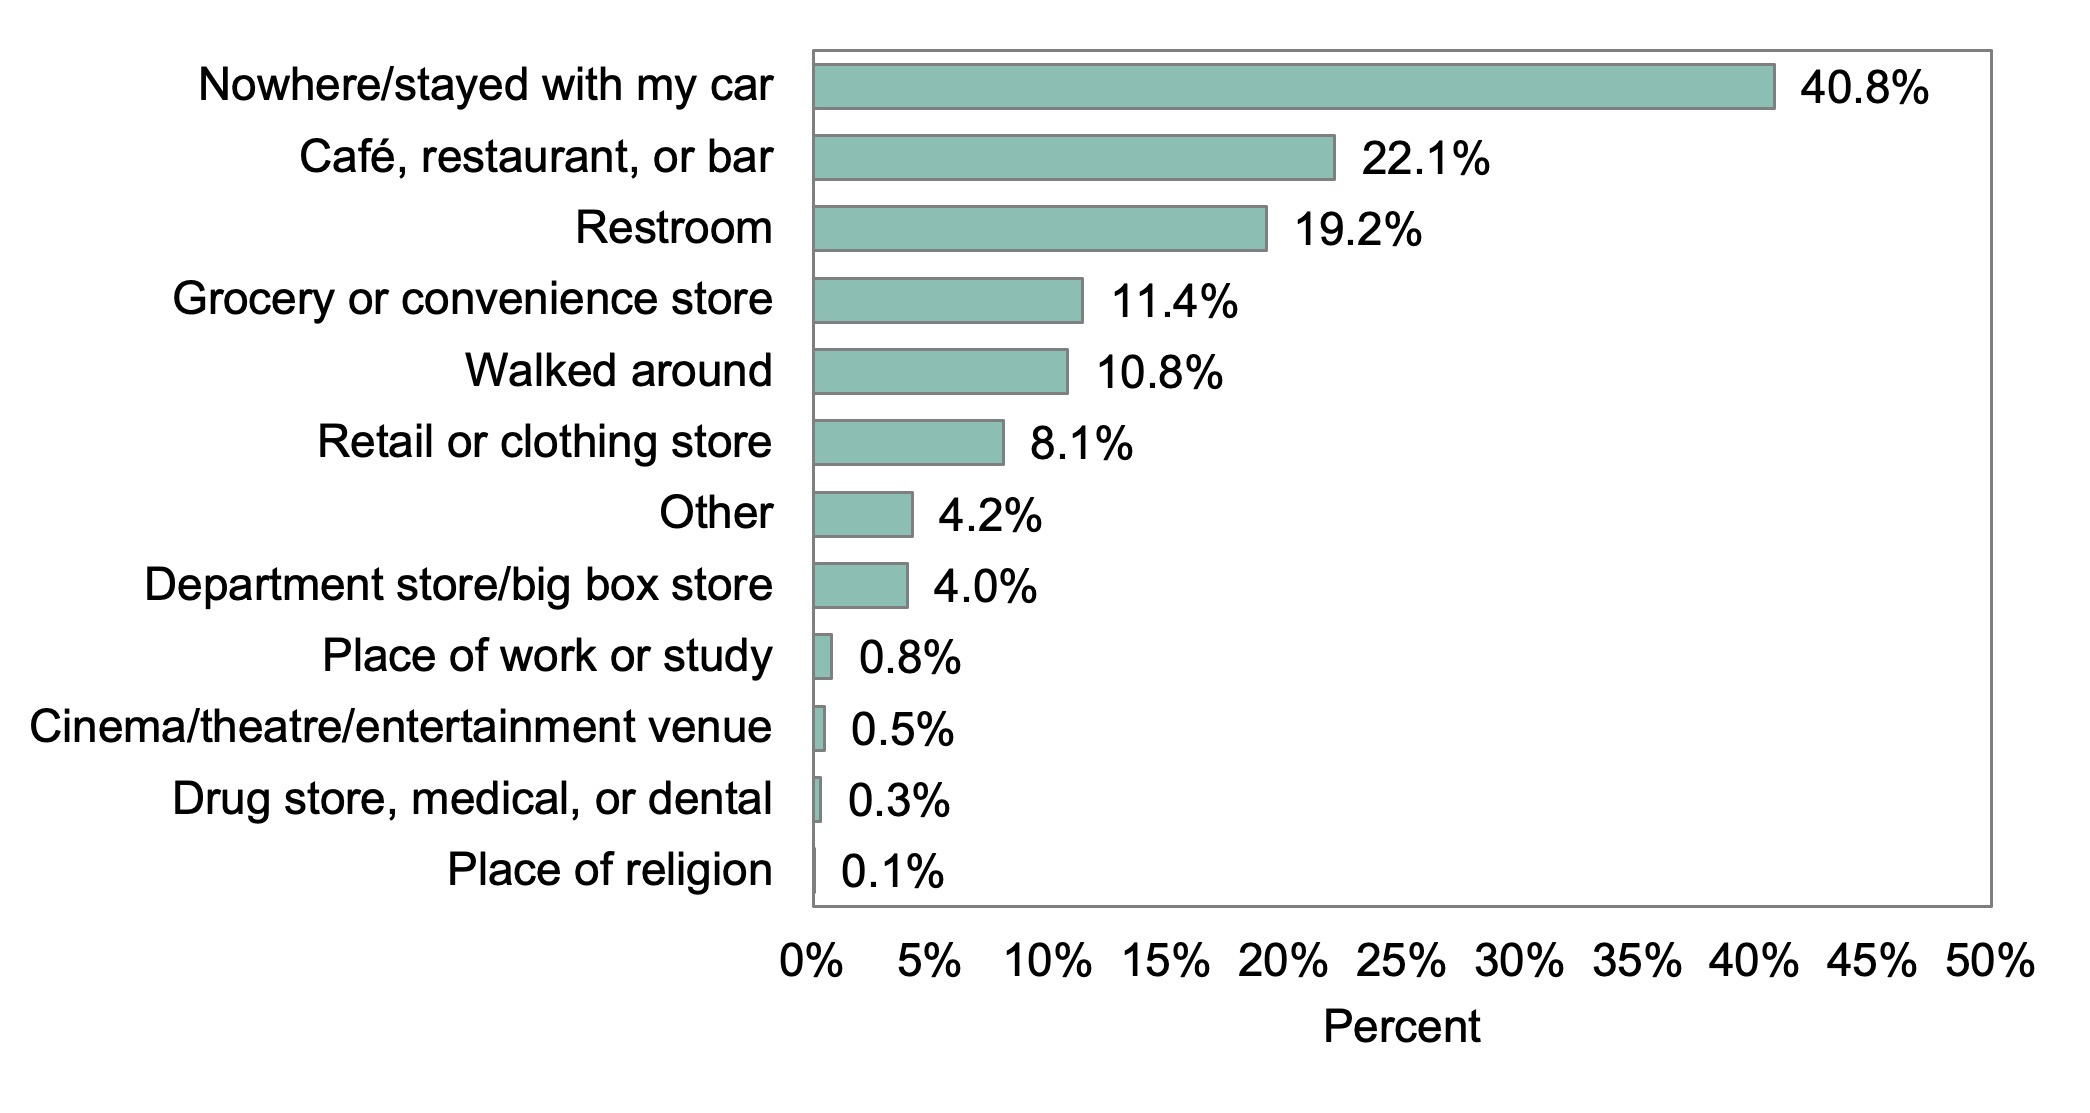
Figure 1 shows respondents reported activities while charging. Respondents reported on average 1.2 activities including staying with the car, and 0.81 activities excluding staying at their car. In total, 63.9% of respondents reported doing something in addition to staying with their car. The survey also asked respondents to report the primary reason for visiting the DCFC. In this sample 77% of respondents reported the primary reason was to charge their BEV, 6% reported the primary reason was to do the activities they reported, and 17% reported both the activities and charging were the reason they were at the location.

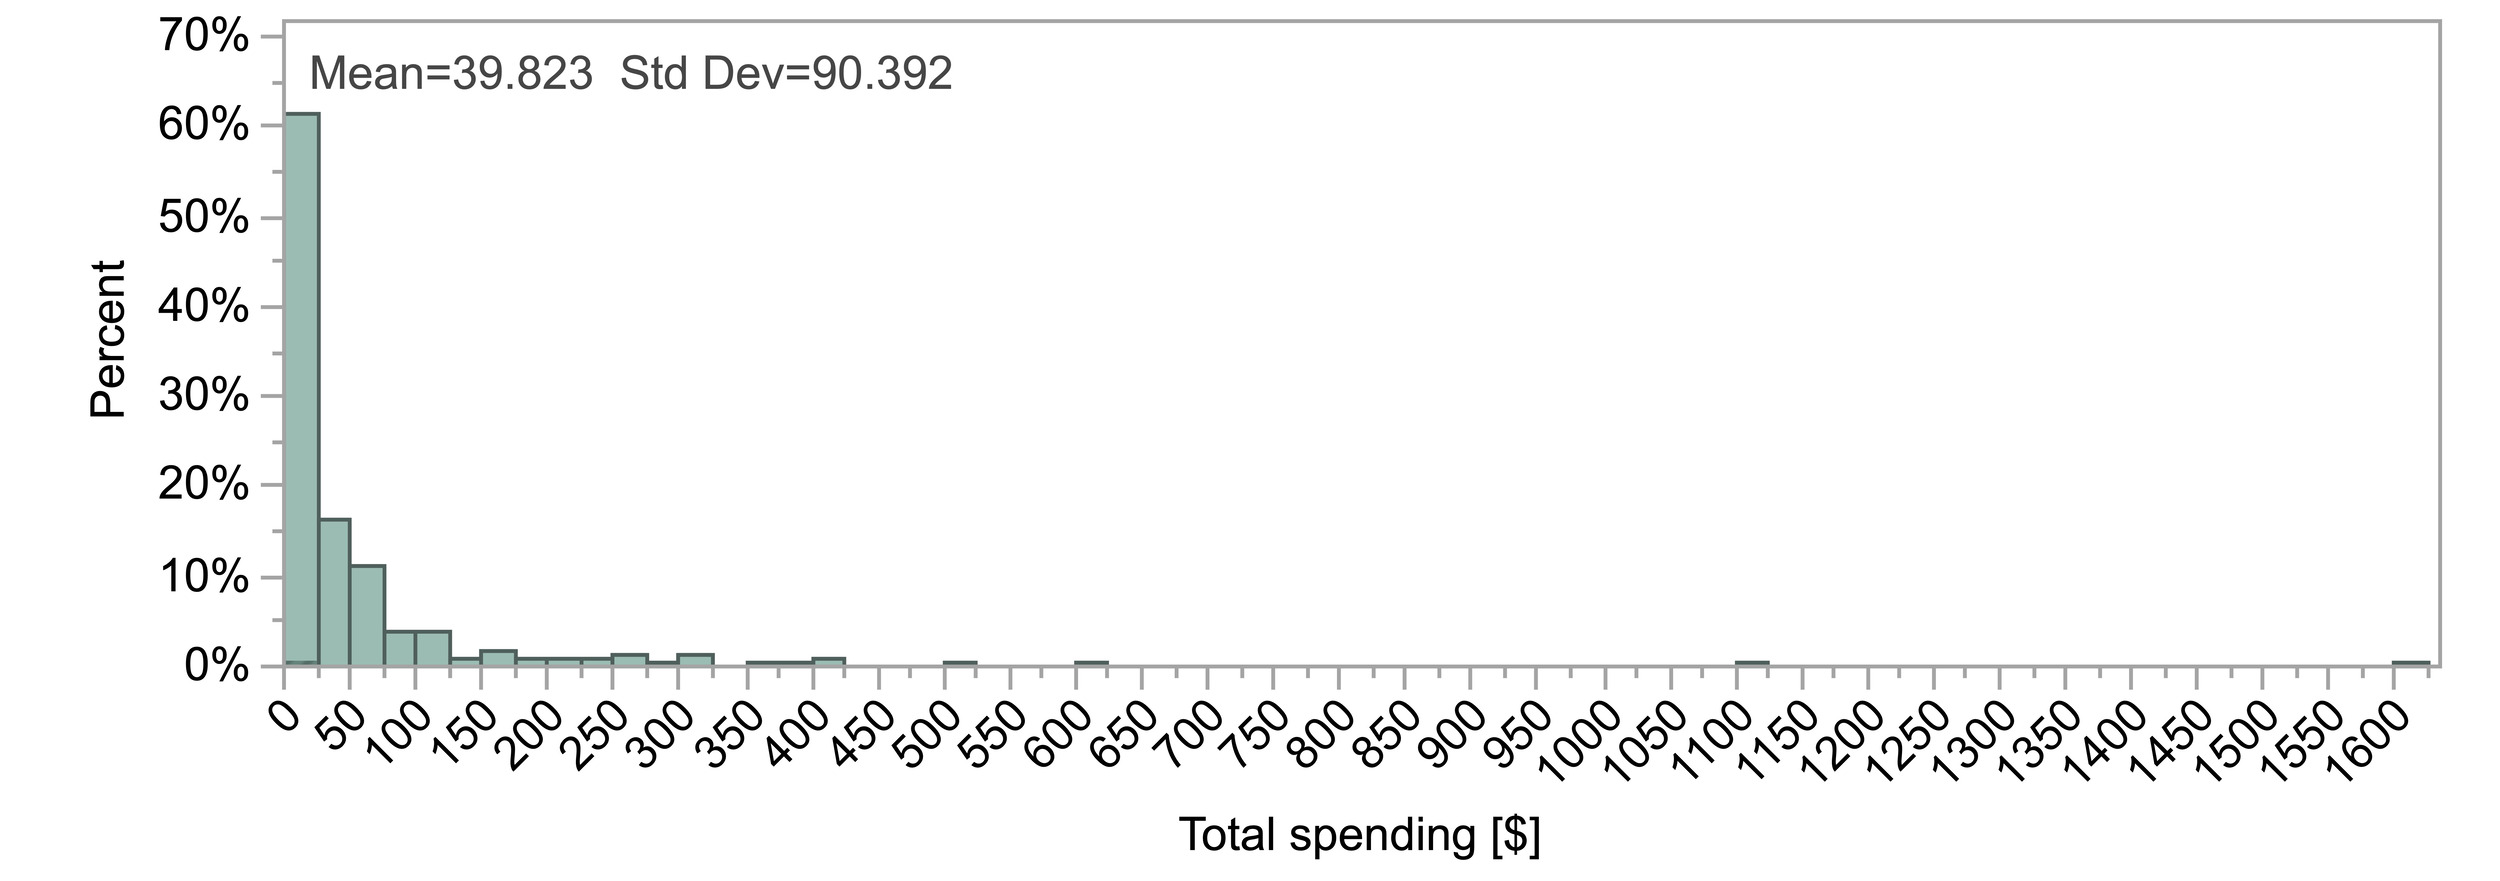
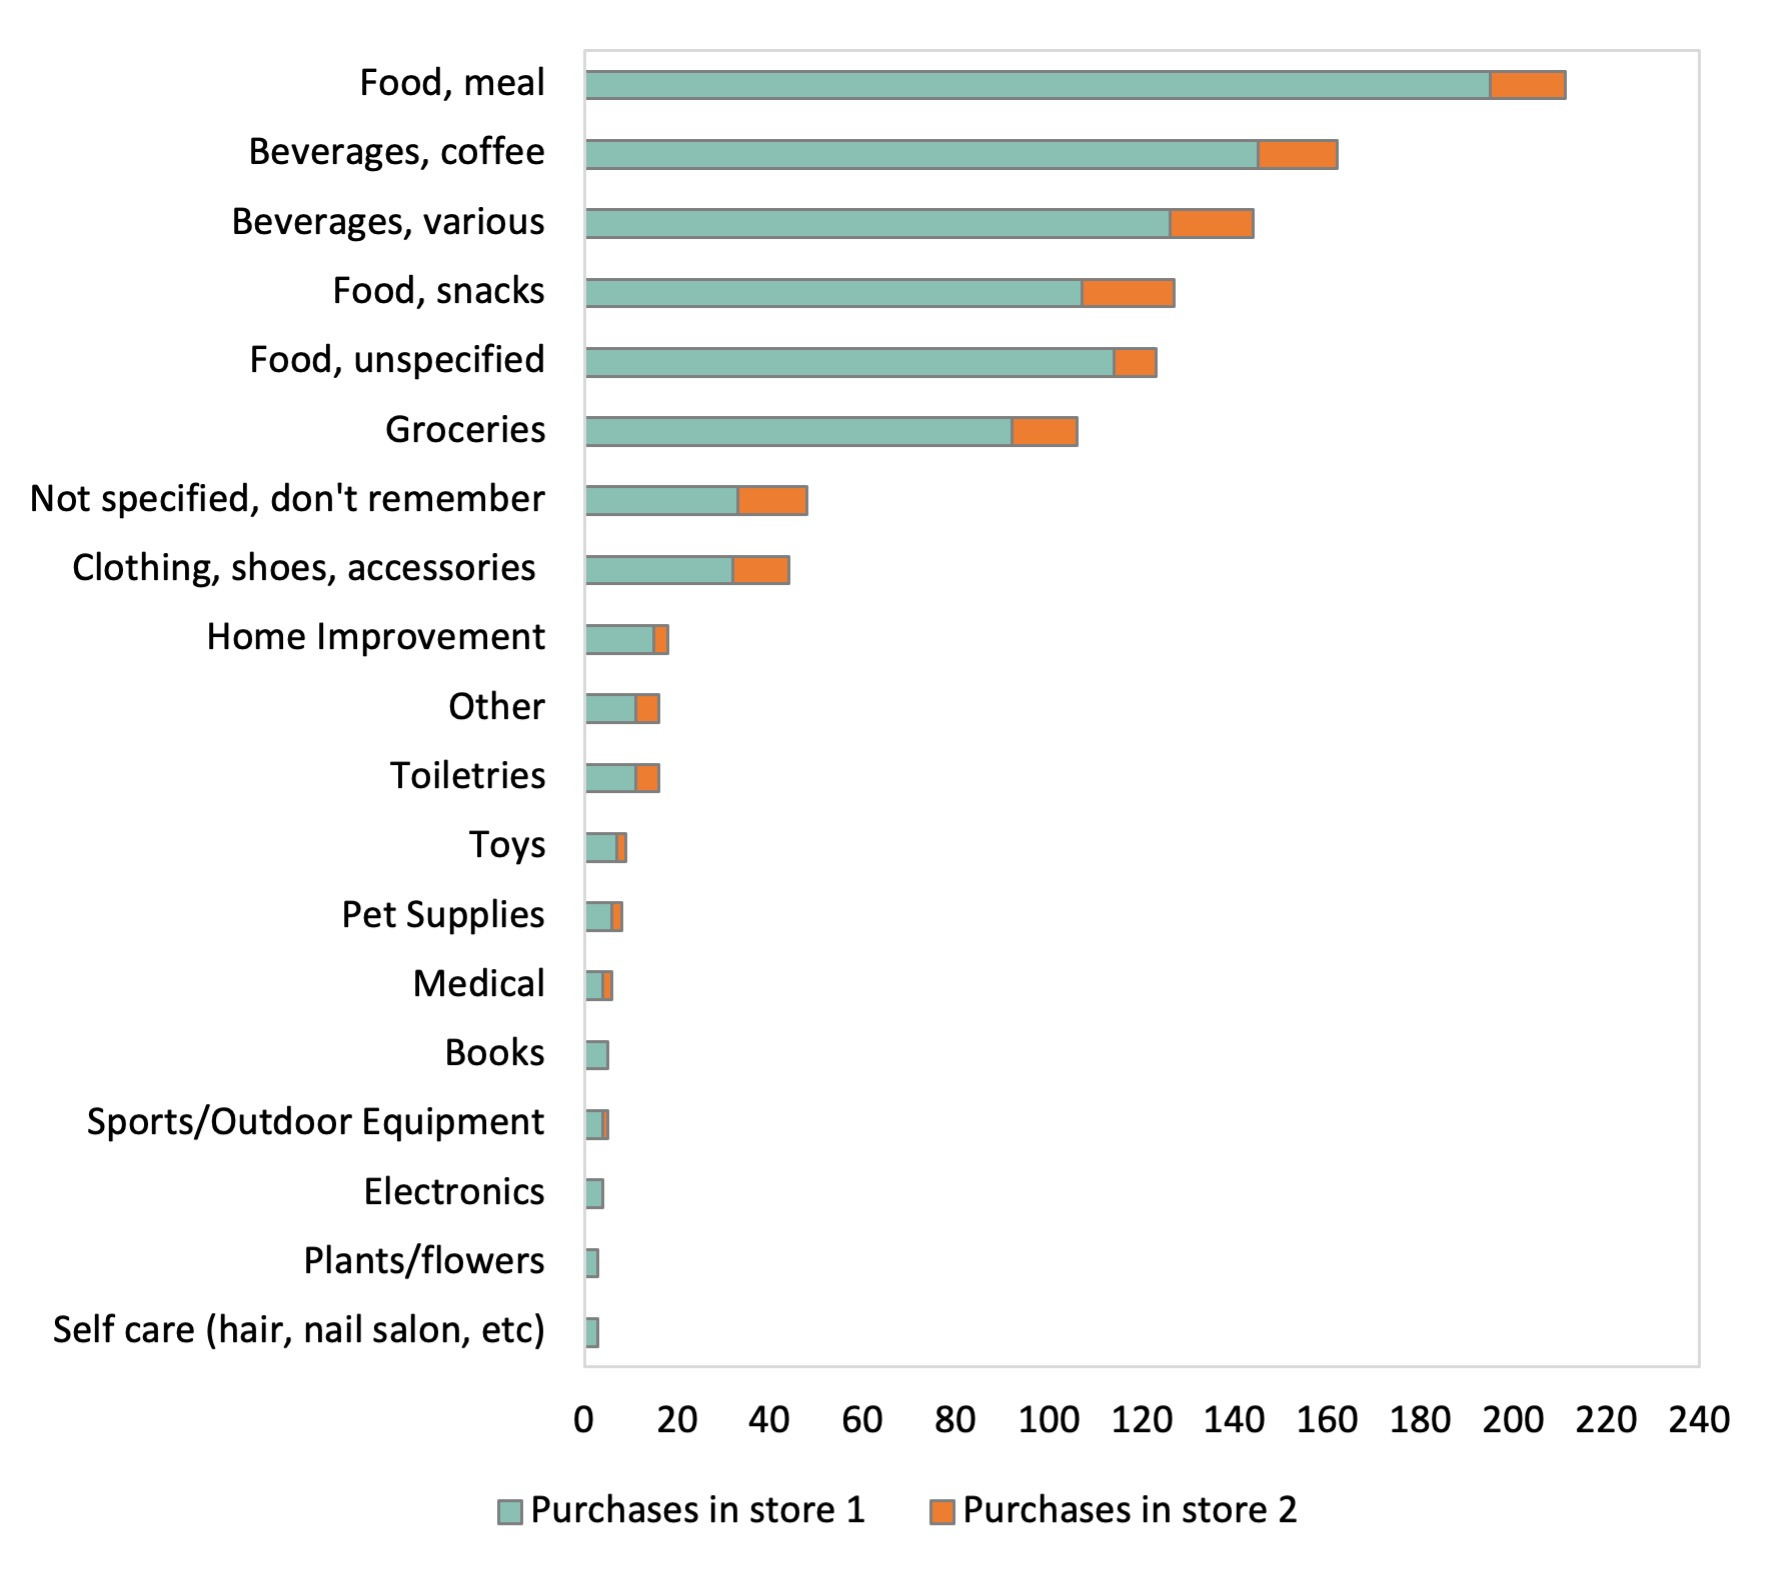
Whilst charging, 55% of respondents visited at least one store, restaurant, or other place to spend money and 44.5% (n=845) reported purchasing something. Table 1 shows a count of establishment types respondents visited, the mean spend in each establishment type, and the sum of all spending. Figure 3 shows a count of reported items from the first and second store respondents visited based on coded responses to an open text box question. Only items purchased for the first 2 stores visited were recorded, purchases in subsequent stores were not collected in the survey but only 4.5% of respondents visited more than 2 stores. Mean total non-charging spending on these items was $39.82, while the median was $17.00 (see Figure 2). The distribution of spending went to a maximum of $1,600 for one respondent. These mean and median values exceed expenditure on charging, though only 44.5% purchased something. Of the 845 that indicated making purchases, 812 respondents reported the cost of these items, and 777 provided information on the items purchased.
Spending per charging station
Based on the results of this study and some other assumptions it is possible to estimate the magnitude of spending by BEV drivers at amenities around the DCFC they use to charge. These estimates should be considered simplified estimates to illustrate the potential magnitude of spending around DCFC stations. How these estimates are derived is explained in Supplemental Information. Based on the average reported spending ($39.82), the percentage of drivers purchasing something (44.5%), average DCFC utilization of approximately 7 to 10 charging sessions per day (EVgo 2026; Paren 2025), an estimated $45,274 to $64,677 in annual spending may occur around DCFC by BEV drivers visiting a single DCFC (i.e., one charger, not a station, which includes multiple chargers). Some of this spending (6%) is from sessions where the primary reason for being at the location was the reported activities (e.g. shopping) and may have occurred regardless of whether a DCFC was present. However, 77% of reported sessions in this sample occurred when the primary reason for the session was charging. Among this subset, average spending was lower ($26.67), and a smaller share of respondents (35%) made a purchase. Using these values as assumptions and adjusting expenditure estimates so they only apply to the 77% of sessions attributable to charging, non-charging expenditure associated with a single DCFC may total approximately $18,364 to $26,234 annually. These values are similar to a 2019 estimate from Zheng et al. (2024) of $22,813.
Acknowledgements
The author would like to thank the State of California for its support of university-based research. Thank you to Matthew Favetti for programming the survey used in this study, and to Sonali Senthil for coding the qualitative data collected in the survey.
Competing interests
The author has no competing financial or non-financial interests related to this study. This study was made possible with funding received by the University of California Institute of Transportation Studies from the State of California through the Road Repair and Accountability Act of 2017 (Senate Bill 1). The grant ID for this study is UC ITS ID 2025-12.