1. Questions
Travel behaviour evolves over the life course as individuals enter education, join the workforce, form households, raise children, and retire. These transitions influence mobility needs, access to transport resources, and travel roles; for example, children often depend on adults for school and activity trips, adults shift toward independent driving, and older adults may again rely on others for some trips. Such lifecycle changes have well-documented effects on car ownership and mode use (Clark et al. 2014; 2016; Scheiner and Holz-Rau 2013).
Most studies focus on travel modes rather than the roles individuals play within car travel, leaving passenger travel relatively understudied. Travelling as a vehicle passenger represents a distinct form of mobility that reflects dependence on others for access to destinations and activities and is closely linked to household coordination and shared vehicle use (Dargay and Hanly 2007). This is particularly relevant in car-dependent metropolitan regions, where children, older adults, and people with limited vehicle access may depend on household members or others for access to routine activities.
Passenger travel is therefore expected to follow a systematic trajectory, declining as individuals gain driving independence and increasing again in later life as driving ability changes (Haustein 2012). Understanding this pattern provides insight into mobility dependence, household travel coordination, and planning challenges beyond conventional mode-based analyses.
Therefore, this study addresses the following questions:
-
How does passenger travel vary across lifecycle stages in Greater Melbourne?
-
How are gender, household structure, car availability, and trip purpose associated with the likelihood of travelling as a passenger rather than as a driver?
2. Methods
2.1. Study area and data
The analysis focuses on Greater Melbourne, a metropolitan region of approximately five million residents characterised by high private car dependence. Travel behaviour data were obtained from the Victorian Integrated Survey of Travel and Activity (VISTA)[1] 2012-2020 (Department of Transport and Planning, Victoria 2024).
The study includes all non-recreational trips originating from home (66,233 trips), after removing trips tagged as “Recreational” in VISTA, as they are more leisure-oriented and may reflect travel behaviour distinct from routine mobility needs, consistent with similar studies (Tiwari et al. 2025; 2026). For the binary logistic regression model, the sample is restricted to adult travellers (aged 18+) who undertake car-based trips, yielding 41,547 trips.
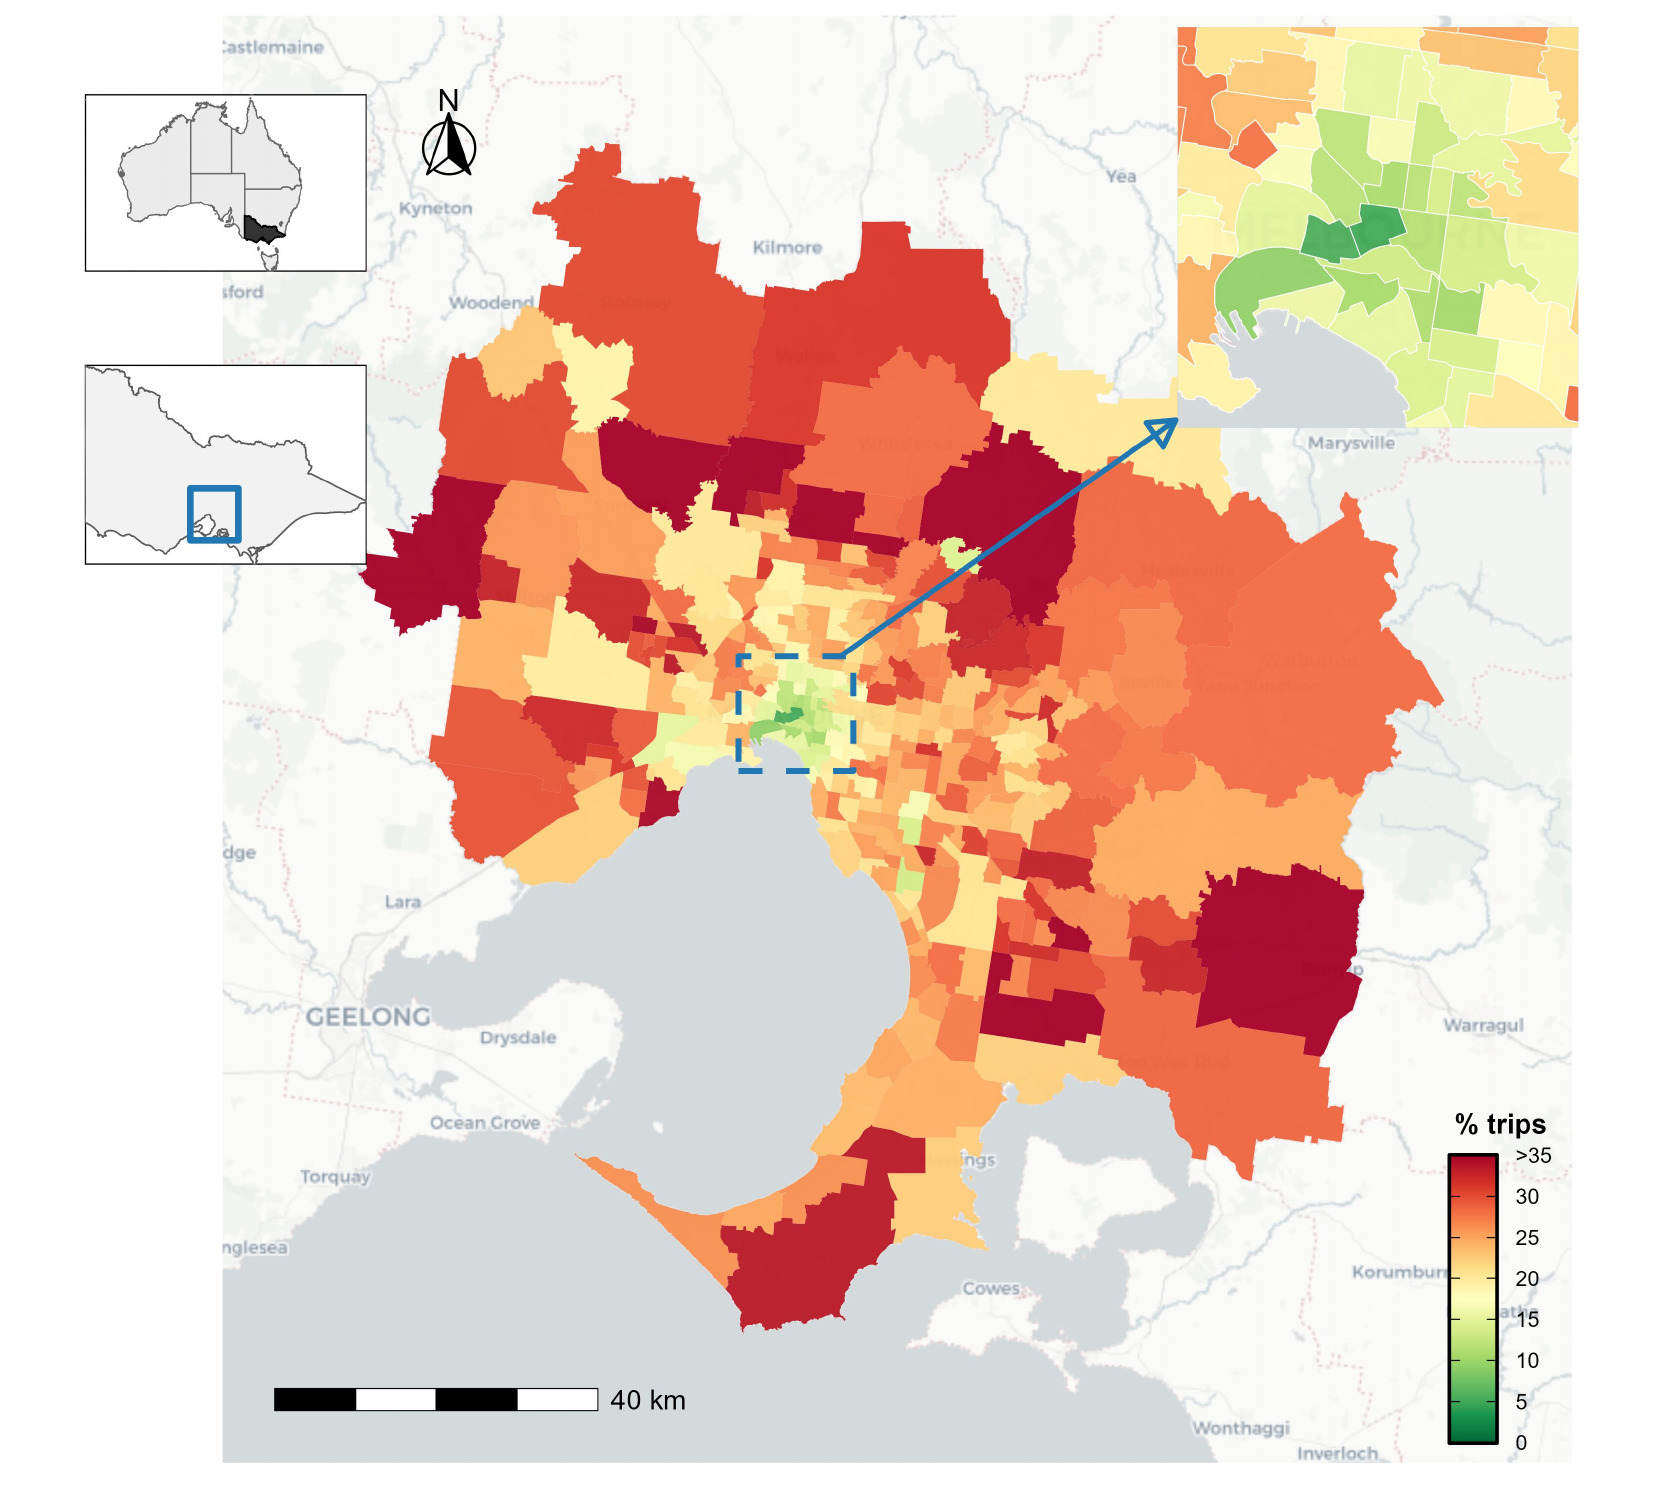
Figure 1 shows the spatial distribution of vehicle passenger mode share across Statistical Area Level 2 (SA2)[2] regions in Greater Melbourne, with lower shares in central areas and higher reliance in outer suburban areas where car-based travel dominates.

-
Early childhood (0–5)
-
School age (6–12)
-
Teen (13–17)
-
Young adult (18–24)
-
Early working age (25–34)
-
Family formation (35–44)
-
Mid-life (45–54)
-
Older working age (55–64)
-
Older adult (65+)
2.2. Binary logistic regression model of travel role choice
To examine factors associated with travelling as a passenger rather than as a driver, a binary logistic regression model is estimated using adult car trips. The model is restricted to adults aged 18+ because the outcome compares passenger and driver roles in car travel; children and adolescents are excluded because they do not have comparable access to independent driving. The sample is limited to car-based trips because the model examines travel role, not mode choice. Let if trip is made as a vehicle passenger and if it is made as a driver. The probability of travelling as a passenger is given by
P(Yn=1)=exp(Vn)1+exp(Vn),
where is the systematic utility associated with travelling as a passenger. The utility function is specified as
Vn=β0+β⊤LLn+βgSn+β⊤HHn+βcCAn+β⊤PPn.
where the variables are defined as follows:
-
Lifecycle stage : indicators for adult lifecycle stages 18–24, 25–34, 45–54, 55–64, and 65+, with ages 35–44 as the reference group.
-
Gender: if the individual is male, 0 otherwise.
-
Household size : indicators for two-person and three-or-more-person households, with single-person households as the reference.
-
Car availability: indicates limited car availability, defined as less than one car per person, while indicates at least one car per person and serves as the reference category.
-
Trip purpose : indicators for education, shopping/personal, social, escort, and other trips, with work as the reference category. In this context, escort refers to trips recorded in VISTA as accompanying someone or picking up/dropping off someone.
The model is estimated using survey weights, following standard discrete-choice modelling approaches.
3. Findings
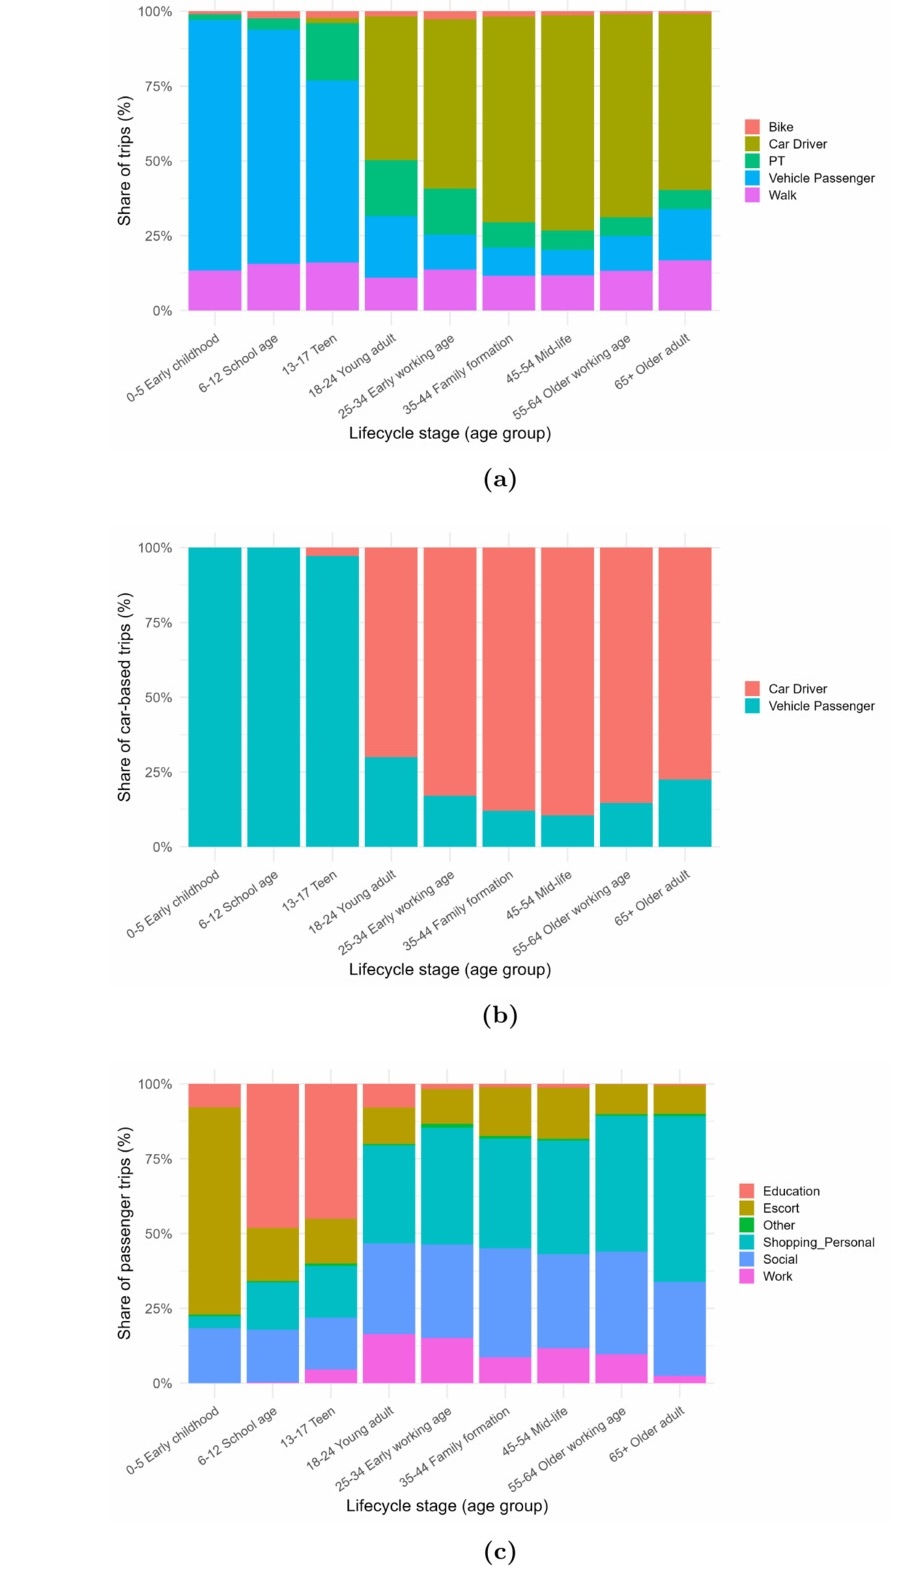
Vehicle passenger travel exhibits a pronounced U-shaped lifecycle pattern, reflecting transitions in mobility independence. As shown in Figure 2a and Table 1, passenger share is highest in childhood (above 75%), remains substantial among teenagers, and declines sharply in early adulthood to around 20%, reaching its lowest levels during prime working ages (below 10%). Passenger shares increase again in later life, indicating a shift from dependence to independence and partial dependence over the life course.
_mode_shares__(b)_driver_vs_pa.jpeg)
Childhood mobility is dominated by passenger travel, whereas adulthood is characterised by a transition to driving. Within car-based travel (Figure 2b), the passenger role is progressively replaced by the driver role, peaking in mid-life before declining slightly at older ages, showing that lifecycle transitions influence travel roles as well as mode choice.
Passenger trip purposes also vary systematically across lifecycle stages (Table 1, Figure 2c). Early-life passenger travel is dominated by escort and education activities, while adulthood shifts toward discretionary travel. Shopping and personal trips become the dominant purpose across adult groups and increase with age, while social travel remains important.
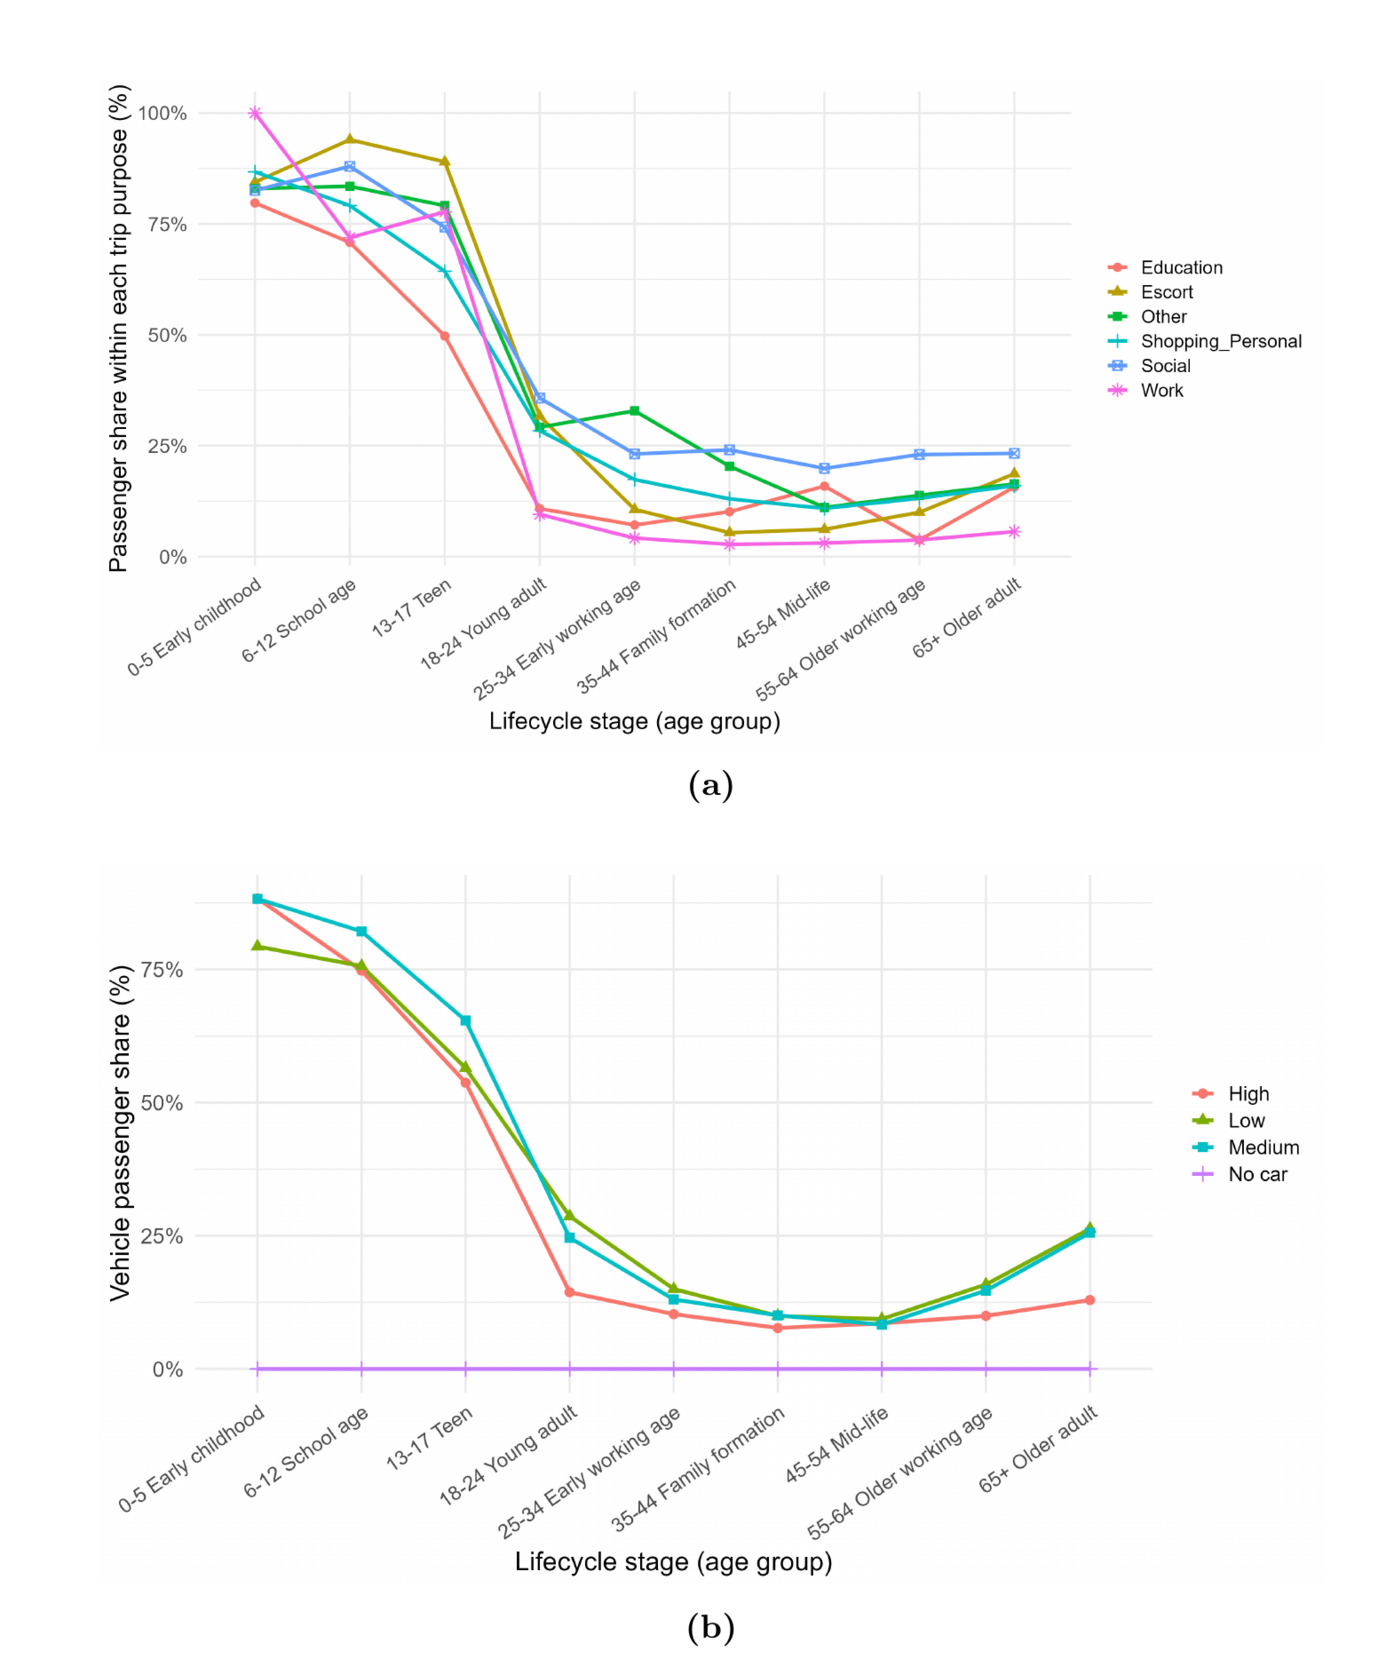
Figure 3a further shows that passenger shares are higher across most trip purposes in childhood and adolescence, before declining sharply in adulthood. Passenger travel patterns also vary by household structure and vehicle availability (Figure 3b). Larger households and lower car availability are consistently associated with higher passenger shares, particularly among young and older adults, suggesting links with shared mobility and resource constraints.
_variation_by_trip_purpose__(b)_e.png)
Overall, passenger travel emerges as a structured and lifecycle-dependent form of mobility, rather than a residual outcome of car use.
Table 2 summarises key mobility patterns, trip purposes, and socio-demographic characteristics across lifecycle stages. It shows that lifecycle differences in passenger travel coincide with systematic variation in licence holding, household size, car availability, income, and trip distance, providing descriptive context for the regression analysis.
Table 3 shows clear differences in the likelihood of travelling as a passenger rather than as a driver. Young adults (18–24) are substantially more likely to travel as passengers (OR=3.78) than the reference group aged 35–44, with higher likelihoods also observed among early working-age adults (25–34, OR=1.70), older working-age adults (55–64, OR=1.45), and older adults (65+, OR=2.07). In contrast, the mid-life group (45–54) shows no statistically significant difference from the reference group, suggesting peak driving independence during these central working years.
Gender differences are substantial, with males significantly less likely to travel as passengers (OR=0.35), reinforcing a strong tendency to assume the driver role.
Household context is strongly associated with passenger travel. Individuals in two-person households (OR=5.67) and larger households (OR=4.41) are far more likely to travel as passengers than those in single-person households, highlighting the link with shared mobility and intra-household coordination. Similarly, limited car availability is also associated with a higher likelihood of passengers (OR=1.75), indicating constraints on access to independent driving.
Trip purpose further differentiates travel roles. Relative to work trips, discretionary activities are associated with higher passenger likelihood, particularly social trips (OR=7.34) and shopping/personal trips (OR=4.12), while education (OR=2.72) and escort trips (OR=1.53) are associated with higher passenger likelihood. Overall, the model demonstrates that passenger travel is systematically shaped by lifecycle stage, gender roles, household structure, resource constraints, and trip purpose.
Overall, this study highlights vehicle passenger travel as a distinct and lifecycle-structured form of mobility that reveals hidden patterns of dependence, household coordination, and unequal access to independent travel.
VISTA is an ongoing survey of household travel activity in Victoria, where all members of sampled households complete a one-day travel diary. https://discover.data.vic.gov.au/dataset.
Statistical Area Level 2 (SA2) units defined by the Australian Bureau of Statistics, typically represent areas of around 10000 residents.