

1. Questions
Waymo, a subsidiary of Alphabet Inc., launched the United States’ first full-time commercial autonomous rideshare service in San Francisco in August 2023. Robotaxi services, by Waymo and other players, have since rapidly expanded across California and other states (Business Insider 2025). In conventional rideshare (e.g., Uber and Lyft) deadheading, the miles driven without a fare-paying passenger, has been estimated to exceed 40% of the total vehicle miles traveled (VMT) (Henao et al. 2019), and research suggests that autonomous vehicles are unlikely to change the resistance of auto users to shared services that may help reduce this inefficiency and its negative impacts on urban congestion (Schaller 2021). In this study, we ask: (1) What proportion of Waymo’s total VMT in California is driven without a passenger onboard? (2) How has this proportion changed over the first approximately 1,000 days of commercial service? (3) Do trip volume growth and geographic service expansion lead to observable efficiency gains that reduce deadheading?
2. Methods
We analyze aggregated operational data that Waymo reports quarterly to the California Public Utilities Commission (CPUC), as required by all autonomous vehicle (AV) passenger service providers in California (California Public Utilities Commission 2026). The publicly available reports are highly redacted due to confidentiality claims by the AV operators. Unredacted, however, are monthly aggregated records of total trips completed, passengers carried, and VMT disaggregated into three periods: (i) VMT Period 1: miles driven as vehicles reposition and await rider requests; (ii) VMT Period 2: miles driven traveling to a confirmed passenger pick-up location; and (iii) VMT Period 3: miles driven from passenger pick-up to drop-off. We define deadheading broadly as the sum of miles traveled in the first two periods.
3. Findings
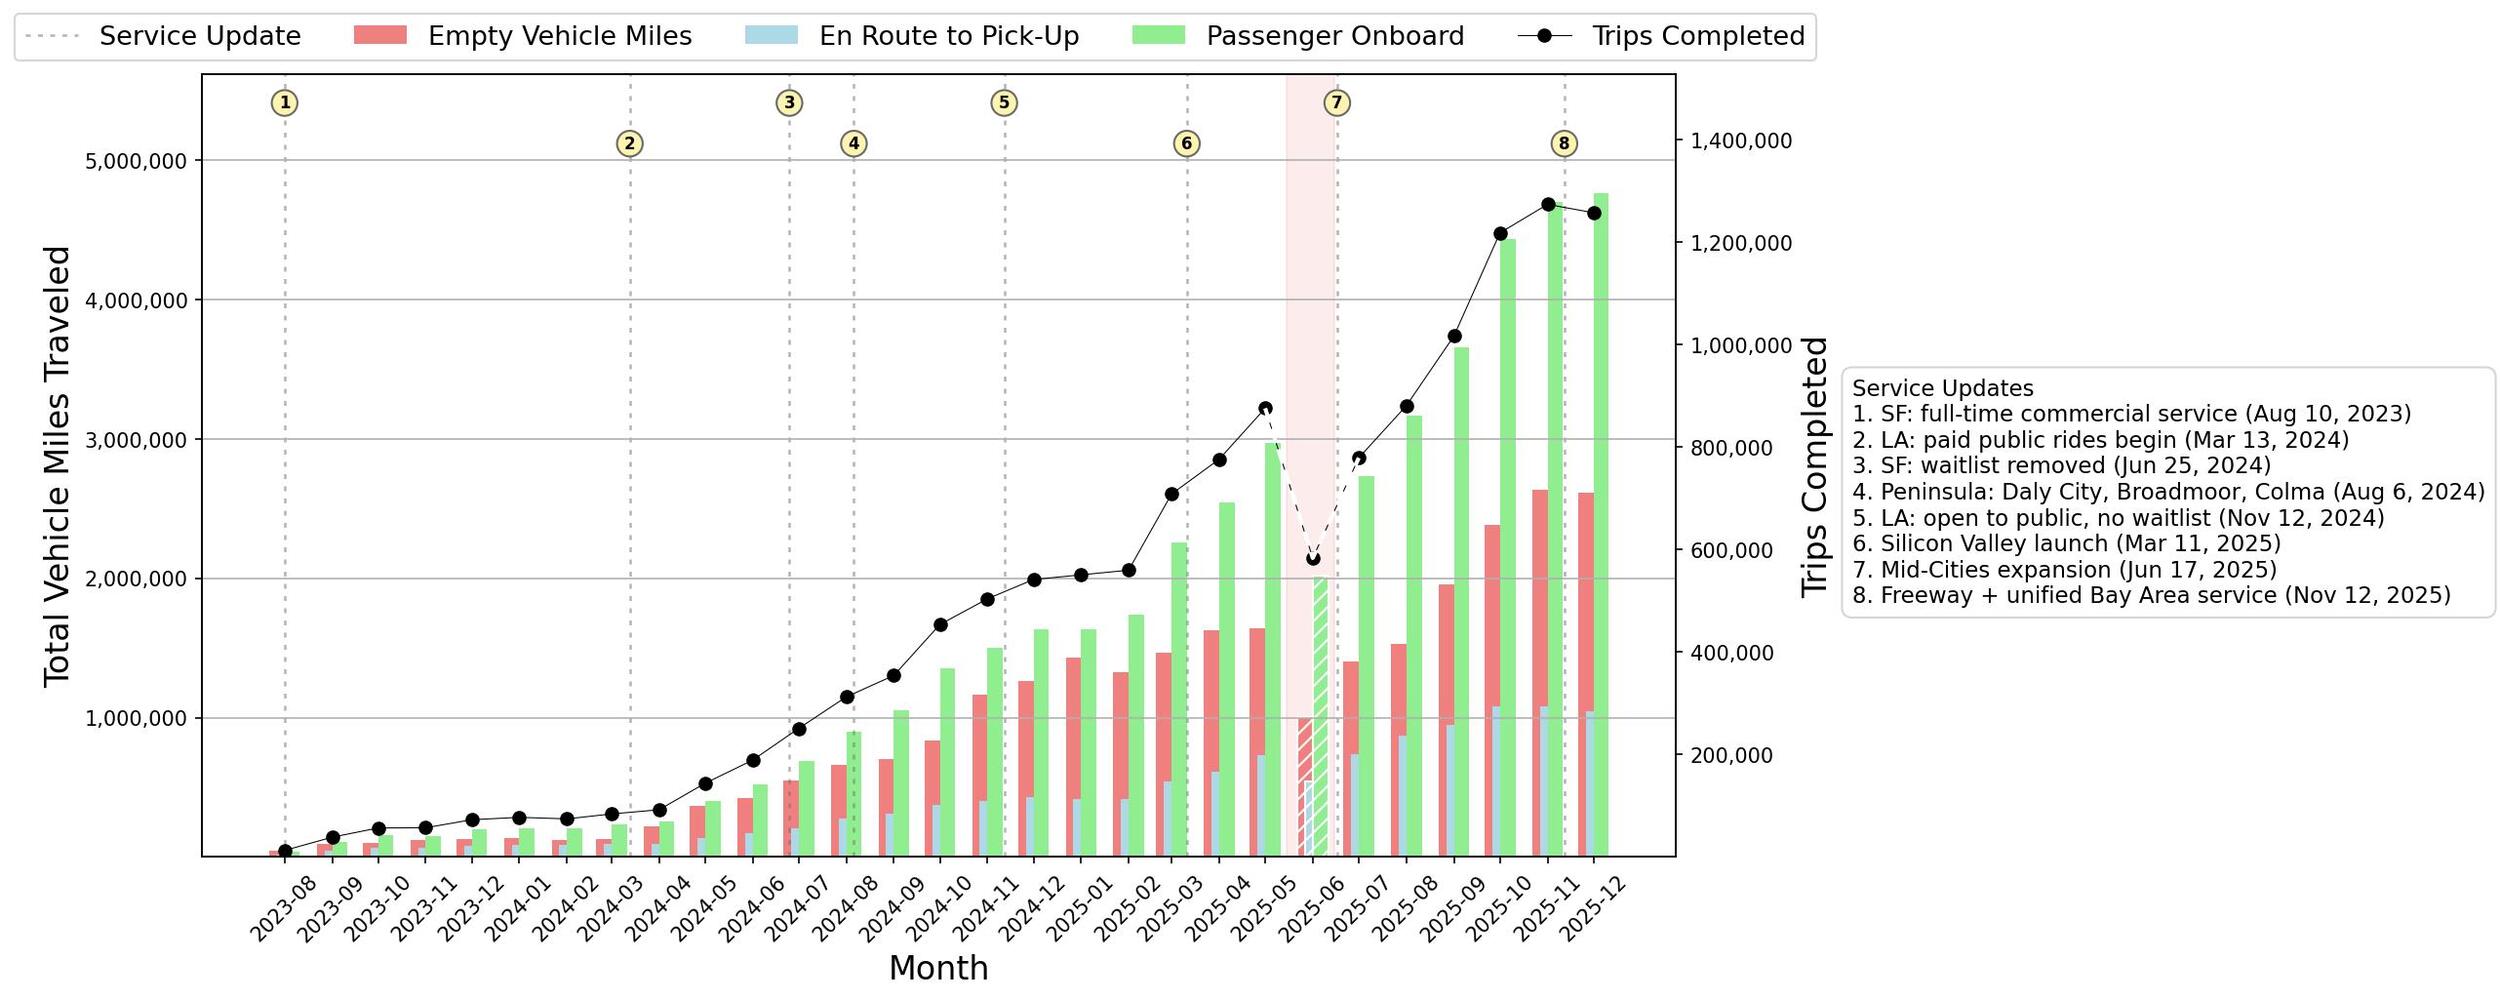
A key observation is the dramatic growth of Waymo’s service in the 29-month period of analysis, averaging an excess of 15% every month, and reaching as high as 50% in mid-2024 as the service was expanded into Los Angeles and waitlist restrictions in San Francisco were removed. This growth is clearly illustrated in Figure 1. In addition to VMT and trip volume growth, the figure illustrates key Waymo service milestones in the state of California to help identify the drivers of observed growth. A temporary decline in both trips and VMT is highlighted during June 2025 as service was suspended in Los Angeles due to civil unrest. Throughout the entire study period, empty vehicle miles and miles traveled en route to pick-up persistently constituted a substantial share of the monthly total VMT.
_of_waymo_vehicles_across_california.jpeg)
Figure 2 illustrates the persistence of deadheading in Waymo’s California operations. The dashed lines represent the 3-month moving averages. As observed in the figure, the share of total VMT with a passenger onboard started at just 36% in the first month of commercial service. While there has been an improvement in this metric as the service scaled, it plateaued between 55-57% since mid-2025, meaning that roughly 43-45% of all VMT remain without a passenger, and in the case of a robotaxi, any human, onboard. Over the full study period, the overall passenger onboard share of the total mileage logged was approximately 53.6%.
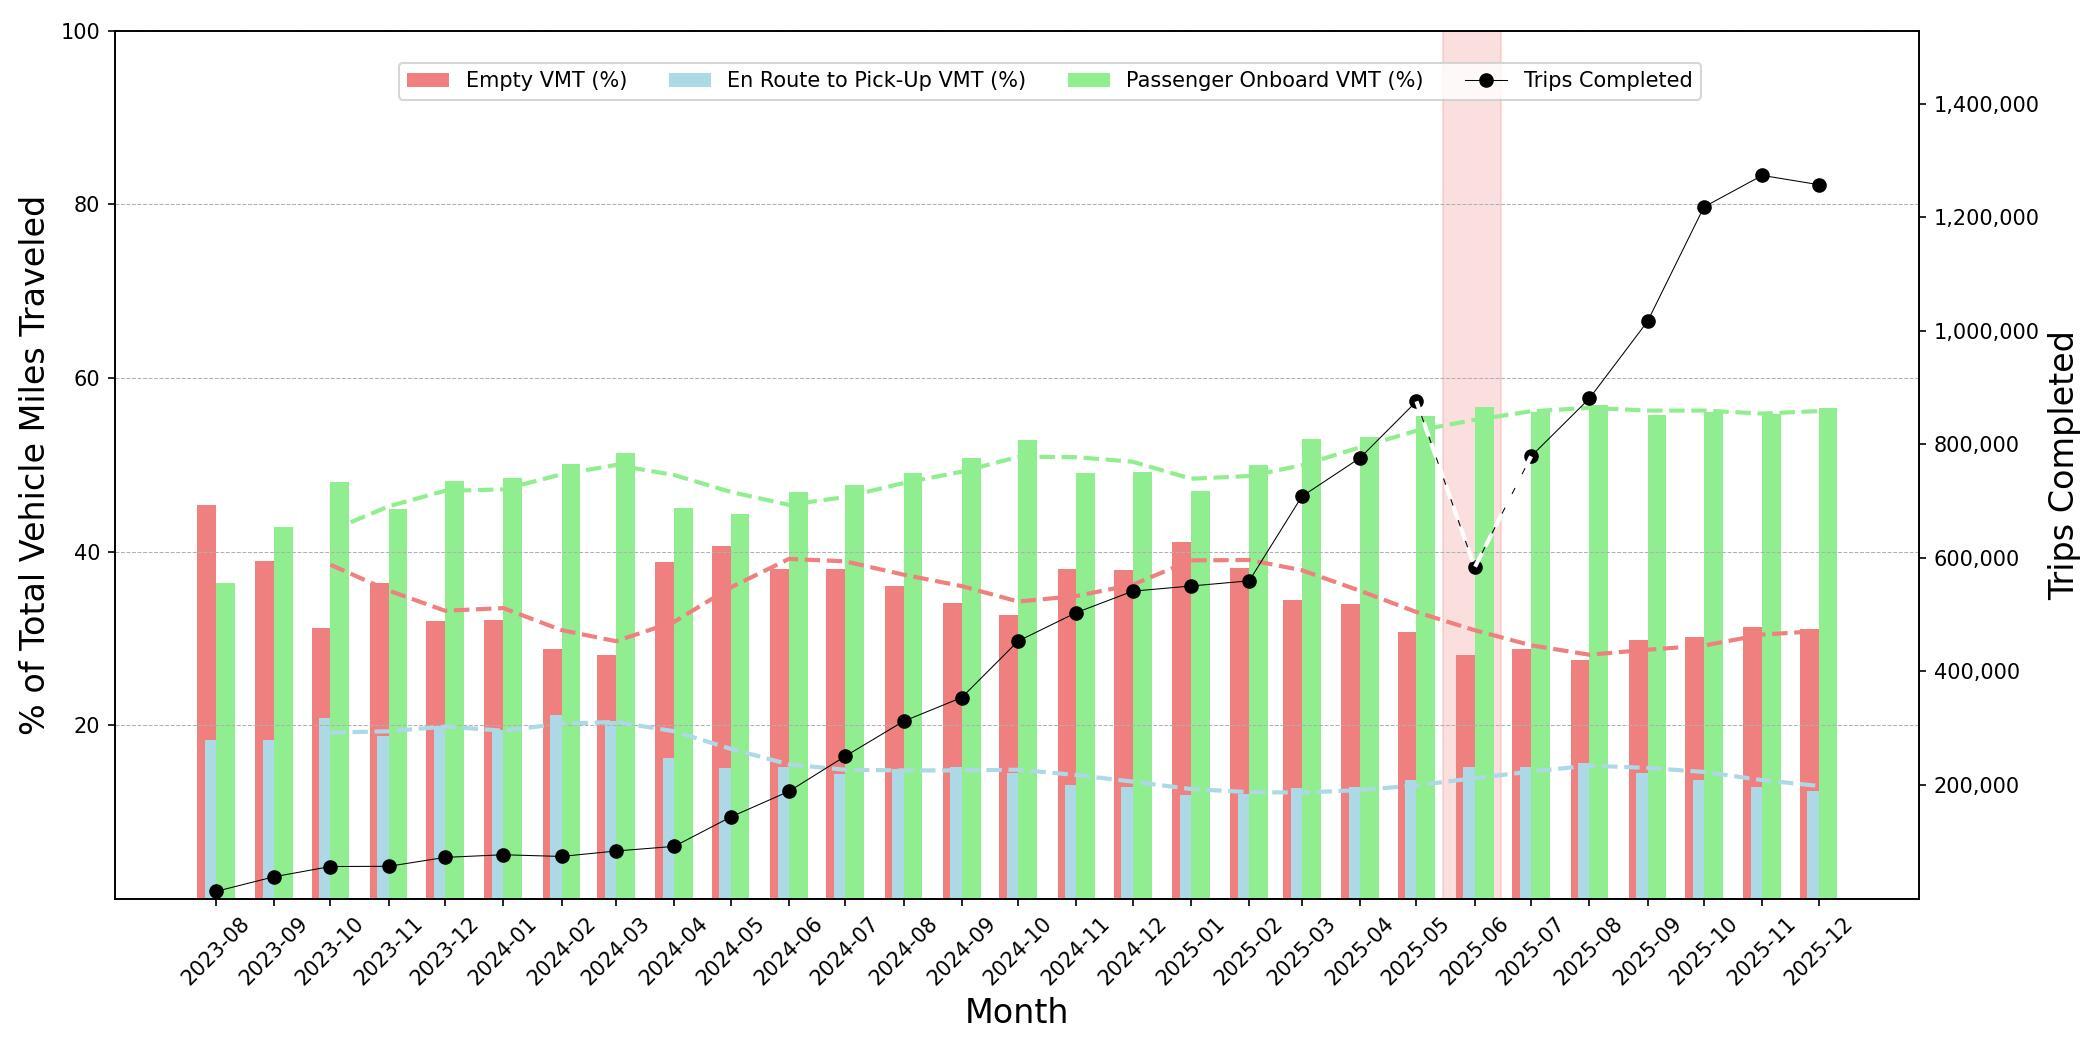
Looking at the other components of VMT periods, we observe that the VMT en route to pick-up has slowly but steadily declined throughout the study period. This is likely attributable to growth in fleet size and ridership base, allowing vehicles to be more evenly distributed across the service areas. This is also reflected in the time that vehicles wait between ending one passenger trip and initiating the next, which has decreased by an average of 3.15% monthly, averaging ~18 minutes by the end of 2025 down from an overall average of 28.6 minutes since the commencement of commercial operations. Unlike the latter two VMT periods, however, there doesn’t seem to be a particular trend regarding the first-period (empty) VMT, which continued to fluctuate over the period of analysis.
Zooming in to the per-trip level, we find that the average deadheading miles per trip have substantially decreased from approximately 5.1 miles in August 2023 to roughly 2.8 miles at the end of 2025, as illustrated in Figure 3.
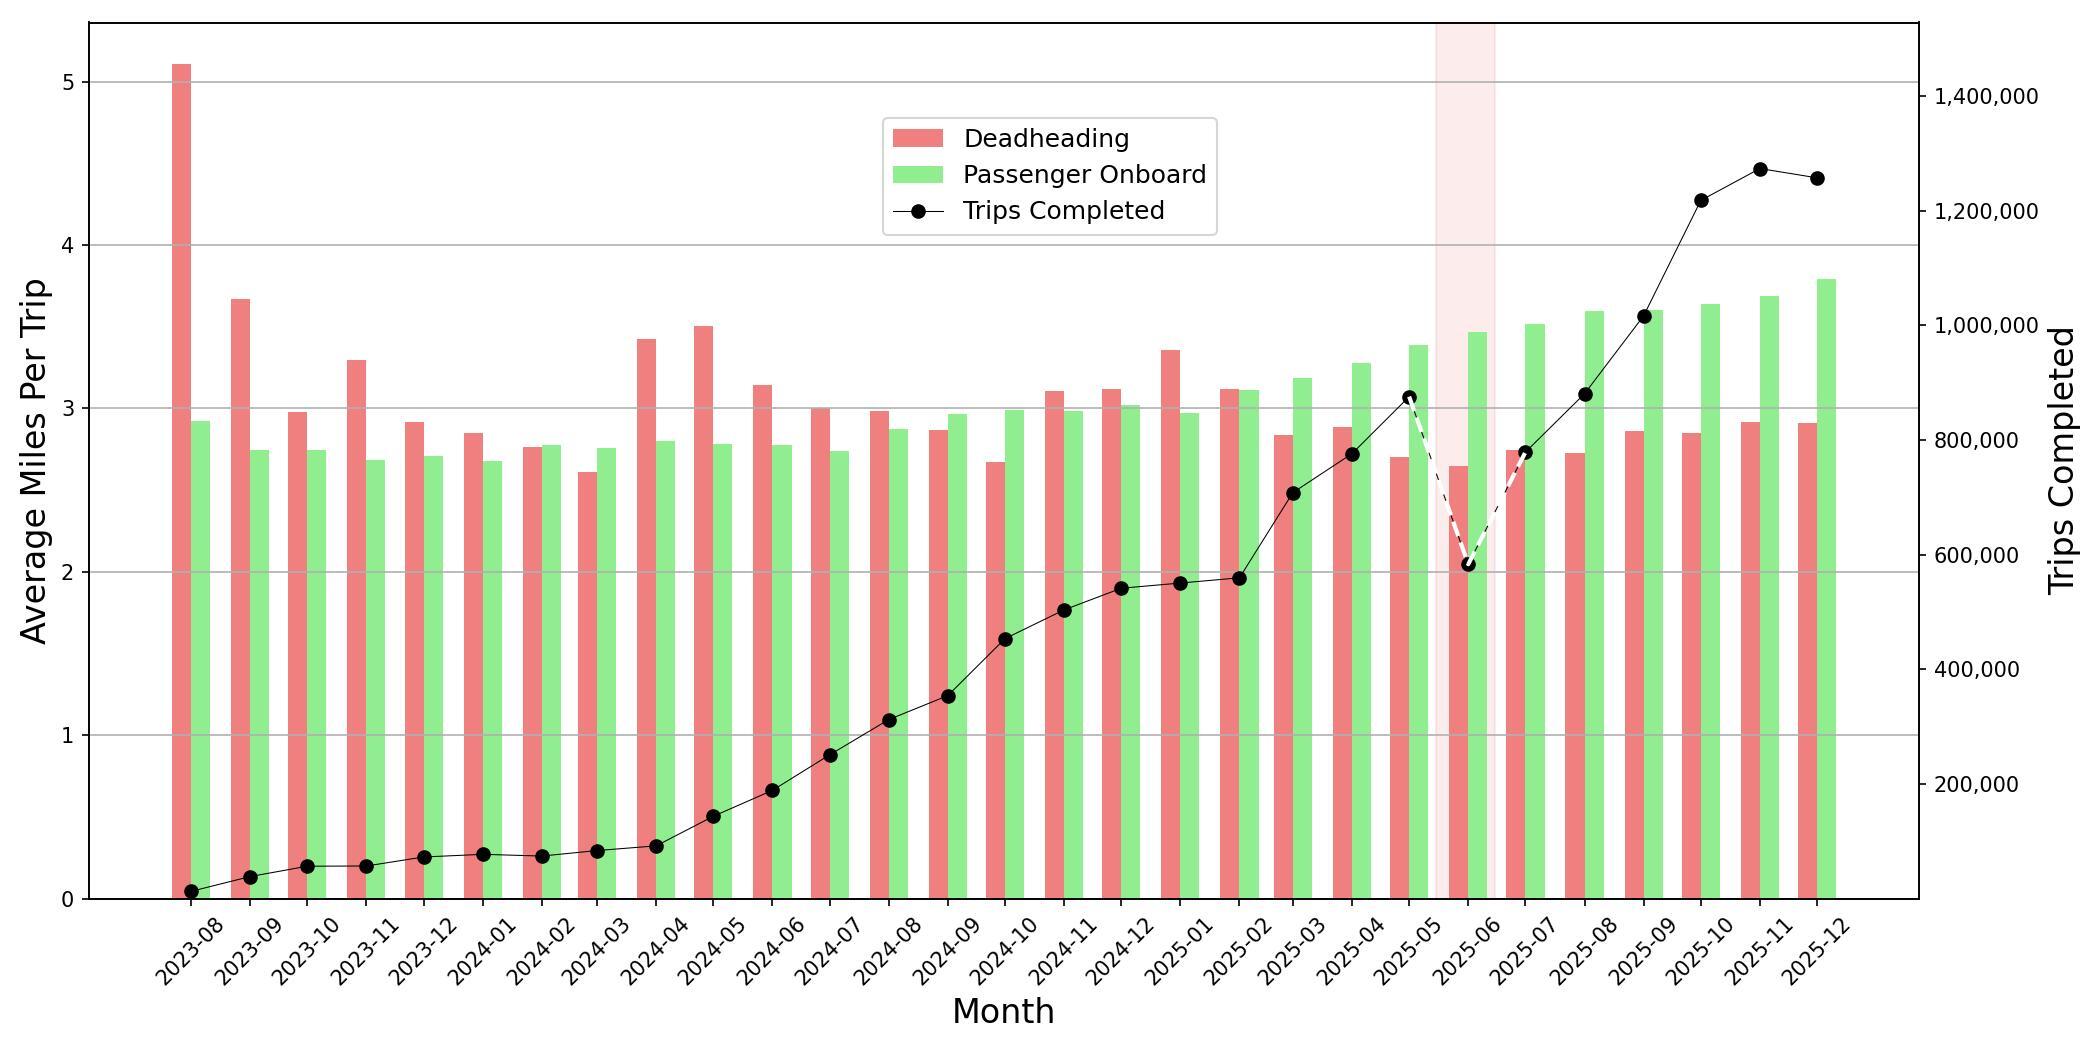
Finally, the average VMT with passengers onboard has grown since mid-2025, likely as a result of geographic expansions into lower-density suburban areas and the introduction of freeway services. This has led to a notable crossover in the second half of 2025 as passenger miles, on average, started to consistently exceed the average deadheading miles per trip. As observed in Figure 2, however, this trend has had a minimal impact on the overall ratio of the total passenger onboard VMT. Additionally, the average number of passengers per trip, throughout the study period, has consistently hovered around 1.4, indicating a low propensity for shared rides. Those findings are in line with previous research, which suggests the need to balance both service area expansion and dynamic ride sharing to reduce empty VMT (Gurumurthy et al. 2021), and a more recent study in San Francisco, which provides evidence that while there certainly is individual interest, a broader social acceptance for robotaxis is still lagging (Greifenstein et al. 2026).
Acknowledgements
This work was partially supported by the Aspen Institute Science and Technology Policy Fellowship. Generative AI provided by Grammarly has been used to improve the presented text’s grammar, spelling, and wording. Claude was used to improve the python code for data visualization. No content has been AI-generated.