This website uses cookies

We use cookies to enhance your experience and support COUNTER Metrics for transparent reporting of readership statistics. Cookie data is not sold to third parties or used for marketing purposes.

Skip to main content
null
Findings
  • Menu
  • Articles
    • Energy Findings
    • Resilience Findings
    • Safety Findings
    • Transport Findings
    • Urban Findings
    • All
  • For Authors
  • Editorial Board
  • About
  • Blog
  • search
  • X (formerly Twitter) (opens in a new tab)
  • LinkedIn (opens in a new tab)
  • RSS feed (opens a modal with a link to feed)

RSS Feed

Enter the URL below into your favorite RSS reader.

https://findingspress.org/feed
ISSN 2652-8800
Transport Findings
May 08, 2026 AEST

When public transit stops, bikes roll: Measuring the impacts of public transit strikes on bicycle sharing use in Montréal

Hisham Negm, Ahmed El-Geneidy,
Bicycle SharingDisruptionStrikeTransport Resilience
Copyright Logoccby-sa-4.0 • https://doi.org/10.32866/001c.161518
Findings
Negm, Hisham, and Ahmed El-Geneidy. 2026. “When Public Transit Stops, Bikes Roll: Measuring the Impacts of Public Transit Strikes on Bicycle Sharing Use in Montréal.” Findings, May 7. https://doi.org/10.32866/001c.161518.
Save article as...▾
Download all (3)
  • Figure 1. Difference in BIXI trips between a strike day (1 Oct 2025) and a non-strike day (8 Oct 2025) for departure and arrival trips
    Download
  • Figure 2. Difference in BIXI trips between a strike day (1 Oct 2025) and a non-strike day (8 Oct 2025) stratified by period of day for departure and arrival trips
    Download
  • Manuscript File
    Download

Error

Sorry, something went wrong. Please try again.

If this problem reoccurs, please contact Scholastica Support

Error message:

undefined

View more stats

Abstract

Public transit strikes reduce bus and metro service, prompting reliance on other modes of transport such as bicycle-sharing and testing the resilience of the transport system. This study examines the relationship between two public transit strikes in Montréal, Canada, in 2025 and ridership of BIXI, the city’s bicycle-sharing system. Using data on BIXI trip history, weather, Bike Score®, public transit infrastructure, and the Canadian census, we estimate multilevel regression models with crossed random effects to predict the number of BIXI trips at an aggregated hexagon level. Our results show a statistically positive association between public transit strike days and BIXI ridership. On average, ridership increased by 18% on strike days compared to a typical weekday with regular public transit service in 2025. These findings suggest that operational adaptations, such as increased staffing and bicycle redistribution, enhance the contribution of bicycle-sharing systems to transport system resilience during disruptions.

1. QUESTIONS

Bicycle-sharing systems can promote resilience in the transport system by providing an alternative for public transit in case of system disruptions (Cheng et al. 2022; Fuller et al. 2019; Saberi et al. 2018). In June and September/October 2025, two strikes at the Société de transport de Montréal (STM) led to a significant reduction in bus and metro service, presenting a natural experiment to examine the resilience of Montréal’s transport system. The strikes suspended STM service in off-peak hours (midday 09:45-14:45 and evening 17:45-23:00) from June 9 to 11 (Monday to Wednesday) and on Mondays, Wednesdays, and Fridays between September 22 and October 5, 2025 (Société de transport de Montréal 2025). In response to the strikes, BIXI, the docked bicycle-sharing system in Montréal, scaled up operations and staffing to maintain service by adding drop-off stations and staff near metro stations to manage bicycle returns when docks were full (Bourquin 2025). This study examines the relationship between the strikes and BIXI ridership while accounting for spatiotemporal factors (e.g., weather, built environment, period of day).

2. METHODS

We use a before-and-after approach with open-source BIXI trip data from 2025 (N = 3,579,696) and 2024 (N = 3,065,427). The 2025 dataset encompasses a week before, the weeks of, and a week after each of the two strikes, while the 2024 dataset provides the corresponding days from the previous year. Each trip includes start and end stations, date, and time. BIXI trips were aggregated spatially and temporally. On the spatial level, to account for yearly changes in station locations, trips were aggregated into 300-meter hexagons by assigning a departure and arrival hexagon to each trip. In total, we examine 904 hexagons covering 989 and 877 distinct BIXI stations in 2025 and 2024, respectively. On the temporal level, trips were aggregated for six periods of day (morning peak, midday, afternoon peak, evening, night, and late night).

We first conduct a visual analysis by mapping the difference between a strike and non-strike day ridership on the hexagon level. Then, we conduct two multilevel regression models with crossed random effects with two groupings, hexagon and weekday, to predict the rate of departures and arrivals per hexagon. These groupings account for location-specific differences (such as proximity to a popular destination) and systematic variation across days of the week that could bias fixed-effect estimates if not accounted for. The control variables for each hexagon included median income, population and job density, BIXI station capacity, Bike Score®, weather data, distance to the nearest metro station from centroid, number of bus stops, and dummy variables for different periods of the day (including an additional term for strike days), weekend, and year (2024 vs. 2025).

3. FINDINGS

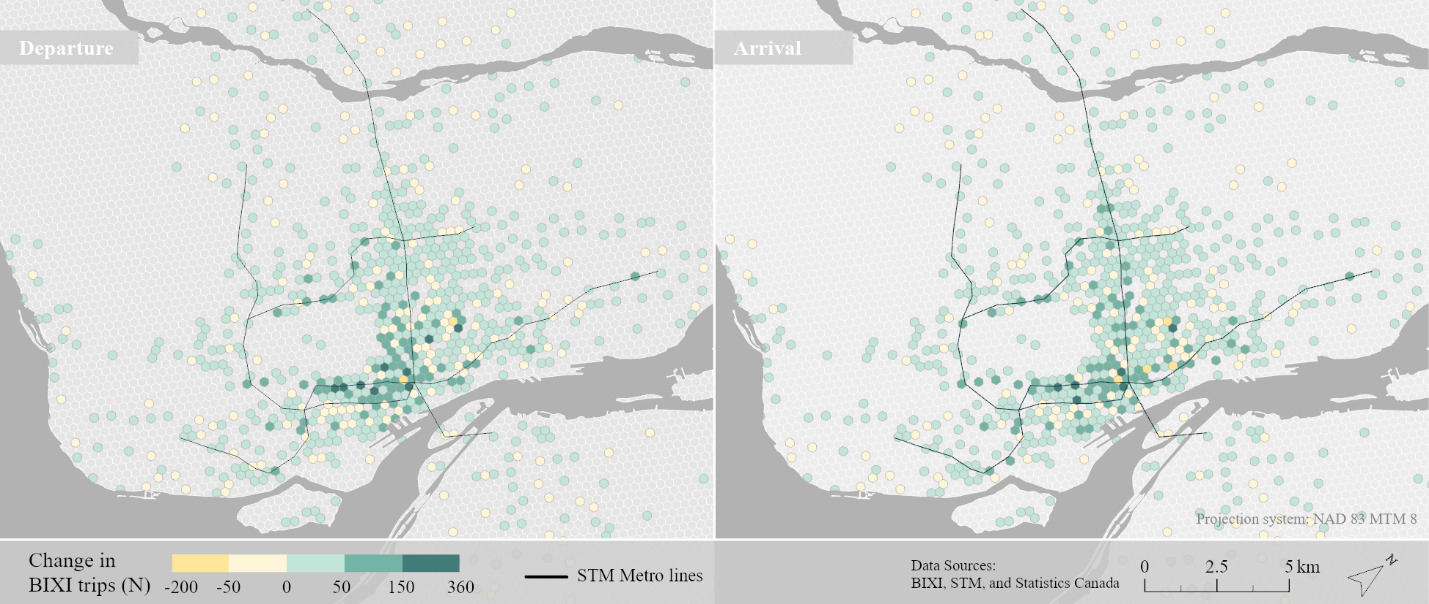
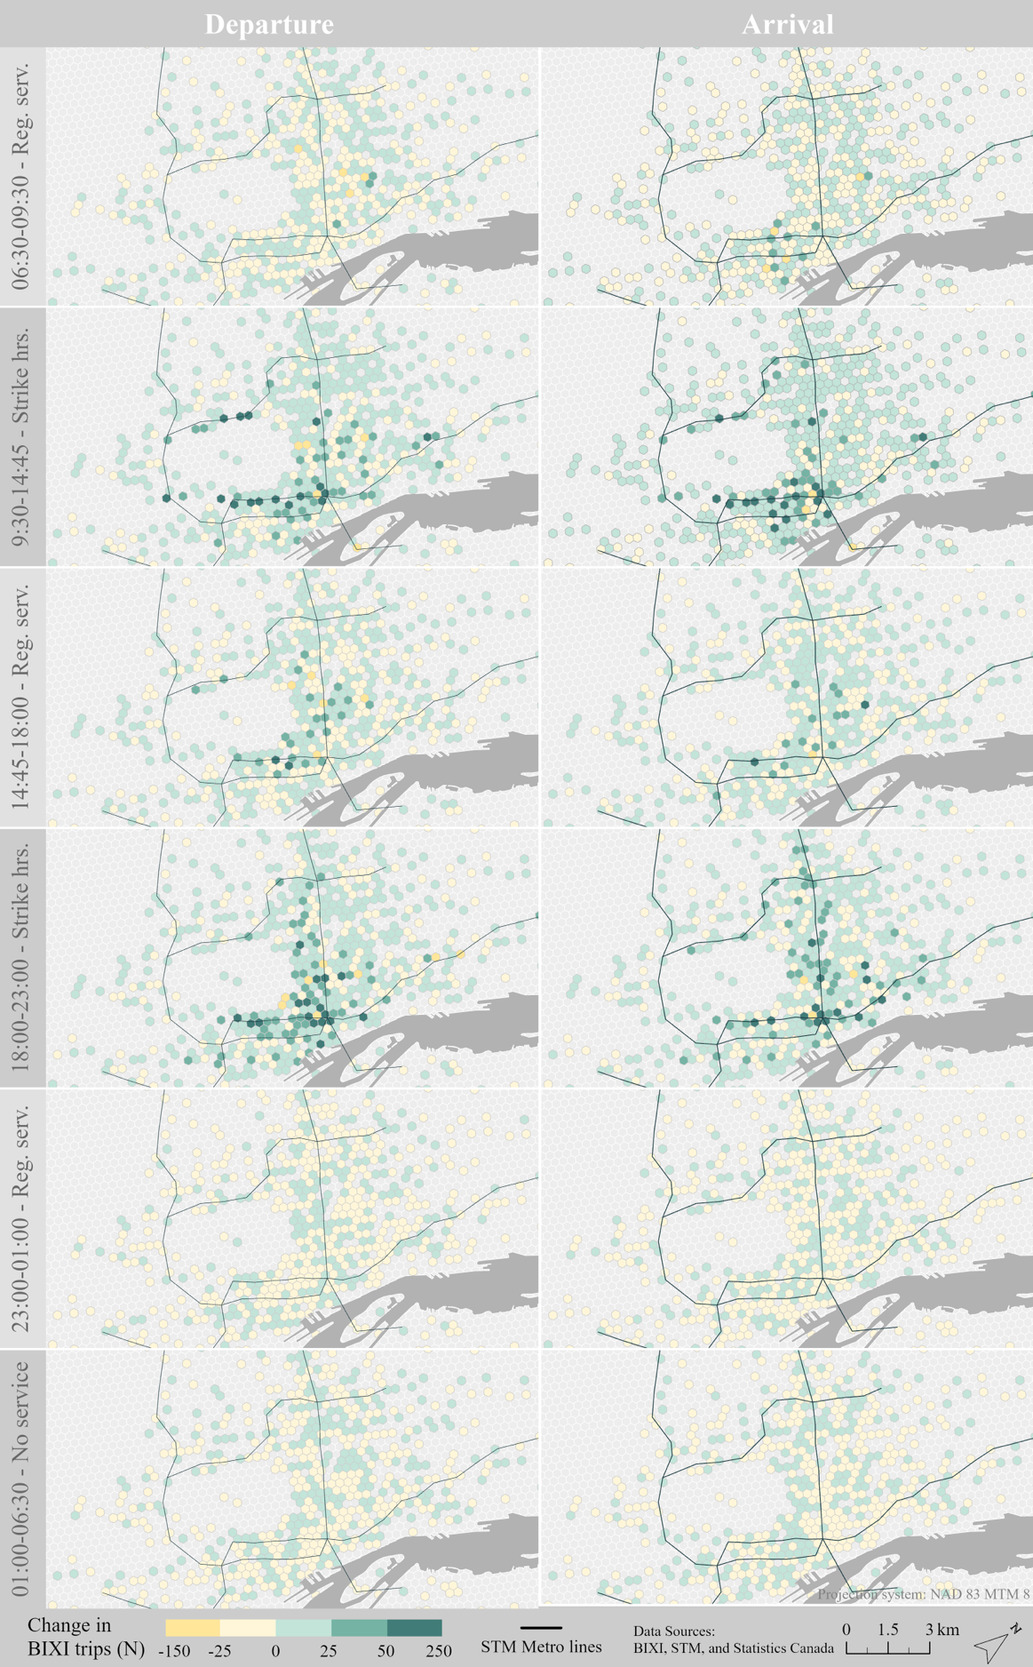
By mapping the difference in trips between a strike day (Monday, 1 Oct 2025) and a non-strike day the following week (8 Oct 2025; Figure 1), we observe a substantial increase in departure and arrival rates on the strike day, particularly near downtown. Stratifying trips by period of day (Figure 2) shows that the largest positive changes occur during the strike’s no-service hours. These patterns are further examined through statistical modelling. Table 1 presents the results of multilevel regression models, with the number of BIXI trips at departure and arrival hexagons as the dependent variables. Our findings indicate a statistically significant positive association between the public transit strike and BIXI usage. After accounting for spatiotemporal factors and the overall ridership increase in 2025, a strike day was associated with 14.6 additional arrival trips per hexagon compared to a regular transit day, corresponding to approximately 13,200 additional trips per strike day, an 18% increase over average weekday ridership in June 2025, with a slightly higher increase in October (~14,250 trips).

Figure 1
Figure 1.Difference in BIXI trips between a strike day (1 Oct 2025) and a non-strike day (8 Oct 2025) for departure and arrival trips
Figure 2
Figure 2.Difference in BIXI trips between a strike day (1 Oct 2025) and a non-strike day (8 Oct 2025) stratified by period of day for departure and arrival trips
Table 1.Multilevel regression models with crossed random effects predicting the number of BIXI trips at the hexagon level
Variables Departure Arrival
Coef CI Coef CI
(Intercept) -30.94 *** -36.48 -⁠ -25.40 -29.53 *** -34.84 -⁠ -24.22
Socioeconomic variables
Median income [10k CAD] 0.13 -0.07 - 0.33 0.15 -0.04 - 0.34
Population density [1k ppl/sqkm] 0.42 *** 0.31 - 0.54 0.34 *** 0.24 - 0.45
Job density [1k jobs/sqkm] 0.03 -0.02 - 0.08 0.08 *** 0.04 - 0.13
Public transit and BIXI variables
Distance to nearest metro station [km] -0.87 *** -1.14 - -0.59 -0.89 *** -1.15 - -0.63
N of bus stops 0.35 ** 0.10 - 0.61 0.30 * 0.05 - 0.55
BIXI station capacity 0.49 *** 0.45 - 0.53 0.47 *** 0.43 - 0.51
Bike Score 0.33 *** 0.27 - 0.38 0.32 *** 0.26 - 0.37
Weather variables
Relative humidity [%] -0.10 *** -0.10 - -0.09 -0.10 *** -0.10 - -0.09
Precipitation [mm] -1.00 *** -1.17 - -0.84 -1.09 *** -1.25 - -0.92
Temperature [C] 0.14 *** 0.12 - 0.16 0.16 *** 0.13 - 0.18
Period of day [Ref: Morning (06:30 – 09:45)]
Midday (09:46-14:44) 8.67 *** 8.45 - 8.89 8.57 *** 8.34 - 8.79
Afternoon (14:45-17:45) 8.46 *** 8.23 - 8.70 8.32 *** 8.08 - 8.55
Evening (17:46-22:59) 15.81 *** 15.60 - 16.01 15.70 *** 15.50 - 15.91
Night (23:00-01:00) -12.29 *** -12.50 - -12.08 -10.95 *** -11.16 - -10.74
Late night (01:01-06:29) -12.24 *** -12.46 - -12.03 -11.49 *** -11.71 - -11.27
Weekend 0.97 *** 0.70 - 1.23 0.95 *** 0.70 - 1.21
Year = 2025 1.27 *** 1.14 - 1.40 1.12 *** 0.99 - 1.26
Interaction with strike hours
Job density x strike hours 0.27 *** 0.26 - 0.29 0.18 *** 0.17 - 0.20
Distance to nearest metro station x strike hours -1.31 *** -1.44 - -1.19 -1.43 *** -1.56 - -1.31
N of bus stops x strike hours 0.28 *** 0.18 - 0.37 0.30 *** 0.20 - 0.39
Interaction with strike days
Morning x strike day (Regular service) 3.01 *** 2.38 - 3.64 3.11 *** 2.47 - 3.75
Midday x strike day (No service) 4.56 *** 3.82 - 5.30 5.44 *** 4.69 - 6.19
Afternoon x strike day (Regular service) 2.25 *** 1.63 - 2.86 2.29 *** 1.66 - 2.92
Evening x strike day (No service) 6.79 *** 6.06 - 7.53 7.60 *** 6.85 - 8.35
Night x strike day (Regular service) -1.59 *** -2.26 - -0.92 -1.66 *** -2.32 - -1.00
Late Night x strike day (No service) -2.27 *** -3.03 - -1.52 -2.16 *** -2.94 - -1.39
September/October Strike Day [Ref: June] 1.09 *** 0.54 - 1.65 1.18 *** 0.61 - 1.74
Random effects
σ2 297.63 310.79
τ00 105.53 Start hexagon 96.75 End hexagon
6.82 Weekday 5.83 Weekday
ICC 0.27 0.25
N - Hexagons 904 903
N - Weekdays 51 51
Observations 381144 389523
Marginal R2 / Conditional R2 0.431 / 0.587 0.424/0.567

* p<0.05 ** p<0.01 *** p<0.001

The surge in usage was most pronounced during the evening no-service hours (17:45–23:00), with an increase of 6.8 departure and 7.8 arrival trips per hexagon compared to a regular day, ceteris paribus. Even during non-strike morning peak hours, departure and arrival rates increase by about three trips per hexagon, possibly reflecting transit users opting for BIXI to avoid anticipated crowding on public transit. Proximity to metro stations and increased bus stops in a hexagon during strike hours were found to have a positive statistically significant effect on BIXI ridership, ceteris paribus, further demonstrating the replacement of transit trips by BIXI ones.

A general increase in BIXI use over time is captured by the year variable, indicating 1.2 additional departing trips and 1.1 arrival trips per day per hexagon in 2025 relative to 2024, holding all other variables at their mean values. In addition to the temporal effects, our findings confirm a statistically significant positive impact of population density, job density, and proximity to metro stations on BIXI ridership, as well as a positive effect of temperature and negative effects of relative humidity and precipitation, which is consistent with previous research (Faghih-Imani et al. 2014). The random-effects structure reveals that spatial and temporal clustering account for a relatively large share of unexplained variance. Together, the hexagon and day-of-week intercepts random effects explain approximately 26–27% of total variance, confirming that systematic location- and temporal-specific factors, not fully captured by the fixed effects, play a role in shaping BIXI usage patterns.

Our results highlight the importance of bicycle sharing systems as viable transport alternative during public transit disruptions. During the Montréal public transit strike the presence of the bicycle sharing system improved the resilience of the transport system to absorb some of the riders. Adapting the bicycle sharing network by increasing the number of drop-off stations and ensuring rapid rebalancing through additional staff and redistribution strategies during the strike enhanced the system’s resilience.


ACKNOWLEDGEMENTS

This research was funded by the Natural Sciences and Engineering Research Council of Canada (NSERC RGPIN-2023-03852), the Tier 1 Canada Research Chair in Public Transport Planning and Operation (CRC-2025-00098), and le Fonds de recherche du Québec–Société et culture (FRQSC).

AI USE

Portions of this work were revised for language clarity by Claude (Anthropic), a large language model. All revised content was thoroughly reviewed and validated by the authors.

Submitted: April 02, 2026 AEST

Accepted: April 30, 2026 AEST

References

Bourquin, C. 2025. “BIXI Bonifie Son Service.” https:/​/​www.lapresse.ca/​actualites/​grand-montreal/​2025-06-08/​greve-a-la-stm/​bixi-bonifie-son-service.php.
Cheng, L., Z. Mi, D. Coffman, J. Meng, D. Liu, and D. Chang. 2022. “The Role of Bike Sharing in Promoting Transport Resilience.” Networks and Spatial Economics 22 (3): 567–85. https:/​/​doi.org/​10.1007/​s11067-021-09518-9.
Google Scholar
Faghih-Imani, A., N. Eluru, A. El-Geneidy, M. Rabbat, and U. Haq. 2014. “How Land-Use and Urban Form Impact Bicycle Flows: Evidence from the Bicycle-Sharing System (BIXI) in Montreal.” Journal of Transport Geography 41: 306–14. https:/​/​doi.org/​10.1016/​j.jtrangeo.2014.01.013.
Google Scholar
Fuller, D., H. Luan, R. Buote, and A. Auchincloss. 2019. “Impact of a Public Transit Strike on Public Bicycle Share Use: An Interrupted Time Series Natural Experiment Study.” Journal of Transport & Health 13: 137–42. https:/​/​doi.org/​10.1016/​j.jth.2019.03.018.
Google Scholar
Saberi, M., M. Ghamami, Y. Gu, M. Shojaei, and E. Fishman. 2018. “Understanding the Impacts of a Public Transit Disruption on Bicycle Sharing Mobility Patterns: A Case of Tube Strike in London.” Journal of Transport Geography 66: 154–66. https:/​/​doi.org/​10.1016/​j.jtrangeo.2017.11.018.
Google Scholar
Société de transport de Montréal. 2025. “STM Maintenance Workers’ Strike: Plan Your Trips Carefully.” Société de Transport de Montréal. https:/​/​stm.info/​en/​press/​press-releases/​2025/​stm-maintenance-workers--strike--plan-your-trips-carefully.

Attachments

Powered by Scholastica, the modern academic journal management system