

1. Questions
As Australian cities undergo growth in population and hence, urbanisation, the challenges to deliver access to services posed by historic planning decisions has become increasingly difficult; from early settlement urban form emphasising sprawling green-field self-sufficiency, Australian urban areas sprawled outward from highly centralised capital cities (in both form and administrative and commercial function) (Wilkinson et al. 2022) following radial public transportation links and preferencing suburban home ownership and low density (Troy 2004). While some policy efforts in the 1990s sought to revitalise urban centres, they met with mixed success, with some increases of inner city population densities, but often resulting in density hot spots clustered around transport links (Coffee et al. 2016). The results are uneven distribution of access to services with considerable inequalities bourne by residents in peri-urban areas (Nice et al. 2024; Stevenson and Nice 2025). Consequences of these spatial inequities can include social inequalities and poverty (Harpham and Boateng 1997), increased health risks (i.e. obesity observed to be 2.3x higher in outer-urban and regional areas (Australian Institute Of Health And Welfare 2018)), and disadvantage in access to services such as education, health or transport (Dikeç 2001).
There has been growing interest recently in the benefits of compact cities (Breheny et al. 1992; Burton 2000; 2002; Daneshpour and Shakibamanesh 2011; Elkin et al. 1991; Newman and Kenworthy 1989), often defined as urban areas with high densities of population and infrastructure that facilitate short journeys to amenities (schools, retail, and workplaces) through mixed land use (Stevenson et al. 2016). Related, are 15- or 20-minute cities, designed so that essential services and amenities are within a 15 minute active transport (cycling or walking) journey from local areas (Bruno et al. 2024).
We aim to test access to essential services across Australian capital cities and create social service indexes (SSPT and SSI). We ask the question, can any Australian city be considered or exhibit characteristics of a compact or 15-minute city? Additionally, what can the spatial distributions of these indexes show about the links between urban form, infrastructure and population density, demographics, and the distribution of spatial advantage/disadvantage across Australian capital cities?
2. Methods
We combine three main datasets that provide locations of primary health services, childcare centres, and proximity and frequencies of public transportation services. For additional context, we link to these demographic data (housing types, population density, socioeconomic status) from the Australian Bureau of Statistics (2021a) 2021 Community Profiles and Socio-Economic Indexes for Areas (SEIFA) (Australian Bureau of Statistics 2021b).
Health providers data was obtained from the National Health Services Directory, maintained by Health Direct Australia[1], and includes providers, service types (i.e. pharmacy, family practice, mental health, etc.), opening hours, billing practices, service address, and latitude/longitude. Childcare facility data was obtained from the Australian Children’s Education & Care Quality Authority (ACECQA) National Register[2] and includes providers, provider street address, number of places, hours of operation, and service quality ratings. Data clean up for both involved geolocating missing latitude/longitude locations from street addresses. The number of public transport services (bus, train, and tram) per week at each latitude/longitude transport stop were calculated using General Transit Feed Specification (GTFS)[3] files for all Australian public transport providers (MobilityData IO 2024). GTFS files are generated by public transport agencies to provide timetables and geographic locations of routes and stops.
The number of services in the primary health and childcare categories and public transport access (frequency and proximity of services) within a flat earth distance of 800m (a distance approximating a 15 to 20-minute walk on the street network) was calculated from 100m grids of points across each of the urban areas. Census and SEIFA data was attached to each point from the Australian Statistical Geography Standard (ASGS)(ABS 2021) SA1 (statistical areas designed to include a population of 200-800 persons) in which the point was located.
Two indexes were created, SSPT and SSI. To generate the SSPT index, counts of access to public transport (proximity and frequency), general practitioners and pharmacies and early childhood education and care within 800 metres were normalised and scaled 0 to 1 and all indicators were summed across each SA1. The SSI index only included the primary health and childcare services.
The resulting indexes could range from 0 (no access to services) to very high accessibility, 3 or 2 for SSPT and SSI respectively. Finally, we aggregate the index results along with demographic characteristics to SA4 levels to show broader trends across the capital cities. SA4s are the largest sub-State statistical regions and are designed to contain at least 100,000 persons and best represent the boundaries of regions that contain both where residents reside and work (ABS 2021).
3. Findings
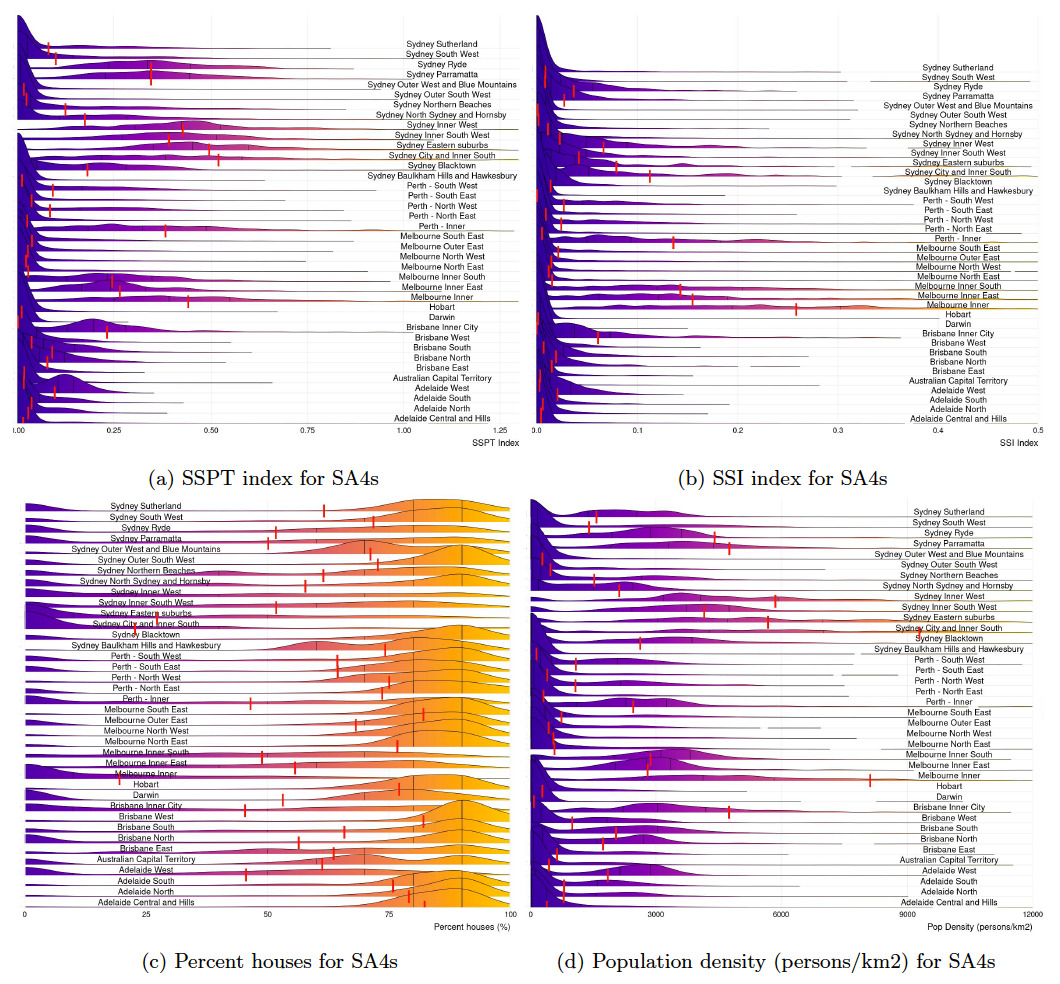
Maps of the estimated SSPT and SSI for six Australian capital cities are shown in Figure 1. Figure 2 shows distributions of these index values across SA4 regions in these cities as well as population density and detached housing type percentages. They highlight the spatial and inequitable distributions of access to essential services such as public transport, primary health care and early childhood education that would be delivered by a compact city.
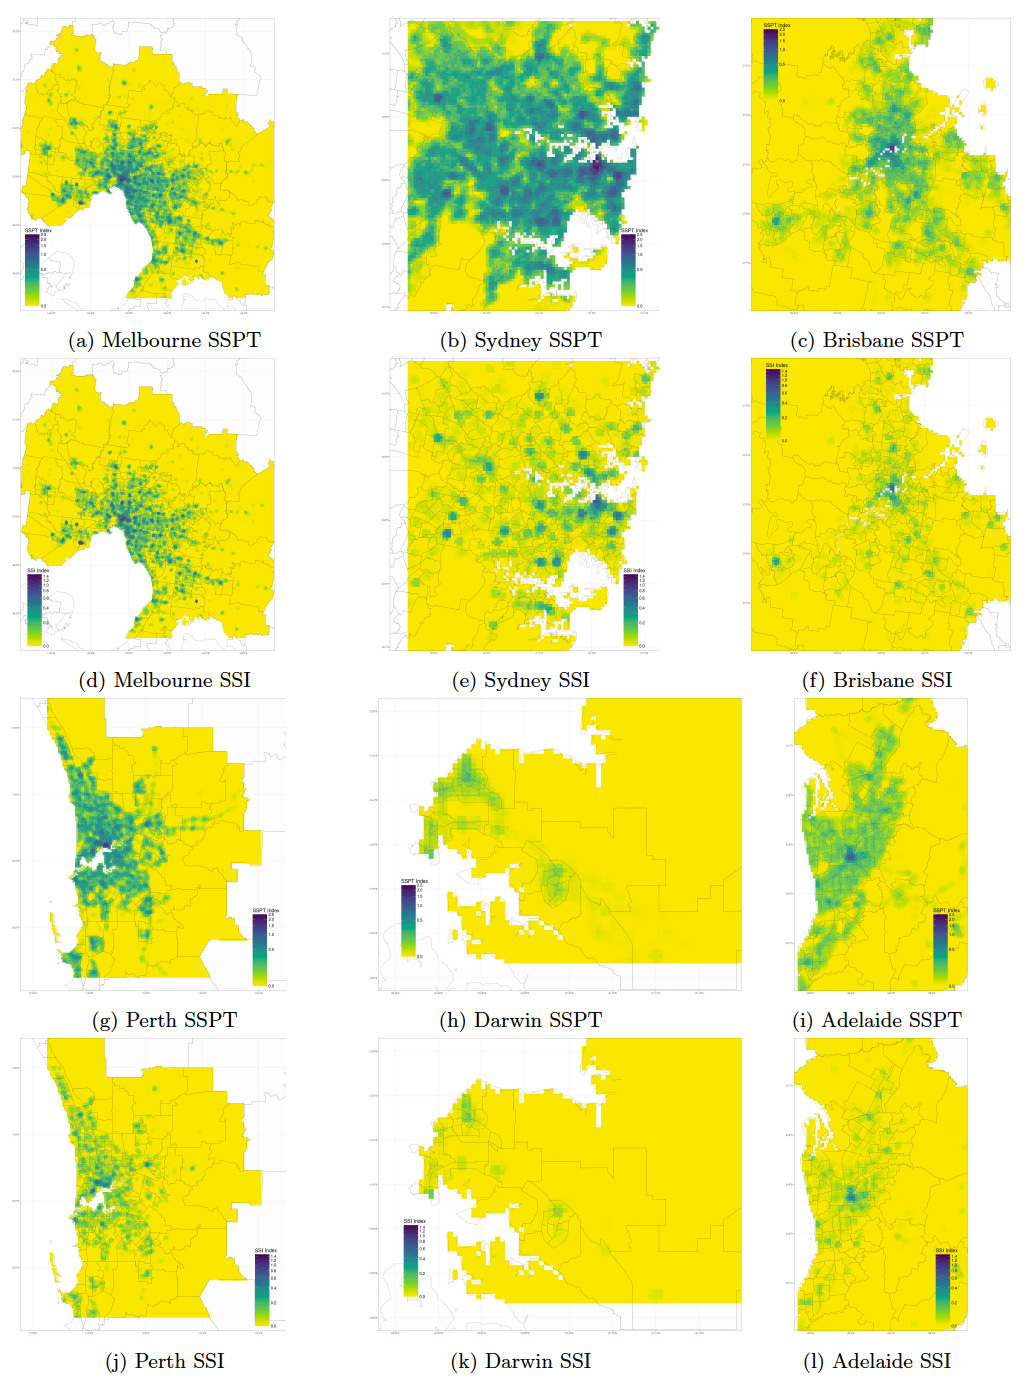
Access to social services and public transport in central urban areas, as measured by the SSPT index, are approximately 0.4-0.5 for Sydney, 0.25-0.4 for Melbourne, 0.25 for Brisbane, 0.15 for Perth and 0.10 Adelaide. In outer metropolitan areas of these cities and in the other cities (Darwin, Canberra, and Hobart), these scores quickly fall to 0.10 and below, indicating limited access to services and public transport. When only considering social services and excluding public transport access for inner-city areas, as measured by the SSI index, are approximately 0.15-0.25 for Melbourne, 0.15 for Perth, 0.10 for Sydney, 0.02 for Adelaide, and 0.01 for Brisbane. Similar to the SSPT index, even lower scores are seen in the outer areas of these cities and in the remaining Australian urban areas.
Sydney, which is very well served by public transport proximity and service frequency, and that performs well in the SSPT index, shows greatly diminished access, as indicated by the SSI index, compared to Melbourne and Adelaide. This is likely due to a more fragmented topography compared to cities that have more contiguous geography. When further examining the individual components of the indexes, we find that access to childcare across the urban areas tends to be at a lower numbers than access to primary health care but more evenly distributed than primary health care services which in turn show higher overall numbers of total services and strong hotspot clustering, especially among transport corridors. This demonstrates that a single combined index can become overly influenced by a single factor and that the choice of factors and weightings should be carefully designed and determined by the intended research question to answer.
_melbourne__b)_sy.jpeg)
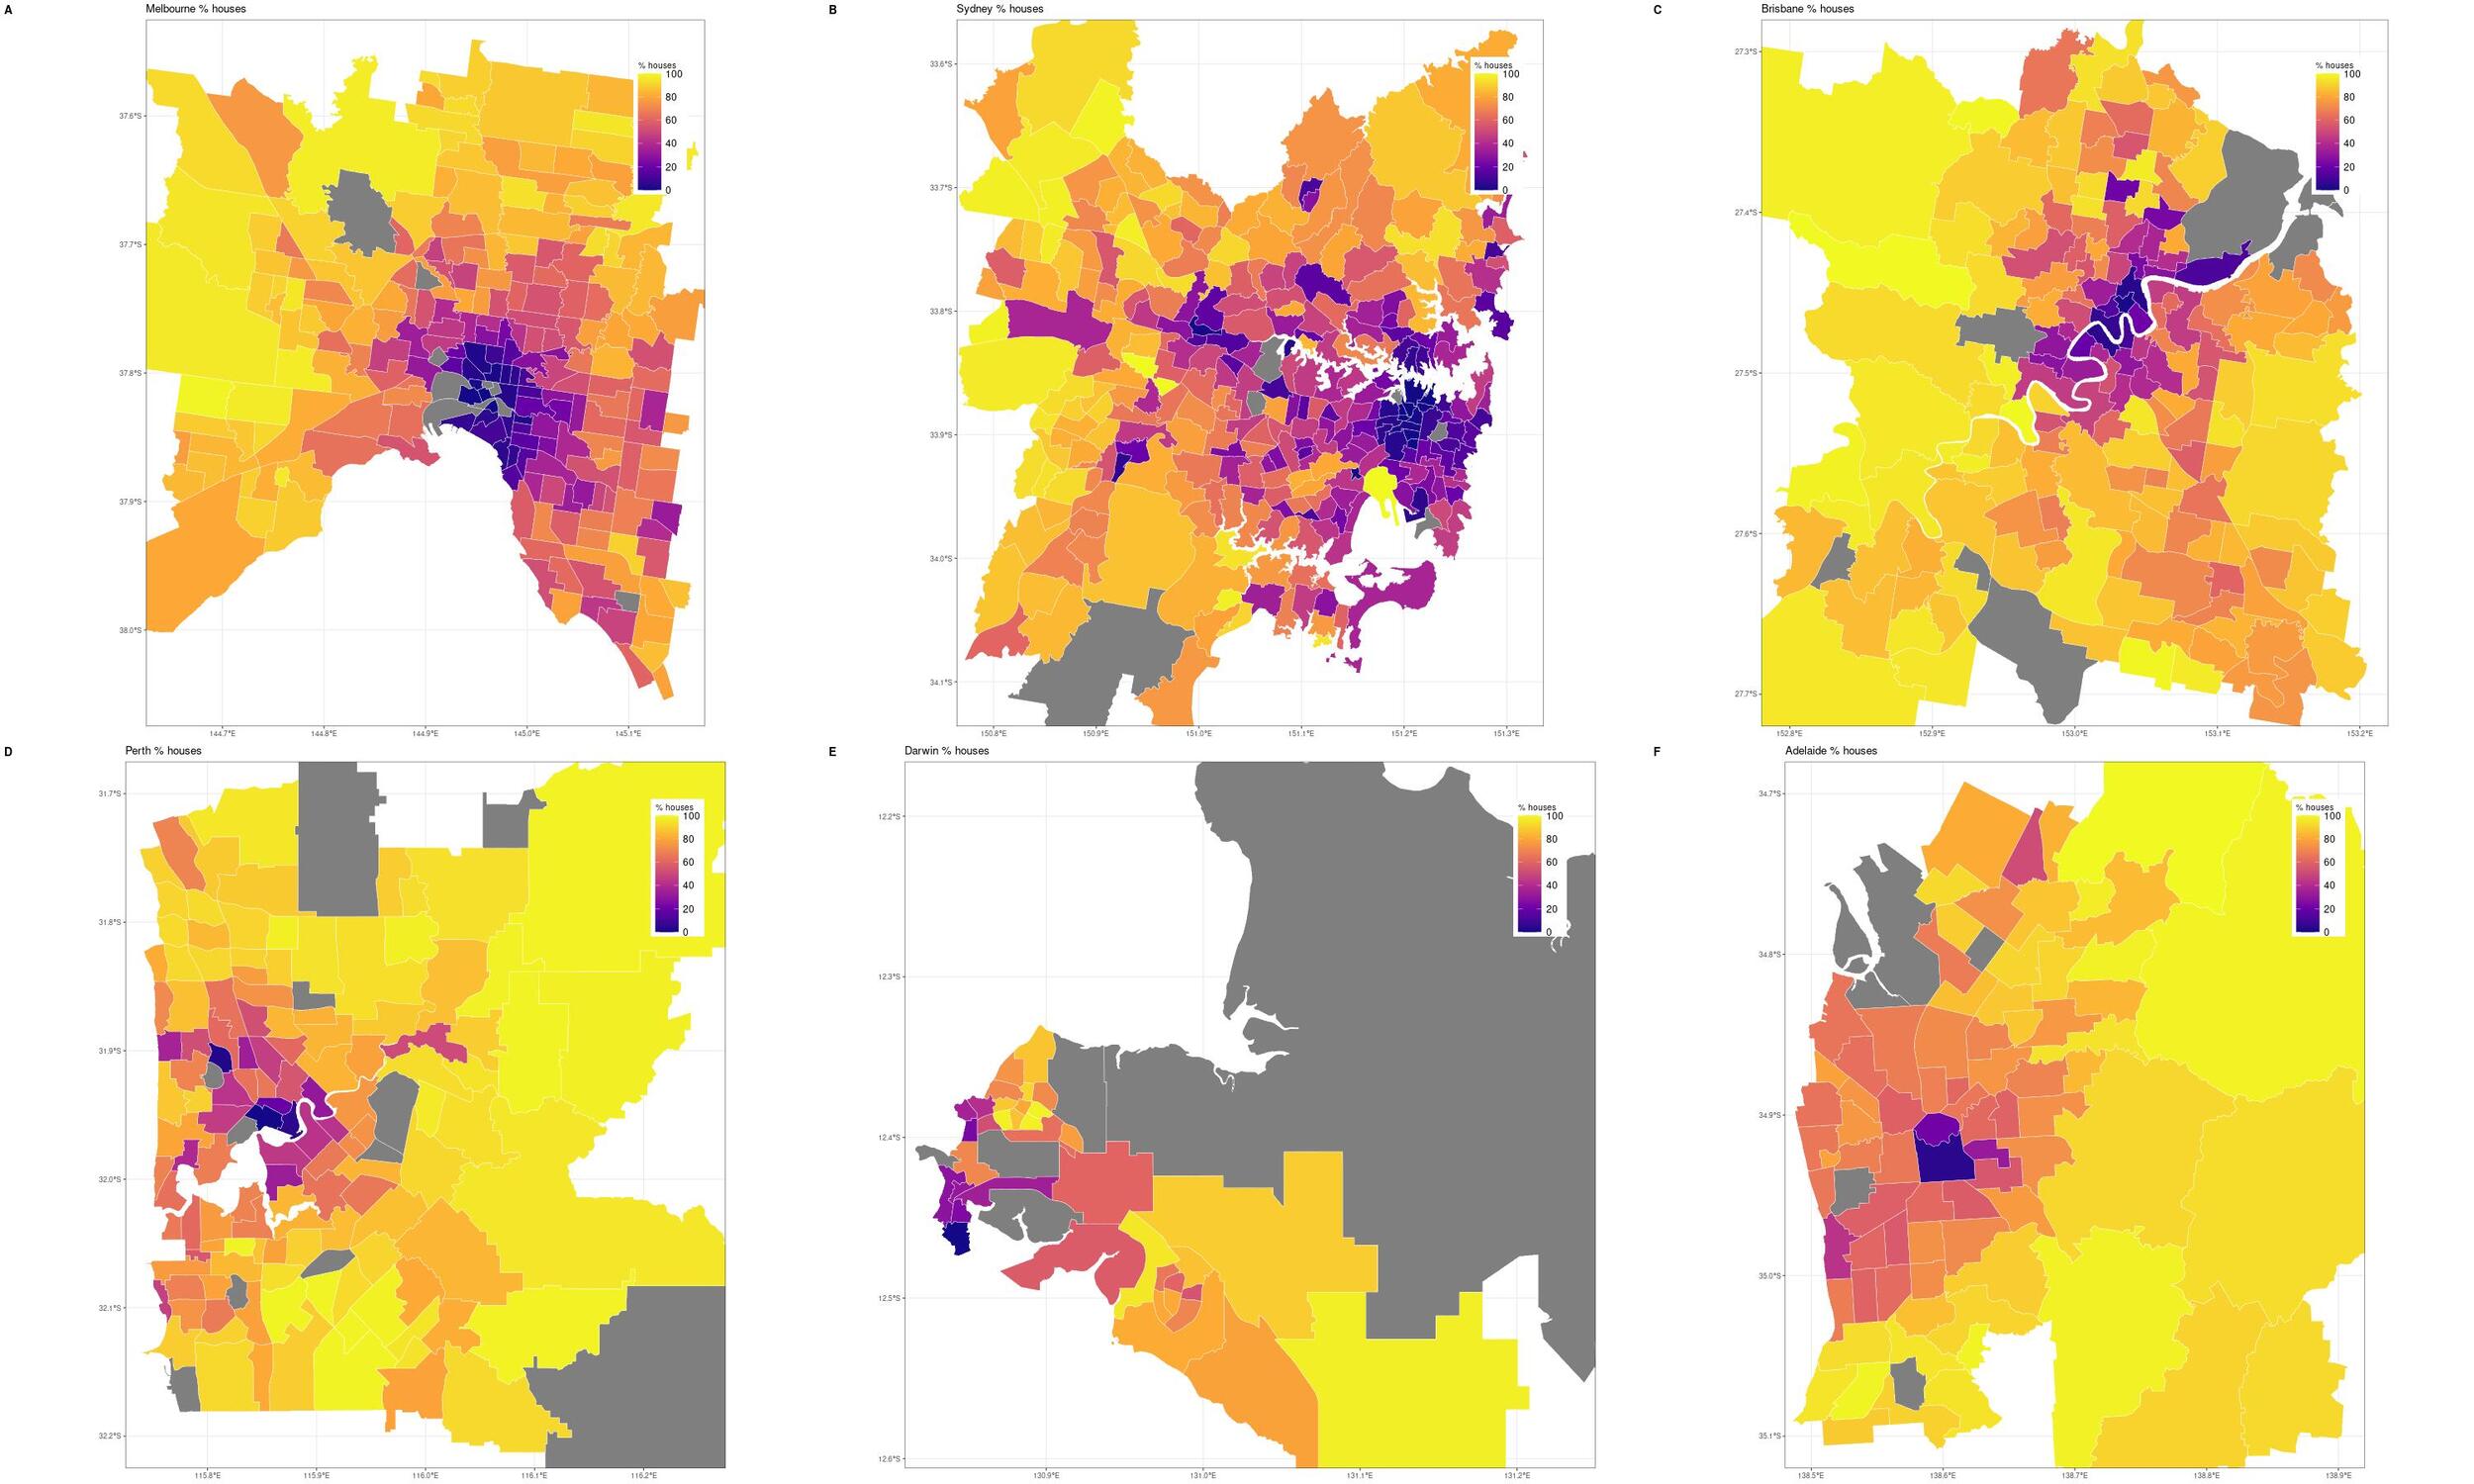
The proportion of property types (Figure 3 and Table 1) in each capital city was used as an additional proxy for urban density, percentages of detached houses compared to apartments. Other than Adelaide, Hobart and Darwin, the CBD area of Australia’s capital cities, comprise approximately 70% of apartments as the main housing stock, reflecting the increased density in the monocentric Australian cities. Although access to services is delivered well in the densely housed and populated city centres, Australia’s continued focus on monocentric planning (Gleeson 2015) delivers poor accessibility to essential services. Access to social services is especially limited particularly in Adelaide, Perth, Brisbane, Hobart, Canberra and Darwin where housing is predominately single detached dwellings.
At a broad level, Table 1 and Figures 1 and 2 shows that urban regions (SA4s) with the highest accessibility are generally those with the greatest population density and the lowest percentage of standalone housing and highest percentage of apartments. These areas generally correspond to the inner city regions. In Melbourne, this consists of a single inner city region, where Sydney has a number of dense (but lower density) inner regions spread across the city. None of the other Australian cities have levels of density and access approaching Melbourne and Sydney.
In answering our questions, we show that two Australian cities (Melbourne and Sydney) have some characteristics of a compact or 15-minute city, generally in the CBD and the inner suburbs where greater housing density is situated. However, even in them, access quickly diminishes in the middle and outer regions. If we intend to start defining what levels of access are considered adequate, as Ryan and Martens (2023) urge is necessary and that is something policy makers are often reluctant to do, even minimal goals such as at least one childcare facility, one pharmacy, and one GP within a 800m distance of all urban residents are currently beyond the reach of most in Australian cities. Overall, access to social services is limited and bereft in the peri-urban areas of Australian cities, areas with lower socioeconomic demographics, thereby exacerbating social inequalities.
These results are in line with Bruno et al. (2024)’s global assessment of 15-minute cities which found that no Australian cities can be considered 15-minute cities. Melbourne and Sydney performed best, with walking trips to services estimated at 17 minutes and 19 minutes respectively. This suggests that access to essential services such as health care and mental health support is suboptimal and this is particularly the case for populations without access to private transport.
While our findings provide a baseline analysis of the range of spatial advantages and disadvantages experienced in accessing some essential services across Australian cities, future research should also expand to include other services such as groceries, community hubs, and employment and explore not only the duration and lengths of journeys to these services but also assess their quality.
Acknowledgements
This research was supported by the Australian Research Council through the Centre of Excellence for Children and Families over the Life Course (Life Course Centre), https://lifecoursecentre.org.au/
Data Availability
Data is available at: https://doi.org/10.5281/zenodo.17587608
Code is available at: https://gitlab.unimelb.edu.au/knice/urbanaccessindex/