This website uses cookies

We use cookies to enhance your experience and support COUNTER Metrics for transparent reporting of readership statistics. Cookie data is not sold to third parties or used for marketing purposes.

Skip to main content
null
Findings
  • Menu
  • Articles
    • Energy Findings
    • Resilience Findings
    • Safety Findings
    • Transport Findings
    • Urban Findings
    • All
  • For Authors
  • Editorial Board
  • About
  • Blog
  • search
  • X (formerly Twitter) (opens in a new tab)
  • LinkedIn (opens in a new tab)
  • RSS feed (opens a modal with a link to feed)

RSS Feed

Enter the URL below into your favorite RSS reader.

https://findingspress.org/feed
ISSN 2652-8800
Transport Findings
May 13, 2026 AEST

Trends in Twin Cities Travel Behavior, 1970–2023

David Levinson, Ph.D.,
transport trendstravel behaviourtravel timeactivity duration
Copyright Logoccby-sa-4.0 • https://doi.org/10.32866/001c.161447
Findings
Levinson, David. 2026. “Trends in Twin Cities Travel Behavior, 1970–2023.” Findings, May 12. https://doi.org/10.32866/001c.161447.
Save article as...▾
Download all (5)
  • Figure 1. Summary of the two main findings. Panel A reports mean minutes per worked diary day for home, travel, and on-site work. Panel B reports mean minutes per Auto-1 commute trip in the common AM and PM peak windows. Panel C reports mean minutes per worked diary day for on-site work, telework, and telework-aware total work.
    Download
  • Figure 2. Worked-that-day series: workplace, work-related, and telework-aware work totals. The line series use the left axis and the square markers use the right axis. Open circles mark published 1990/2000 worker workplace benchmarks from Levinson and Wu (2005). Open squares on the right axis show the published TBOT one-worker-household telecommuters working from home at least once per week in 2000 and 2010 (Levinson et al. 2015); filled squares show recurrent-TBI employed-adult any-telework diary-day shares in 2019–2023. The 2000 total is additive because recovered work-at-home minutes are removed from the 2000 workplace bucket before being added back as telework.
    Download
  • Supplemental Information
    Download
  • SI fig 1
    Download
  • SI fig 2
    Download

Error

Sorry, something went wrong. Please try again.

If this problem reoccurs, please contact Scholastica Support

Error message:

undefined

View more stats

Abstract

Restoring the Twin Cities Travel Behavior Inventory back to 1970 and extending analysis forward to 2023 changes the long-run interpretation of regional travel behavior. The main behavioral change is a relocation of work within the day. For adults who worked on the diary day, home time rises by 194.5 minutes between 1970 and 2023, daily travel falls by 16.1 minutes, and on-site work falls by 196.9 minutes. Once work-related destinations and observed telework are added back in, however, the modern series is better read as a shift in work location than as a collapse in total work: telework-aware total work reaches 500.9 minutes in 2019 and 513.7 minutes in 2023. A second result concerns commute travel times. The main auto commute series generally rise from 1970 through 2019 and then decline in 2021–2023, so the longer record supports a rise-to-2019 and post-COVID reversal story rather than a simple monotonic increase. The archival recovery of the 1970 survey, the handling of 1982, benchmark checks for 1990–2010, and remaining 2019–2023 comparability issues are documented in the Supplemental Information.

1. Questions

The Twin Cities travel surveys have long been used to test whether daily travel time and commute time are stable, rising, or reorganised as the region changes. Earlier studies covered shorter slices of the record: Zahavi and Ryan (1980) examined 1958–1970 through travel time budgets, Levinson and Wu (2005) compared 1990–2000 under the Rational Locator frame (Levinson and Kumar 1994), and Levinson et al. (2015) extended the series to 1990–2010.

Those studies frame two related questions. Travel time budget arguments emphasise the relative stability of daily time spent travelling, while time-allocation perspectives ask how travel competes with work, home, and other activities inside a fixed twenty-four-hour day. The Rational Locator argument shifted the commute question away from a universal travel-time law and toward the joint geography of homes, jobs, and opportunities. Extending the Twin Cities record back to 1970 and forward to 2023 makes it possible to revisit these questions over a longer period, including the post-2019 work-at-home shift.

Recovering the 1970 Travel Behavior Inventory (TBI) and extending the series to 2023 makes two substantive questions visible. First, how did daily time allocation vary across home, travel, on-site work, work-related activity, and telework? Second, did peak commute times rise steadily, or did the apparent rise reverse after the work-at-home shock of 2019–2023? A third contribution is methodological: the Supplemental Information documents how the 1970 survey was recovered and how far the legacy benchmark tables can be reproduced. The recovery of 1970 is an archival contribution that allows it to serve as a peer data source to later household travel surveys.

2. Methods

The analysis builds a harmonised adult diary-day series from the Twin Cities Travel Behavior Inventory, combining recovered historical waves with the recurrent 2019–2023 surveys. All trend estimates use a fixed seven-county geography and adults ages 18–65. For 1970–2010, person-days are reconstructed from linked trips; for 2019–2023, the recurrent day files provide the complete-day denominator and linked trips provide the activity timing, which retains zero-trip complete days in the modern waves. Survey administration changed substantially across the record. The 1970 TBI was a household home-interview survey: sampled households were assigned a 24-hour travel day, interviewers collected trips for household members age 5 and older, and the completed forms were coded and keypunched for machine processing (Mid-Continent Surveys, Inc. 1970a, 1970b). The 1982–2010 waves remain household travel-diary/interview waves in the legacy TBI lineage. The 2019–2023 recurrent TBI used address-based mail recruitment supplemented by targeted outreach, with diaries collected through the rMove smartphone app, web diaries, or a call center; smartphone households could provide multi-day diaries, while web/call-center households generally provided one-day diaries (RSG, Inc. 2024). These methodological changes are one reason the Supplemental Information keeps denominator, weighting, and modern-wave sensitivity checks explicit.

Table 1 classifies each adult diary day into three groups: worked that day, employed but did not work that day, and not employed, and reports combined on-site work. “Worked that day” includes any observed out-of-home workplace stay, out-of-home work-related stay, or separately observed telework/work-at-home on the diary day. Panels B and C should be read as diary-day status groups rather than as a causal decomposition of employment status. The available harmonized fields do not consistently separate full-time from part-time work, nor do they identify all reasons for non-employment, such as homemaking, schooling, unemployment, or early retirement, across every wave. The lower 1982 travel values for the nonworking panels should also be read cautiously because 1982 does not preserve a separate shopping bucket. The table therefore shows the descriptive diary-day allocation, while the interpretation is kept at the level supported by all waves.

Table 1.Diary-day work-status groups: harmonized daily time allocation, mean minutes per person-day, fixed 7-county, 1970–2023
Panel A. Worked that day
Year n Home On-site work Shop Other Travel Note
(min/day) (min/day) (min/day) (min/day) (min/day)
1970 5523 908.2 419.6 14.1 27.6 70.5 –
1982 3014 809.4 427.4 0.0 119.5 83.7 –
1990 3774 798.7 485.2 10.8 61.3 84.0 –
1990 printed 796.5 475.5 82.5 L&W 2005
2000 4760 795.9 476.9 11.5 62.4 89.5 –
2000 printed 789.5 485.0 87.0 L&W 2005
2010 7910 866.5 427.6 9.0 53.4 83.5 –
2019 10583 895.4 390.4 12.0 51.5 90.7 –
2021 7537 1065.5 266.1 12.1 38.2 58.1 –
2023 2956 1102.7 222.7 13.2 47.0 54.4 –
Panel B. Employed but did not work that day
Year n Home On-site work Shop Other Travel Note
(min/day) (min/day) (min/day) (min/day) (min/day)
1970 408 1223.8 0.0 39.3 105.6 71.2 –
1982 562 1223.4 0.0 0.0 185.2 31.4 –
1990 279 1158.3 0.0 37.1 167.2 77.4 –
2000 1295 1218.1 0.0 23.5 140.9 57.5 –
2010 1186 1282.3 0.0 20.0 89.0 48.7 –
2019 1405 1239.7 0.0 27.2 114.5 58.5 –
2021 1315 1302.3 0.0 26.4 68.4 42.9 –
2023 445 1307.0 0.0 17.7 77.0 38.3 –
Panel C. Not employed
Year n Home On-site work Shop Other Travel Note
(min/day) (min/day) (min/day) (min/day) (min/day)
1970 678 1236.4 0.0 37.9 106.6 59.1 –
1982 1067 1284.2 0.0 0.0 134.0 21.8 –
1990 472 1177.2 0.0 43.0 145.1 74.6 –
2000 1054 1227.2 0.0 29.6 123.3 59.9 –
2010 2012 1276.7 0.0 10.7 113.3 39.3 –
2019 1931 1284.8 0.0 33.6 73.3 48.3 –
2021 2135 1327.0 0.0 21.6 54.0 37.4 –
2023 941 1349.5 0.0 11.9 51.4 27.3 –

Rows use the fixed 7 -county geography, adults ages 18-65, and diary-day work-status groups. ‘Worked that day’ means any observed workplace time, work-related time, or separately observed telework/work-at-home on the diary day. ‘Employed but did not work that day’ means currently employed adults without observed work on that diary day. “Not employed” means adults classified as nonworkers. ‘n’ is the unweighted person-day sample count. Across all years, person-days with any trip duration greater than 120 minutes are excluded from the harmonized activity tables, consistent with the extreme-duration screen used in the earlier TBOT replication work. ‘On-site work’ combines primary workplace and work-related minutes; the decomposition is reported in Table 3 and Figure 2. In 1982, the surviving purpose field does not preserve a separate shopping bucket, so ‘Shop’ is absorbed into ‘Other’, and the combined 1982 on-site work total is more reliable than the internal split. Legacy zero-trip person-days are retained as all-home days where the person tables survive (1982, 2000, and 2010), but the surviving 1970 and 1990 archives do not preserve an equivalent zero-trip denominator. In Panel A, the italicized rows beneath 1990 and 2000 align the printed ‘H/W/T’ values from Levinson and Wu (2005).

Table 3 shows that the 2019 worked-that-day workplace level still reflects a modern purpose-classification shift, not only a behavioral break.

Peak-travel estimates in Table 2 are worker-only trip means for direct home-to-work and work-to-home commute trips by mode. To standardize the directional comparison as much as possible, all years use the same fixed departure windows: 06:00–08:59 for the AM home-to-work direction and 15:00–18:29 for the PM work-to-home direction. Transit combines bus, light rail, and commuter rail where present. The table reports mean minutes and unweighted trip counts in separate columns. Published benchmarks are reported where available. Very sparse directional cells are suppressed in the main-text table.

Table 2.Workers only: directional peak commute travel times by mode, mean minutes per commute trip under common fixed windows, fixed 7-county, 1970–2023
Panel A. AM peak: Home to work
Year Mean (Auto-1) n Mean (Auto-2) n Mean (Auto-3) n Mean (Transit) n Note
1958 printed Car-only 19.8 30.0 Z&R 1980
1970 20.6 2199 19.4 481 30.9 232 Supp. 3 –
1970 printed Car-only 17.4 32.4 Z&R 1980
1982 21.6 1142 20.2 170 29.5 90 Supp. 2 –
1990 21.5 1895 26.9 71 21.2 133 27.5 104 –
1990 printed 22.6 23.1 24.2 32.9 L&W 2005
2000 25.6 2267 22.6 134 24.0 25 37.4 98 –
2000 printed 27.2 24.6 23.8 42.0 L&W 2005
2010 25.7 3145 27.0 79 24.0 141 32.4 118 –
2019 27.0 2807 24.2 205 27.4 41 42.5 360 –
2021 22.8 1458 20.3 84 Supp. 13 Supp. 24 –
2023 21.4 523 Supp. 24 Supp. 8 38.2 61 –
Panel B. PM peak: Work to home
Year Mean (Auto-1) n Mean (Auto-2) n Mean (Auto-3) n Mean (Transit) n Note
1958 printed Car-only 19.8 30.0 Z&R 1980
1970 22.4 2011 20.5 434 36.8 255 Supp. 3 –
1970 printed Car-only 17.4 32.4 Z&R 1980
1982 21.7 700 22.3 136 31.7 74 – – –
1990 23.5 1369 30.9 56 22.8 101 32.9 84 –
1990 printed 22.6 23.1 24.2 32.9 L&W 2005
2000 29.0 1728 27.1 98 27.6 21 46.4 91 –
2000 printed 27.2 24.6 23.8 42.0 L&W 2005
2010 28.9 2304 35.1 41 29.7 108 43.1 135 –
2019 30.2 2159 24.4 155 19.7 26 47.2 291 –
2021 25.7 1102 24.6 56 Supp. 16 Supp. 33 –
2023 24.9 613 18.0 43 Supp. 11 48.5 64 –

All years use the same departure windows: AM 06:00–08:59 and PM 15:00–18:29. Rows are worker-only direct home-to-work and work-to-home trip means by mode; ‘min’ is the weighted mean trip duration and ‘n’ is the unweighted trip count. The same all-year extreme-duration screen used in the activity tables excludes worker person-days with any trip duration greater than 120 minutes. Transit combines bus, light rail (from 2010), and commuter rail (from 2010) where present. Cells marked ‘Supp.’ are suppressed because they fail the paper-facing stability screen of effective sample size below 10 or relative standard error above 25%. The italicized rows report published comparison values. For 1990 and 2000, Levinson and Wu (2005) provides non-directional work-trip means for Auto-1, Auto-2, Auto-3, and Transit; those values are repeated in both panels as comparison anchors rather than directional AM/PM cells. For 1958 and 1970, Zahavi and Ryan (1980) reports all-purpose ‘car-only’ and ‘transit-only’ average trip times rather than occupancy-specific work-trip means, so those contextual values are shown as ‘Car-only’ across the auto columns and as Transit in the transit column.

The Supplemental Information documents the archival recovery, validation checks, and remaining wave-specific compromises in full.

3. Findings

In Table 1 Panel A, time at home rises from 908.2 minutes in 1970 to 1102.7 in 2023, an increase of 194.5 minutes per day. Over the same period, travel falls from 70.5 to 54.4 minutes, while combined on-site work falls from 419.6 to 222.7 minutes, a decline of 196.9 minutes. Relative to 2019, worked-that-day home time rises by 207.3 minutes by 2023, travel falls by 36.3 minutes, and on-site work falls by 167.7 minutes.

Panels B and C show employed adults who did not work on the diary day are distinct. In 2019, travel averages 58.5 minutes for employed adults who did not work that day and 48.3 minutes for adults who were not employed.

The 2019 worked-that-day workplace level still reflects a modern purpose-classification shift, not only a behavioral break. In the harmonized worked-that-day comparison, workplace minutes fall from 416.2 in 2010 to 290.8 in 2019, but work-related minutes rise from 11.4 to 99.6. The modern public files explicitly separate primary workplace from work-related destinations such as meetings, deliveries, and worksites, so part of the apparent 2010-to-2019 drop reflects category reallocation within work activity rather than a clean apples-to-apples fall in time at work. The combined on-site measure therefore falls from 427.6 in 2010 to 390.4 in 2019, which is materially smaller than the workplace line alone suggests.

It should be noted that even though the 7-county geography is retained for analysis, typical workers in 2023 lived much farther from the Minneapolis or St. Paul central business districts than their 1970 counterpart as the metro area increased population from about 1.7M to 3.0M for this geography over the period, and outer counties suburbanized, and many more commuters live outside these 7 counties.

The longer record still does not support a clean monotonic-rise story for commute travel times, and the directional split makes that clearer. Table 2 reports worker-only trip means for direct AM home-to-work and PM work-to-home commute trips by mode under one common AM/PM window for every year, with sample sizes shown. For drive-alone travelers (Auto 1), the AM series rises from 20.6 minutes in 1970 to 25.6 in 2000, rises again to 27.0 in 2019, and then falls back to 21.4 in 2023 as congestion dissipates with the rise in work-at-home, and more scheduling flexibility in general. The PM Auto 1 return-commute series is even clearer, moving from 22.4 in 1970 to 29.0 in 2000, staying near 28.9 in 2010, rising to 30.2 in 2019, and then falling to 24.9 in 2023. Carpool with one passenger (Auto 2) shows the same broad pattern.

The post-2019 (i.e. post-COVID) decline is consistent with lower peak congestion, more schedule flexibility, and the removal of some commute trips through work-at-home, but this table cannot observe the counterfactual commute lengths of workers who stayed home.

The post-2019 phase shift is easier to interpret by disaggregating primary workplace, work-related, and telework. Figure 2 and Table 3 show that workplace minutes fall from 416.2 in 2010 to 290.8 in 2019, but work-related minutes rise from 11.4 to 99.6 over the same interval. The 2019 break is therefore not only behavioral; it also reflects a reallocation within the modern purpose taxonomy. The combined on-site measure of workplace plus work-related falls from 427.6 in 2010 to 390.4 in 2019, which is a much smaller drop than the workplace line alone suggests.

Figure 1
Figure 1.Summary of the two main findings. Panel A reports mean minutes per worked diary day for home, travel, and on-site work. Panel B reports mean minutes per Auto-1 commute trip in the common AM and PM peak windows. Panel C reports mean minutes per worked diary day for on-site work, telework, and telework-aware total work.
Figure 2
Figure 2.Worked-that-day series: workplace, work-related, and telework-aware work totals. The line series use the left axis and the square markers use the right axis. Open circles mark published 1990/2000 worker workplace benchmarks from Levinson and Wu (2005). Open squares on the right axis show the published TBOT one-worker-household telecommuters working from home at least once per week in 2000 and 2010 (Levinson et al. 2015); filled squares show recurrent-TBI employed-adult any-telework diary-day shares in 2019–2023. The 2000 total is additive because recovered work-at-home minutes are removed from the 2000 workplace bucket before being added back as telework.
Table 3.Worked-that-day series: workplace, work-related, and telework-aware work totals, mean minutes per worked diary day, fixed 7-county, 1970–2023
Year Primary workplace Work-related On-site work Telework / WAH Total work
(min/day) (min/day) (min/day) (min/day) (min/day)
1970 397.5 22.1 419.6 – 419.6
1982 282.5 144.9 427.4 – 427.4
1990 455.8 29.4 485.2 – 485.2
2000 442.2 34.6 476.9 3.9 480.7
2010 416.2 11.4 427.6 – 427.6
2019 290.8 99.6 390.4 110.5 500.9
2021 224.7 41.4 266.1 258.3 524.4
2023 158.9 63.8 222.7 291.1 513.7

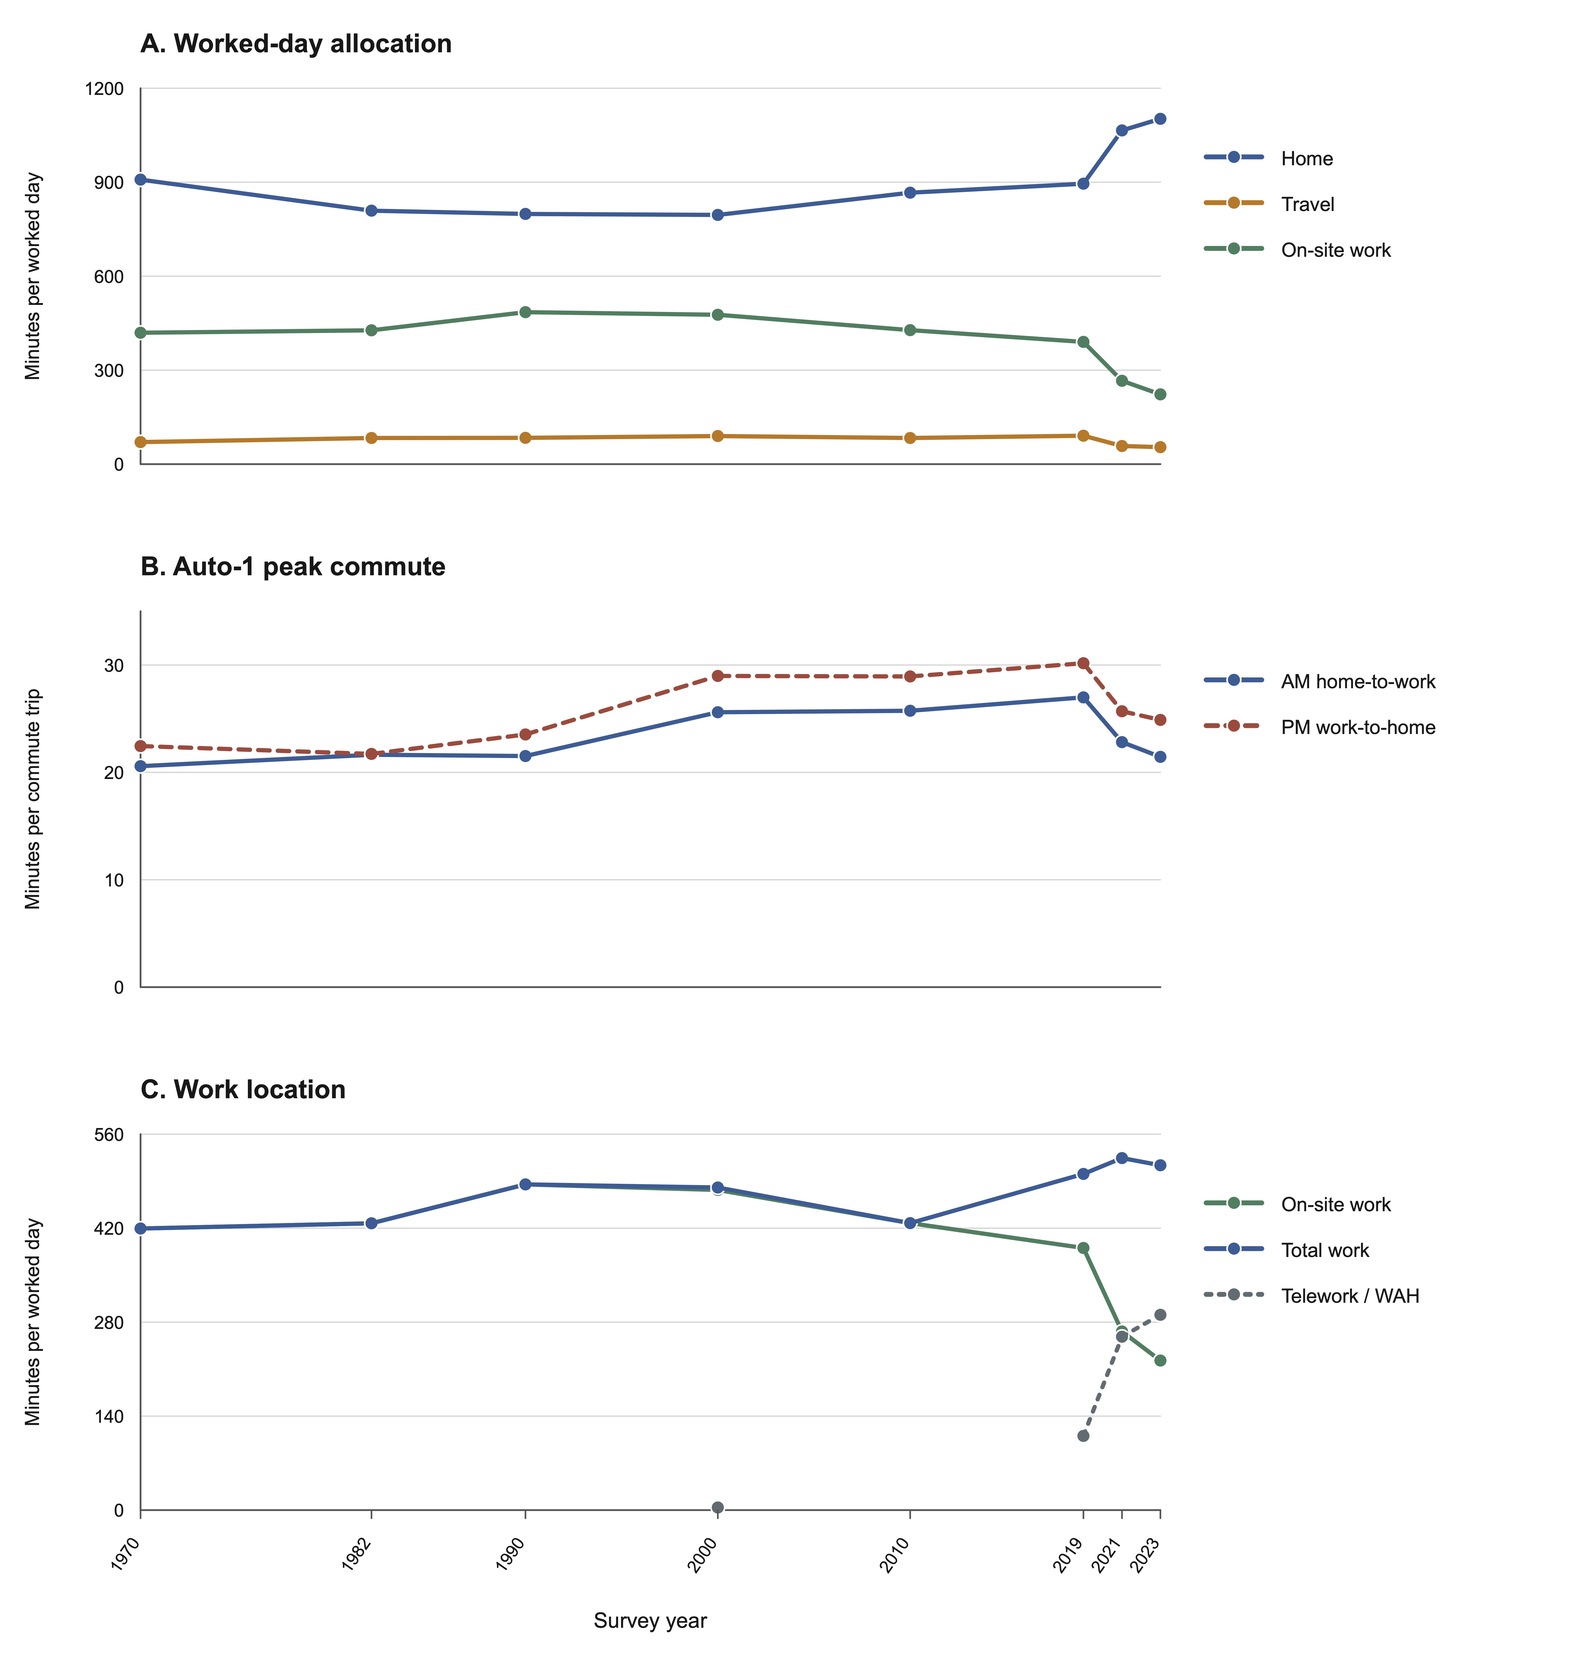
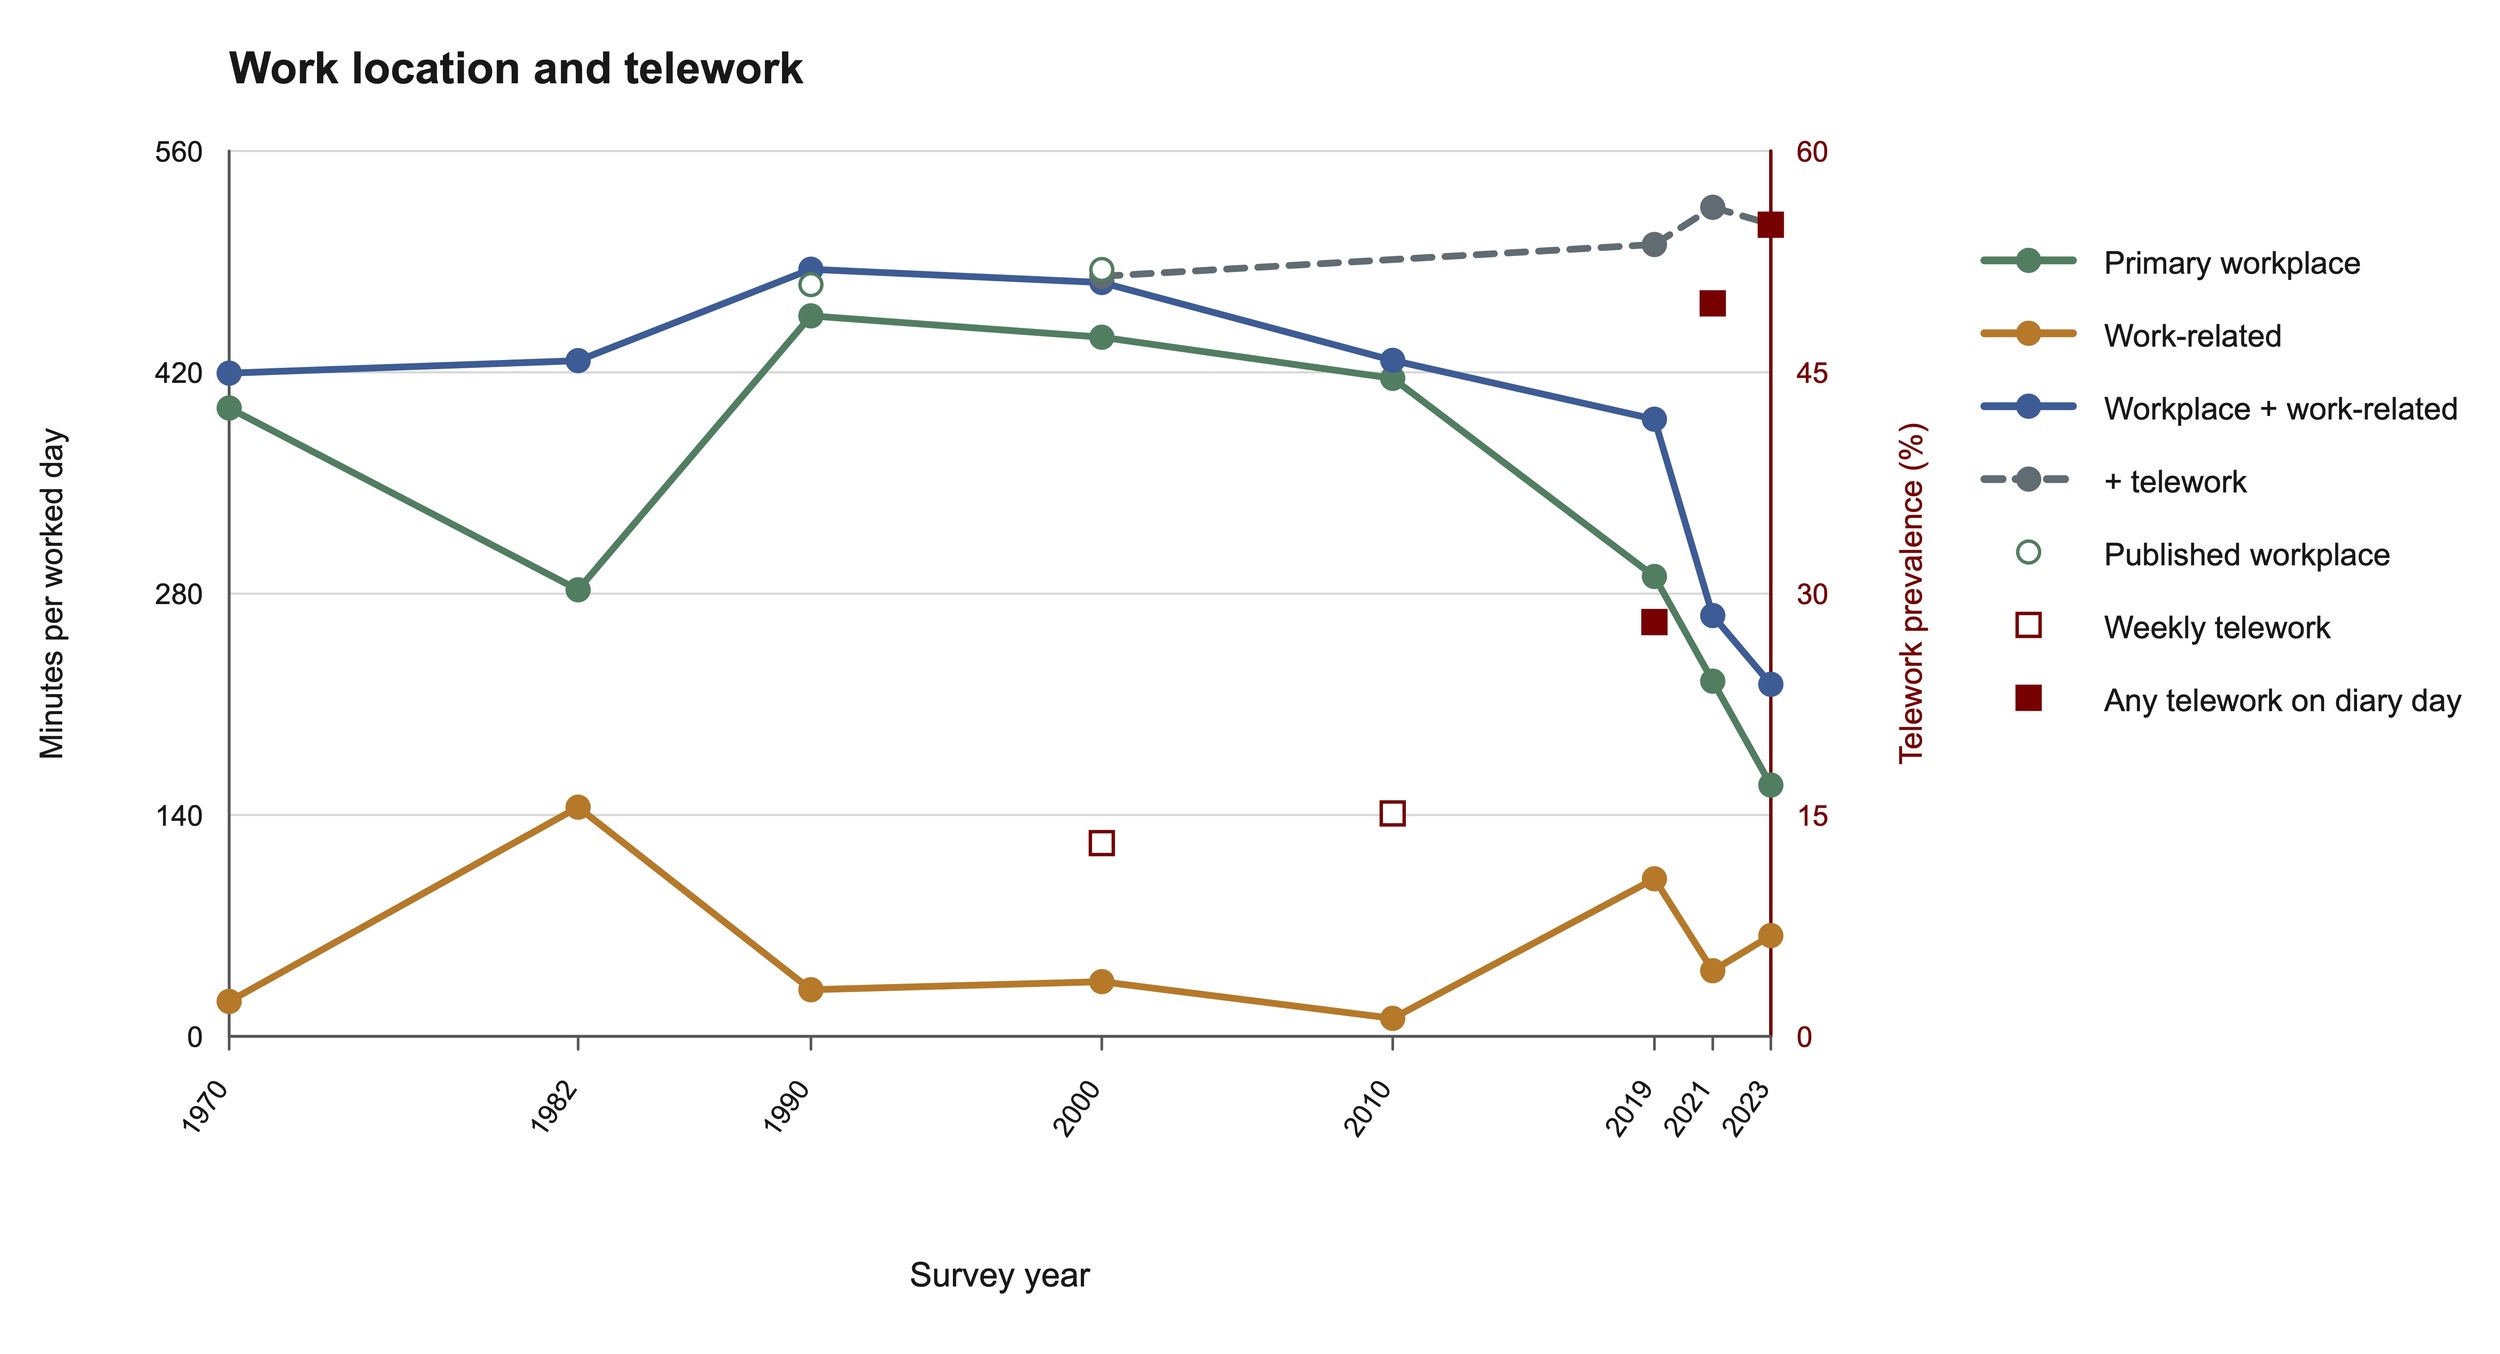
When telework is added back in, 2019 no longer looks low relative to the earlier benchmark years. Telework averages 110.5 minutes in 2019, so the telework-aware total reaches 500.9 minutes, above the 2000 value of 480.7 and well above the Global Financial Crisis-affected 2010 on-site total of 427.6. By 2021 and 2023, total work reaches 524.4 and 513.7 minutes respectively.

Published telecommuting frequencies point in the same direction before the recurrent waves. In one-worker households, telecommuters working from home at least once per week rise from 13.1% in 2000 to 15.1% in 2010 (Levinson et al. 2015). The recurrent TBI then shows employed-adult diary-day telework shares of 28.1% in 2019, 49.7% in 2021, and 55.0% in 2023. The main modern change is therefore where work happens. Travel-derived workplace presence falls sharply, but much of that decline reflects substitution toward telework rather than less total work. That interpretation is also consistent with the recurrent TBI public report, which separately tracks telework, teleconferencing, and no-travel work-at-home behavior (RSG, Inc. 2024).


Data Availability

The archival recovery steps, reconstructed series, benchmark comparisons, and wave-specific caveats are documented in the Supplemental Information. Data and code supporting the paper are available in the public GitHub repository at: https://github.com/dlevinson/TBOT (https://dx.doi.org/10.5281/zenodo.19842361).

AI Acknowledgment

The author used OpenAI ChatGPT/Codex as an editorial and computational assistant during writing and revision, for figure styling, replication-package organization, and drafting support. The author reviewed, verified, and takes full responsibility for all analyses, interpretations, text, figures, and submitted materials. The 1970 data recovery also made extensive use of ChatGPT as described in the Supplemental Information.

Submitted: March 23, 2026 AEST

Accepted: April 29, 2026 AEST

References

Levinson, David, and Ajay Kumar. 1994. “The Rational Locator: Why Travel Times Have Remained Stable.” Journal of the American Planning Association 60 (3): 319–32. https:/​/​doi.org/​10.1080/​01944369408975590.
Google Scholar
Levinson, David, Greg Lindsey, Yingling Fan, et al. 2015. Travel Behavior over Time. MN/RC 2015-23. Minnesota Department of Transportation.
Levinson, David, and Yao Wu. 2005. “The Rational Locator Reexamined: Are Travel Times Still Stable?” Transportation 32 (2): 187–202. https:/​/​doi.org/​10.1007/​s11116-004-5507-4.
Google Scholar
RSG, Inc. 2024. Travel Behavior Inventory 2018–2024 Summary Report. Metropolitan Council.
Zahavi, Yacov, and James M. Ryan. 1980. “Stability of Travel Components over Time.” Transportation Research Record 750: 19–26.
Google Scholar

Attachments

Powered by Scholastica, the modern academic journal management system