


1. Question
Transport investment continues to be a subject of debate in North America. In Canada, for example, bike lanes and tramway projects have become the subject of contentious debates at both the provincial and city-levels in recent elections. The current mayor of New York City promised to eliminate bus fares as part of his successful campaign. These North American cases show transportation issues are often contested electorally. However, election results on their own do not always provide a clear understanding of what local populations want improved about their transportation systems. This research answers two questions to address this: how does public support vary by mode of transportation, and does public support vary when modes are considered in general terms versus in relation to safety, space, cost, equity, or infrastructure?
2. Methods
Survey
This study uses data collected in May 2024 through an online survey distributed across the Montréal Metropolitan Area using a well-known Canadian research firm’s online panel (Léger Opinion). Individuals aged 18 years or older were recruited using quotas to ensure representation across subregions by age and gender. Data quality was ensured by using embedded attention check questions designed to identify negligent responses. 1650 respondents completed the survey and a sample of 1606 respondents was retained after an extensive data cleaning process detailed in Kinman et al. (2025).
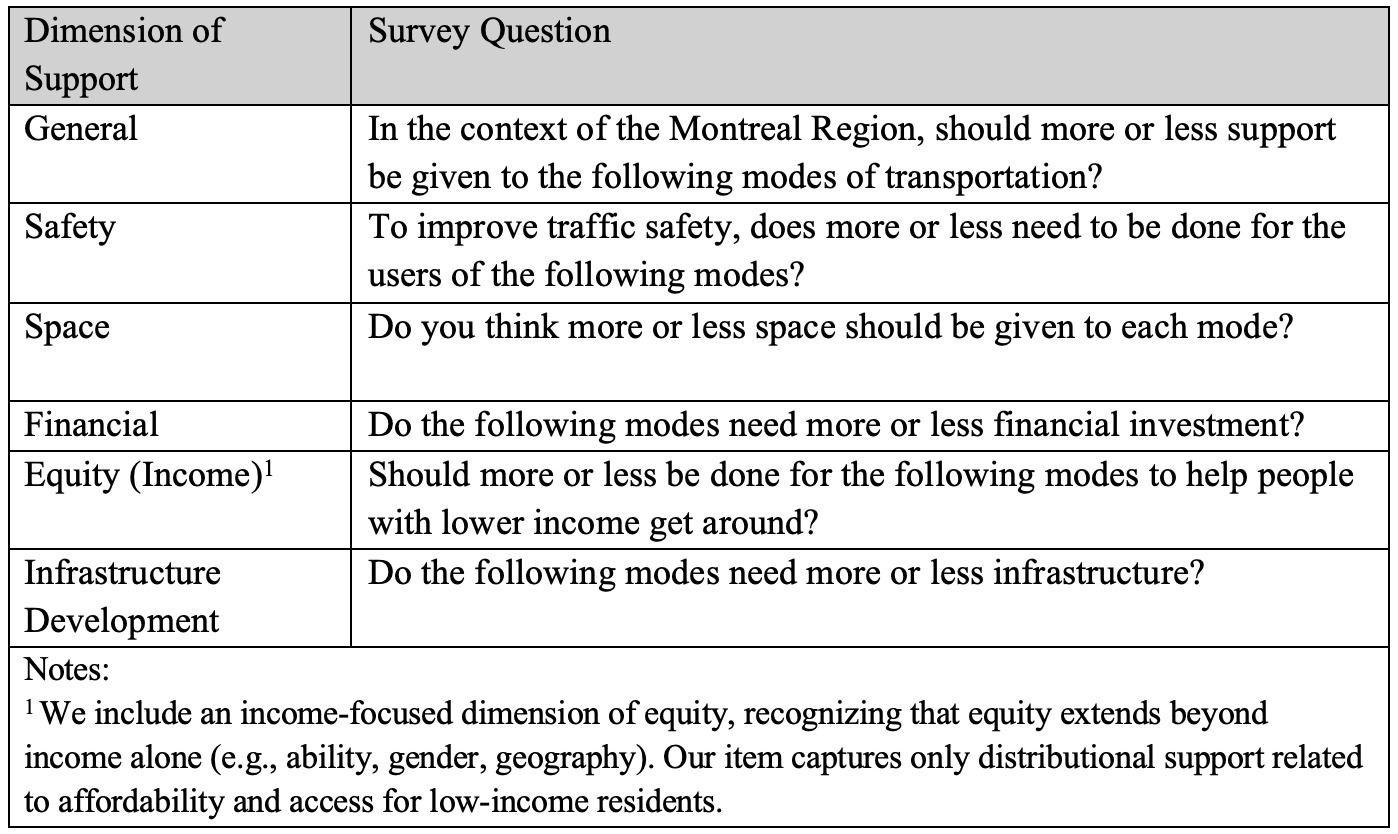
Respondents were asked to answer the 6 questions presented in Table 1. Each question was on a different page, and respondents used a slider scale from -100 (Much less) to 100 (Much more), with 0 being Unchanged for each of the following modes of transportation: Bus, Walking, Rail (metro, train, tram, etc.), Bicycle, and Private car. Respondents had to move the slider for their response to be recorded.
Analysis
Using R’s ez package (Lawrence 2016), we used a repeated-measure ANOVA to test the variance of respondents’ support ratings for each type of support across modes, and for each mode across support types. As the assumptions of normality and ‘sphericity’ were violated, we applied RM-ANOVA with a Greenhouse-Geisser epsilon correction (Blanca et al. 2023a; 2023b). We then estimated marginal means post-hoc testing with a Holm-Bonferroni adjustment to identify which specific types of support varied for each mode.
3. Findings
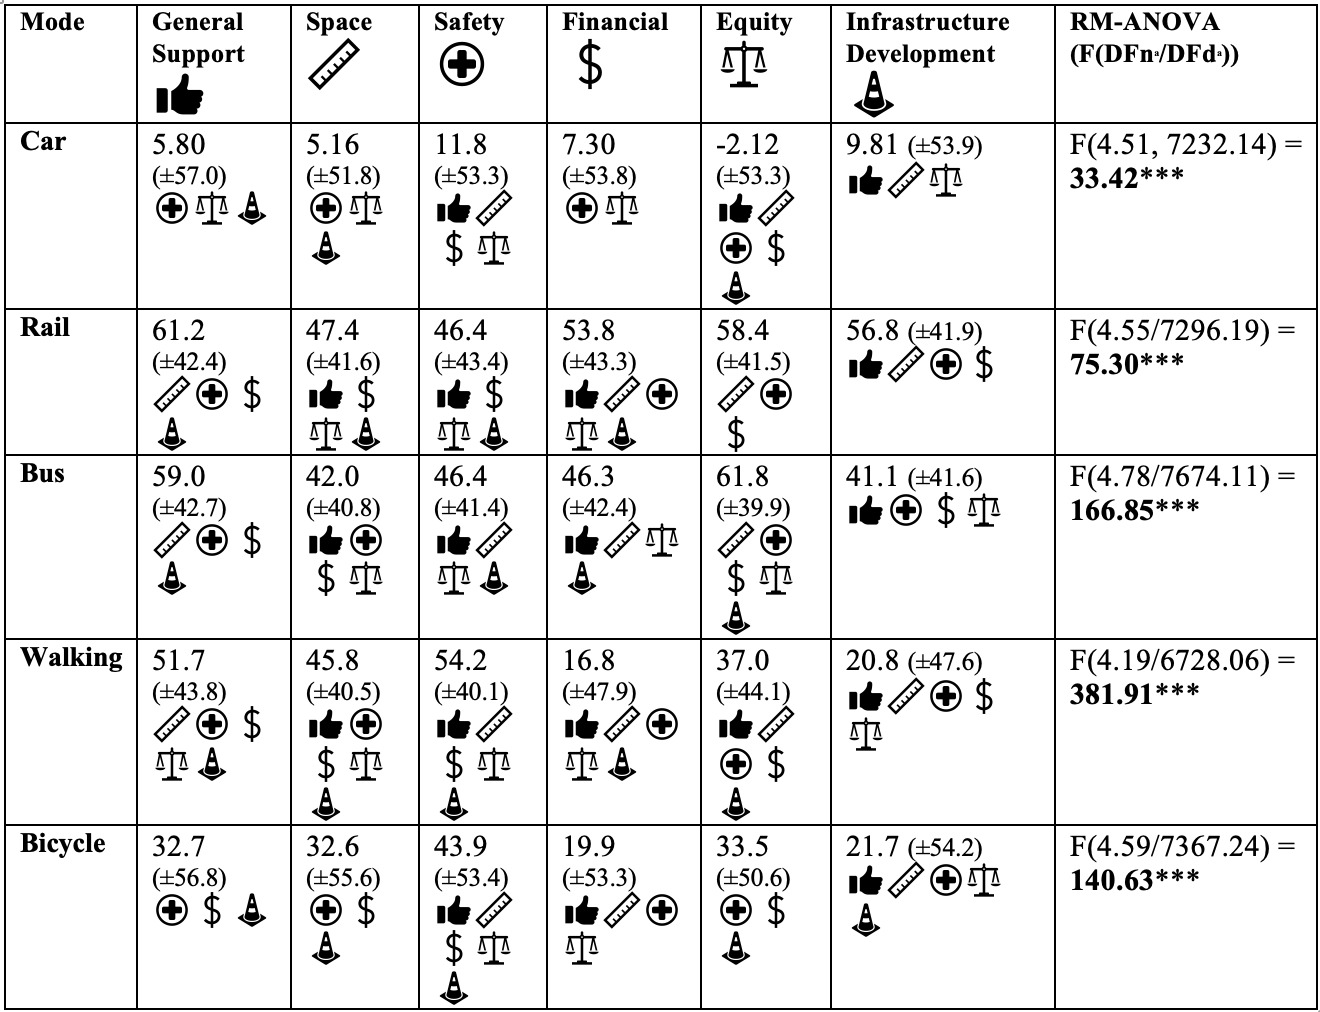
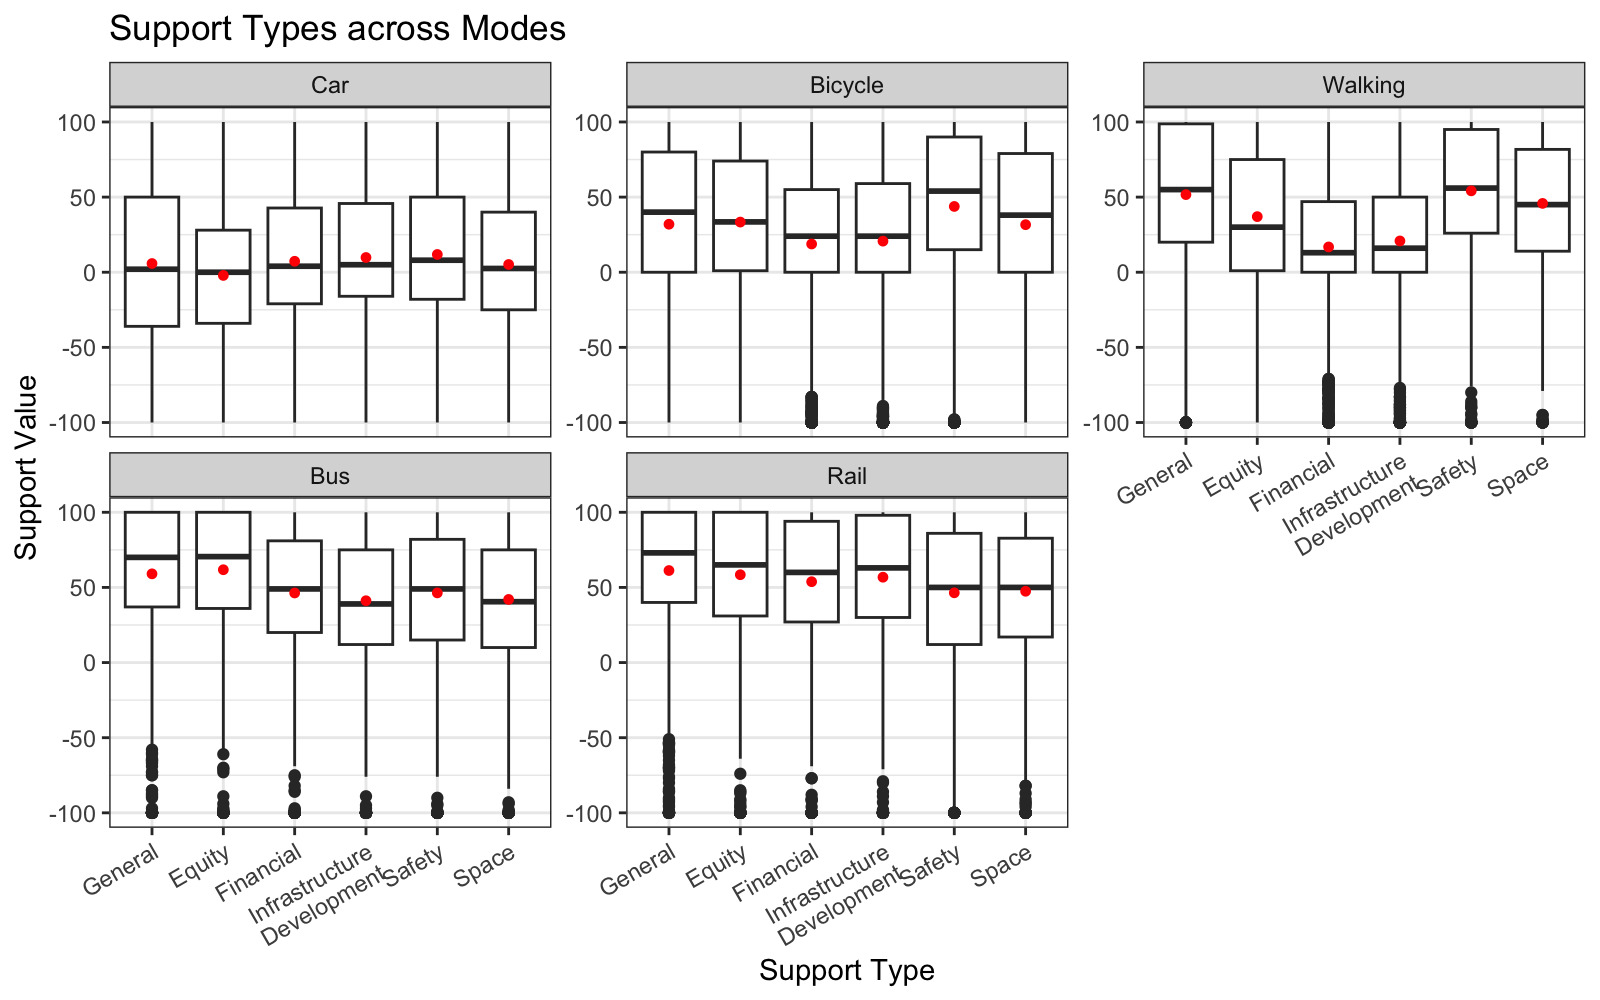
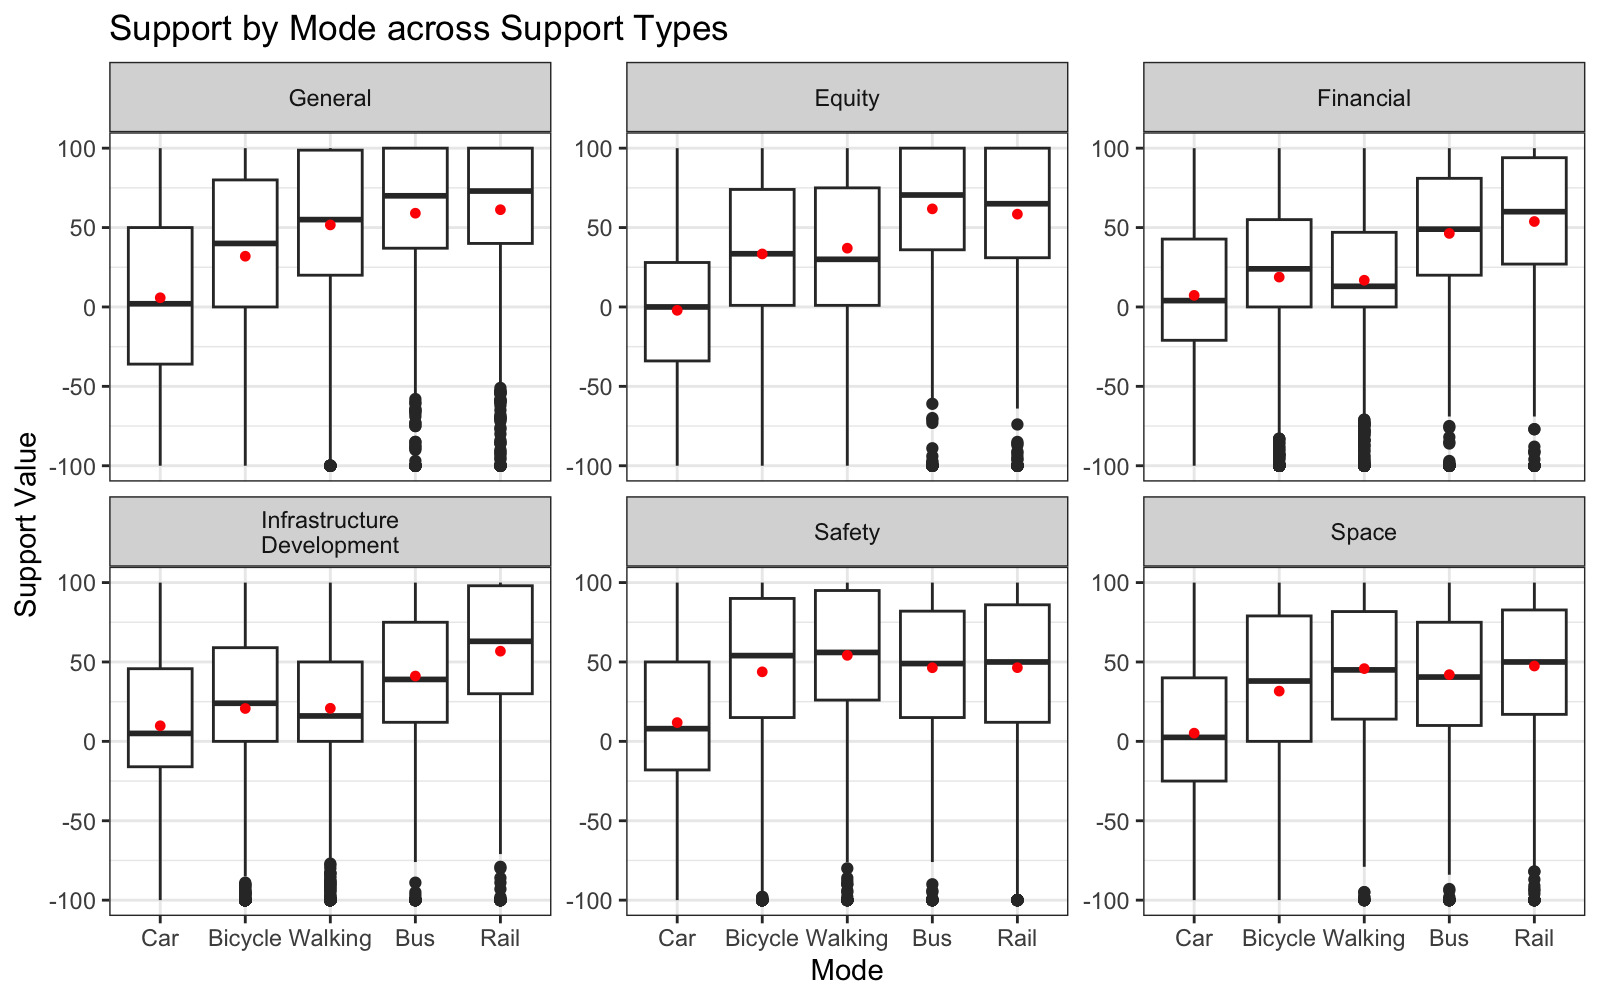
We found that, for each mode, support ratings were statistically significantly different across support types (Figure 1). Support varied for modes depending on the type of support (Table 2). For some modes such as public transit modes (rail and bus), all support types were consistently high, suggesting strong public interest in giving more support—in all forms—to these modes. Meanwhile, active modes of transportation (walking and bicycles) saw larger gaps between support for financing or infrastructure and other forms of support.
._rm-anova_column_showing_output_o.png)
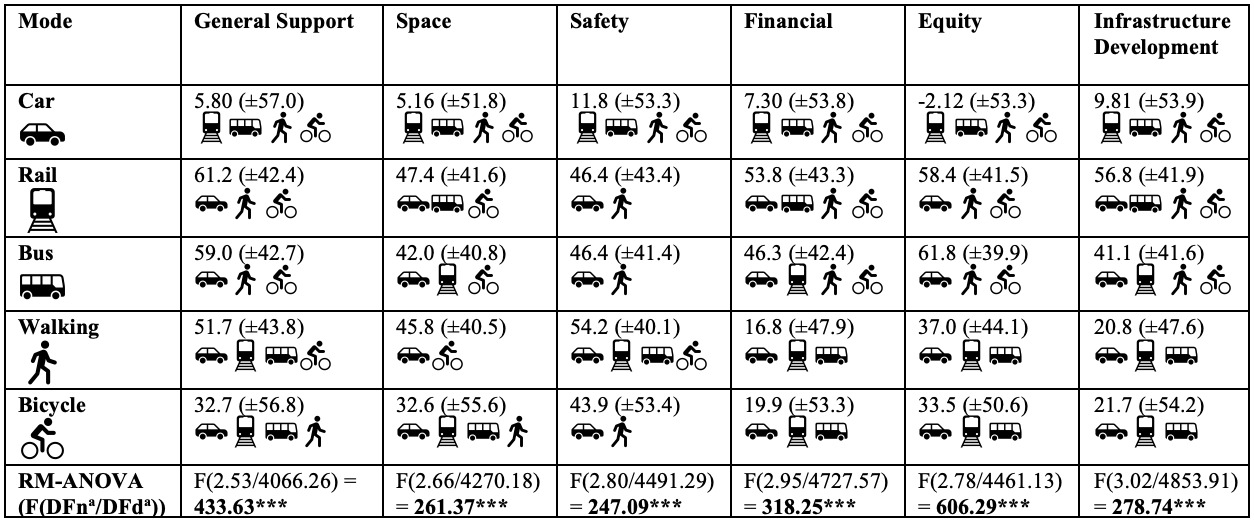
In analyzing support ratings between modes (and within a support type; Figure 2), car support is statistically significantly lower than all other modes, and this trend is consistent across all types of support, suggesting that most Montreal region residents do not think cars need more investment. Public transit modes (bus and rail) have consistently higher support across support types, except for safety, where bicycles and walking also receive high support (> 50). Statistical differences between modes can be seen in Table 3.
._rm-anova_row_showing_output_of_m.png)
Thus, we conclude that public transportation modes have very high public support on all levels, and that all modes have statistically significantly higher support than the car, also on all levels. The gap observed between high support for safety improvements for active modes and lower support in terms of financing or infrastructure for these modes may be attributed to the public’s awareness of relatively lower costs of infrastructure for these modes, concerns about reallocation of road space, or public unawareness of the relationship between active transport infrastructure and safety for these modes. However, this research does not elucidate the reasons for different levels of support depending on specific dimensions.
We also conclude that conflating all dimensions of support identified into generalized support by mode may eliminate critical insight into public opinion. Investigation into the tension of tradeoffs for different modes and types of support could clarify how people weigh different dimensions of support. Additional factors pertaining to people’s travel behavior, their built environment, and sociodemographic characteristics may also add nuance to the understanding of variance in types of support for different modes. This research lays a foundation in understanding support for different modes of transportation and the different dimensions of that support, establishing that dimensions of support vary across modes, which future research should consider.