1. Questions
Examining the determinants of vehicle ownership remains a central focus in transportation research. Past studies have examined a range of factors influencing vehicle ownership, including the built environment characteristics (Laviolette et al. 2022; Shen et al. 2016) as well as socioeconomic and residential attributes (Hankach et al. 2022; Ko et al. 2019). Several studies have focused on the economic implications of vehicle ownership (Baum 2009; Dargay et al. 2007). Researchers have also investigated how public transport service availability (Vasudevan et al. 2021; Blumenberg et al. 2021) and emerging mobility options such as carpooling (Ye et al. 2021) influence vehicle ownership choices. Recent studies have focused on the determinants of young adults’ decisions to own vehicles (Jiang et al. 2023). Against this background, the present study seeks to answer the question: What socioeconomic and travel-related factors are associated with the likelihood of car ownership in the context of a dense urban employment center in a lower-middle-income country (LMIC)? Unlike most car ownership studies that focus on citywide scales, this paper investigates the car ownership choice of employees in an emerging central business district (CBD) in Mumbai, the financial center of India. While CBDs in developed economies are characterized by strong public transport provision and parking constraints that suppress car ownership, emerging CBDs in LMICs often operate under structurally constrained transit conditions, with perceived access time to public transport and perceived travel costs playing a more central role in car ownership decisions. This study estimates a mixed logit model of car ownership that incorporates these travel-related attributes.
2. Methods
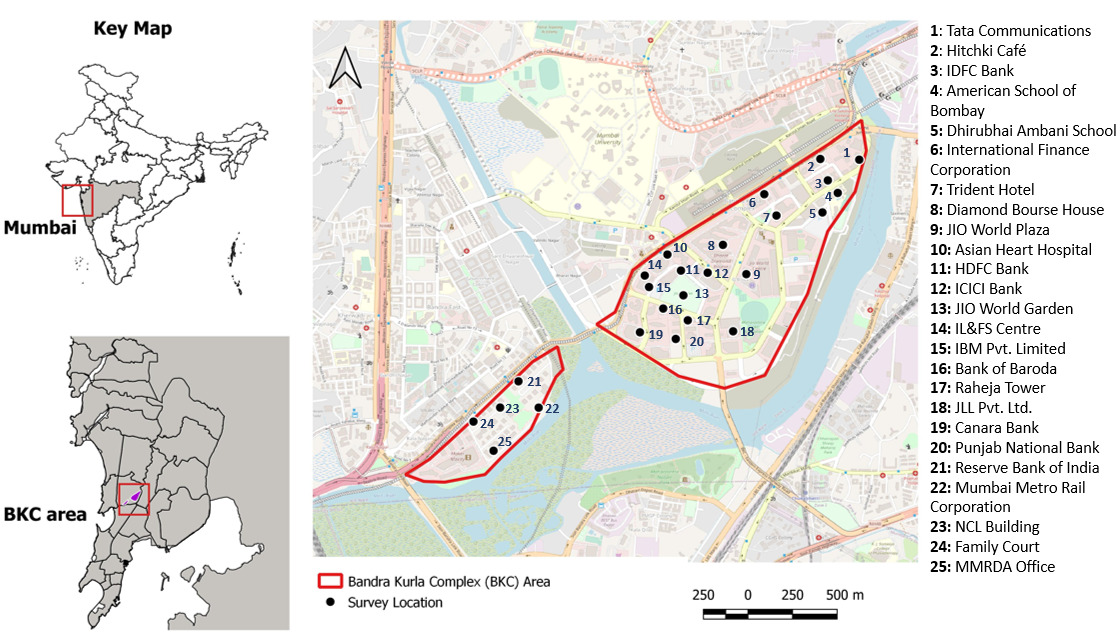
The study was conducted in Mumbai, which exhibits a polycentric urban structure with employment distributed across multiple high-intensity activity centers, focusing on the Bandra Kurla Complex (BKC) as a representative dense employment hub (Fig. 1). A revealed preference survey was conducted among employees in BKC to collect socio-economic and travel characteristics. Although BKC primarily comprises a formal workforce, responses from the informal workforce, such as daily wage earners, were also collected to ensure comprehensive representation of the working population. Data were collected from various locations, such as offices, food stalls, and shopping malls, across BKC, using a random sampling approach to ensure spatial distribution. In-person surveys were administered by trained enumerators using a web-based questionnaire developed in 123FormBuilder on smartphones. The questionnaire used for car users is provided as supplementary material.

The travel modes considered were car, two-wheeler, and public transport. In this context, public transport primarily refers to suburban rail, which is the predominant public transport mode used by commuters in BKC, as bus usage was limited and metro was not yet available in the area. Perceived travel cost (self-reported fuel expenditure or fare) was collected for current mode and the two alternative modes. Perceived access time to public transport (self-reported time to reach the boarding point) was collected from all respondents. Respondents were assumed to be familiar with alternative modes; those lacking such knowledge were excluded.
Using Slovin’s formula with a 95% confidence level (Susanto et al. 2017) the minimum required sample size was 385. A total of 764 responses were collected, of which 747 valid samples were retained after data cleaning for analysis. A mixed logit model of individual-level car ownership was estimated in R (Apollo), with perceived travel costs and perceived access time to public transport specified as random parameters. Respondents reported the number of cars they owned, which was recoded as a binary variable (1 = at least one car; 0 = none).
3. Findings
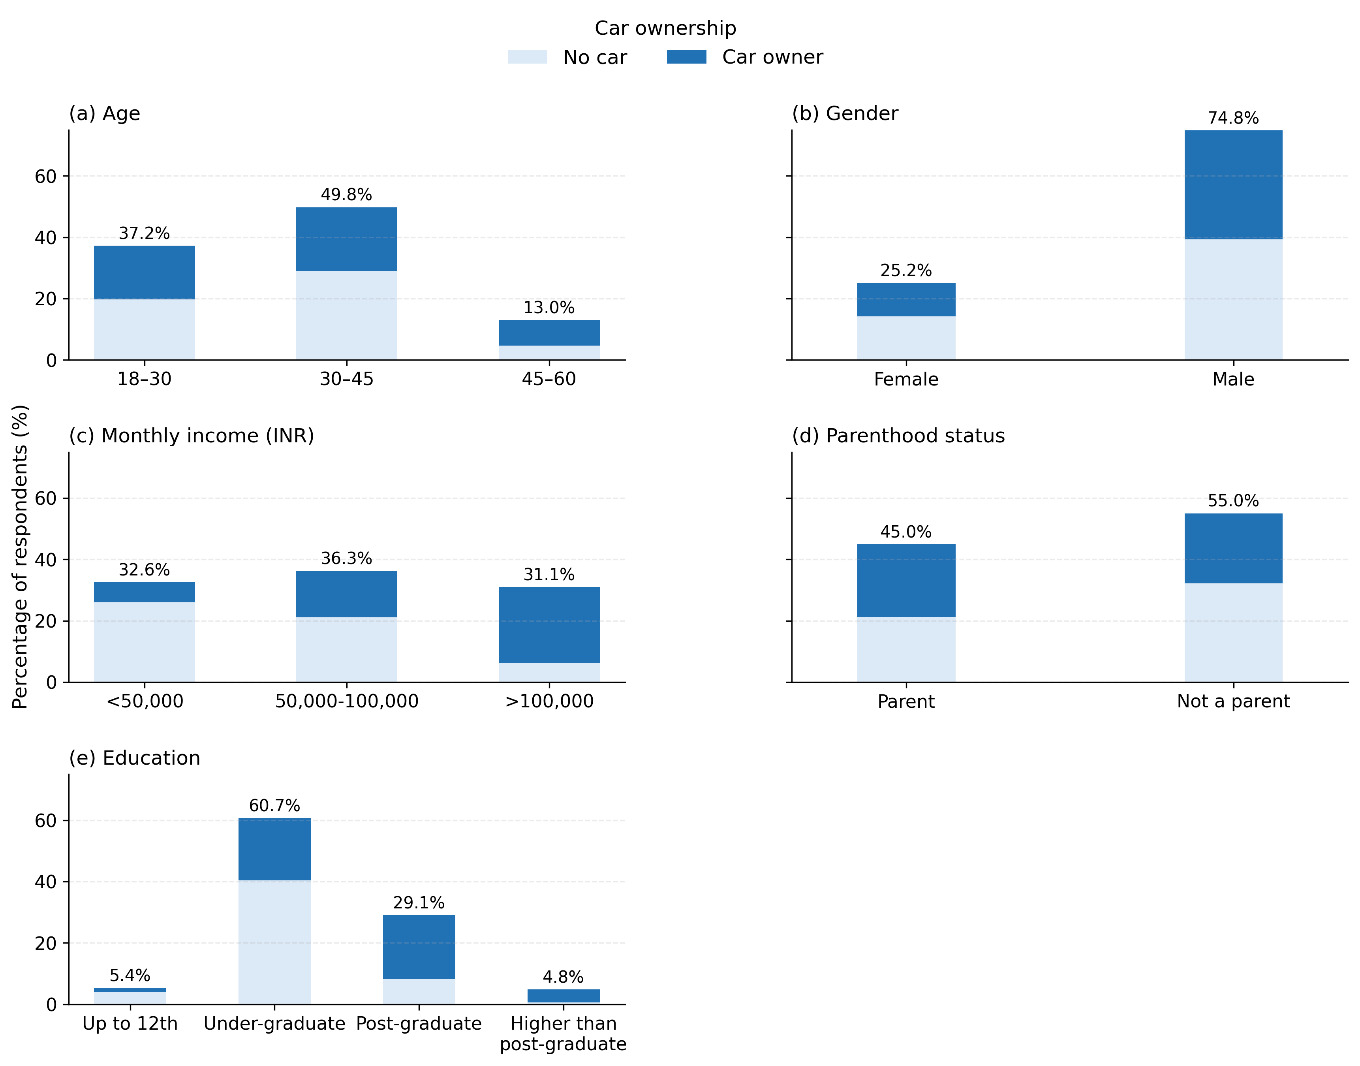
Fig. 2 presents the socio-demographic distribution of respondents along with the corresponding car ownership status. Overall, 46.5% of respondents reported owning at least one car. Based on unit-level data from the Household Consumption Expenditure Survey 2022-23, about 15% of urban households in Maharashtra state own at least one car (MoSPI, 2023). Although this reflects household-level ownership, it provides a population-level benchmark for contextualizing car ownership prevalence in this employment centre.
_age__(b)_gender__(c)_.png)
A comparison of the mean perceived travel cost per km (computed as perceived travel cost divided by trip length for each respondent) for all modes and the mean perceived access time to public transport by travel mode used is shown in Table 1. Public transport users report the lowest perceived public transport travel cost, while their perceived costs for car travel are higher than those reported by car users. In contrast, car users report higher perceived public transport cost than public transport users, while reporting lower perceived cost for car travel. Two-wheeler users report higher perceived costs for both car and public transport than the respective mode users. This pattern may reflect that, for modes not currently used, perceived travel cost captures a broader notion of travel burden rather than strictly monetary expenditure. In contrast, perceived access time to public transport shows less variation across mode user groups. Overall, these findings indicate differences in perceived travel attributes across mode user groups, supporting the use of perception-based variables in the modeling framework.
Table 2 shows the mixed logit model results. The negative and significant alternative-specific constant indicates a low baseline propensity for car ownership. Being female or aged 30 to 45 years is associated with a lower car ownership likelihood, whereas being a parent or a postgraduate is associated with a higher likelihood. The lower ownership likelihood among 30 to 45-year-olds, relative to 18 to 30-year-olds, may reflect generational trends. Easy access to car loans may enable younger professionals to purchase vehicles early, whereas mid-career individuals, often settled with family, may reside closer to work and avoid relying on cars. Higher income exhibits a strong positive association with car ownership probability, with individuals with more than 50,000 INR monthly income more likely to own cars.
Higher perceived car travel cost is associated with a lower car ownership likelihood, whereas higher perceived travel costs of two-wheeler and public transport are associated with a higher likelihood. Longer perceived access times to public transport are significantly associated with an increased car ownership likelihood. Normal distributions were assigned to the random parameters representing perceived travel costs and perceived access time to public transport. The model reveals significant heterogeneity in sensitivity to perceived two-wheeler travel cost, while heterogeneity in perceived car travel cost sensitivity is marginally significant at the 10% level.
Scenario-based analysis (Table 3) shows that as perceived access time to public transport shifts to 50% of its current level, the predicted probability of car ownership decreased from 0.474 to 0.418, indicating an absolute reduction of 0.056 (5.6%). This corresponds to an 11.8% decrease in ownership likelihood relative to the baseline scenario. This scenario is based on a shift in perceived access time to public transport rather than a change in actual network conditions. The results indicate that, within the estimated model, car ownership probability is sensitive to changes in perceived access time to public transport.
Overall, the results indicate that reductions in perceived access time to public transport and the perceived travel costs of alternative modes are associated with a lower likelihood of car ownership in this context. These findings are consistent with the view that enhancing first-mile connectivity and maintaining affordable public transport fares could help moderate car ownership probability, particularly in dense urban regions like Mumbai.