This website uses cookies

We use cookies to enhance your experience and support COUNTER Metrics for transparent reporting of readership statistics. Cookie data is not sold to third parties or used for marketing purposes.

Skip to main content
null
Findings
  • Menu
  • Articles
    • Energy Findings
    • Resilience Findings
    • Safety Findings
    • Transport Findings
    • Urban Findings
    • All
  • For Authors
  • Editorial Board
  • About
  • Blog
  • search
  • X (formerly Twitter) (opens in a new tab)
  • LinkedIn (opens in a new tab)
  • RSS feed (opens a modal with a link to feed)

RSS Feed

Enter the URL below into your favorite RSS reader.

https://findingspress.org/feed
ISSN 2652-8800
Transport Findings
April 03, 2026 AEST

An Assessment of Microtransit Impacts on its Substitution and Complementarity with other Modes

Maha Ahmad, PhD candidate, Lillian Cella, Masters, Susan C. Pike, PhD, Bailey Affolter, PhD student, Kari E. Watkins, PhD,
mode shifton-demand transitODTdemand-responsive transitDRTmicrotransitpublic transittravel behavior
Copyright Logoccby-sa-4.0 • https://doi.org/10.32866/001c.159013
Findings
Ahmad, Maha, Lillian Cella, Susan C. Pike, Bailey Affolter, and Kari E. Watkins. 2026. “An Assessment of Microtransit Impacts on Its Substitution and Complementarity with Other Modes.” Findings, April 2. https://doi.org/10.32866/001c.159013.
Download all (3)
  • Figure 1. Income groups of MARTA rail and bus users from 2019 ARC survey and MARTA Reach users from the first survey used in this study in 2022
    Download
  • Figure 2. Percentage of respondents reporting use of other modes alongside MARTA Reach on a single trip (Modes used in combination with MARTA Reach). Sustainable modes are shown in green boxes. N=200.
    Download
  • Figure 3. Percentage of respondents reporting use of substitution of modes in case of unavailability of MARTA Reach. Green boxes indicate which unsustainable modes were substituted and the trips that were enabled due to MARTA Reach. N=200
    Download

Error

Sorry, something went wrong. Please try again.

If this problem reoccurs, please contact Scholastica Support

Error message:

undefined

View more stats

Abstract

In March of 2022, the Metropolitan Atlanta Rapid Transit Authority, or MARTA, which had previously been a fixed-route system only, implemented a demand-responsive transit system called MARTA Reach. This work analyzes data collected from a registration survey given to people who signed up for MARTA Reach and a rider survey of people who completed at least one trip by MARTA Reach. We analyzed the reported change in travel behavior after people started using MARTA Reach and found that within the group that used transit for commute trips, the largest mode shift is observed in the medium Reach usage group.

1. Questions

This paper addresses the following questions:

  1. Which transportation modes complement or substitute for microtransit trips?

  2. Are shifts in mode frequency consistent with which modes complement or substitute for microtransit?

Microtransit or demand-responsive transit (DRT) is an emerging transit mode that typically consists of shuttle sized vehicles providing service on-demand to one or more passengers. Questions exist about the benefits, drawbacks and potential mode shifts resulting from microtransit.

We examine the MARTA Reach pilot DRT service in Atlanta GA, which started in March 2022. We conduct exploratory analysis of which modes complemented MARTA Reach, which modes were displaced and how varying use levels of MARTA Reach shifted the mode choices of its users. MARTA Reach fares were the same as MARTA bus fare i.e. $2.50 one-way[1].

2. Methods

We use data collected from two longitudinal surveys and one trip survey of MARTA Reach users (Drake and Watkins 2024)[2]. A registration survey (n = 178) was administered before the Reach pilot, between March and September 2022. A trip survey was administered while the pilot was active (n=200 with 323 recorded trips). An evaluation survey (n = 210) was administered at the closing of the pilot, for users that used Reach at least once between August and September 2022.

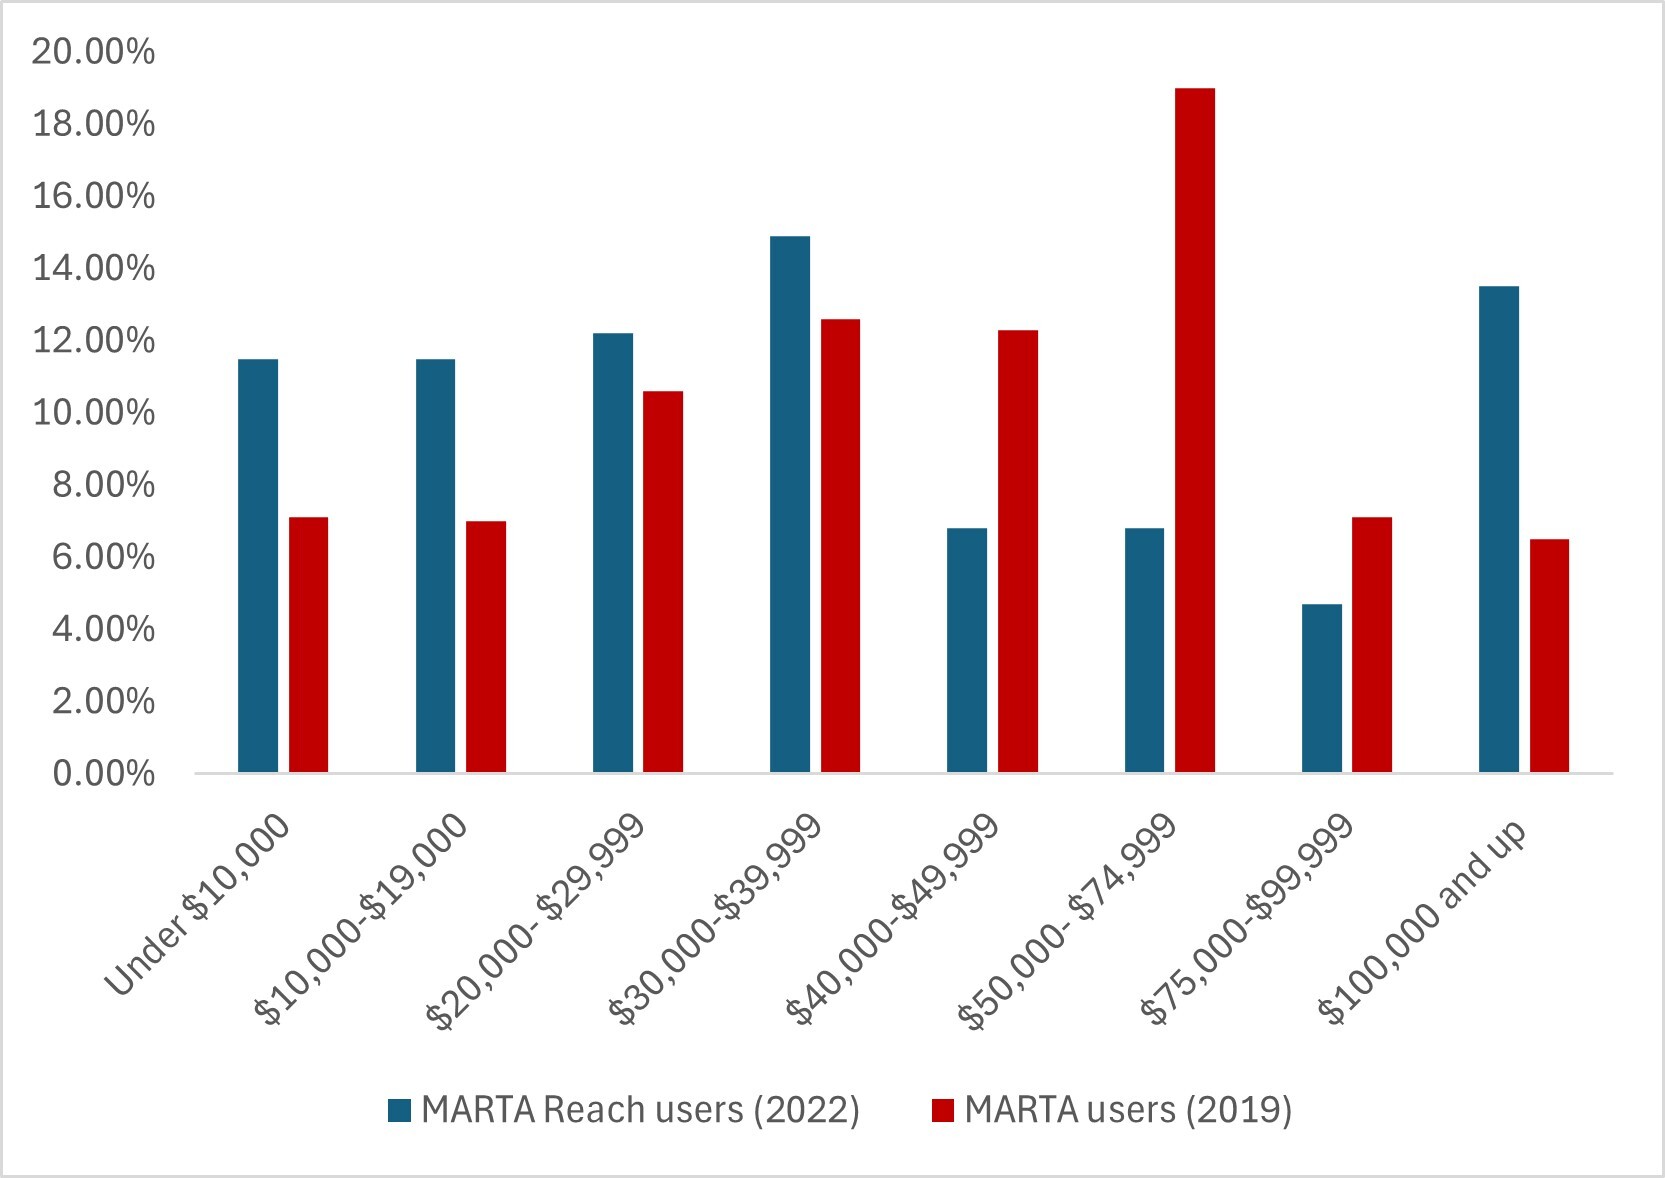
Our analysis includes all respondents that completed the survey and indicated they had used Reach at least once when taking the evaluation survey. We compare our respondents’ demographics to those of MARTA riders from a 2019 survey administered by the Atlanta Regional Commission (ARC) and found ethnicity to be generally similar, but there are some differences in income (Figure 1).

Figure 1
Figure 1.Income groups of MARTA rail and bus users from 2019 ARC survey and MARTA Reach users from the first survey used in this study in 2022

Respondents were asked which other modes were used during their MARTA Reach trip and which modes they would have used if Reach were not available. Both surveys consisted of questions about the use of various modes for work/school trips, and shopping/social trips, and were mostly identical between the two surveys.

3. Findings

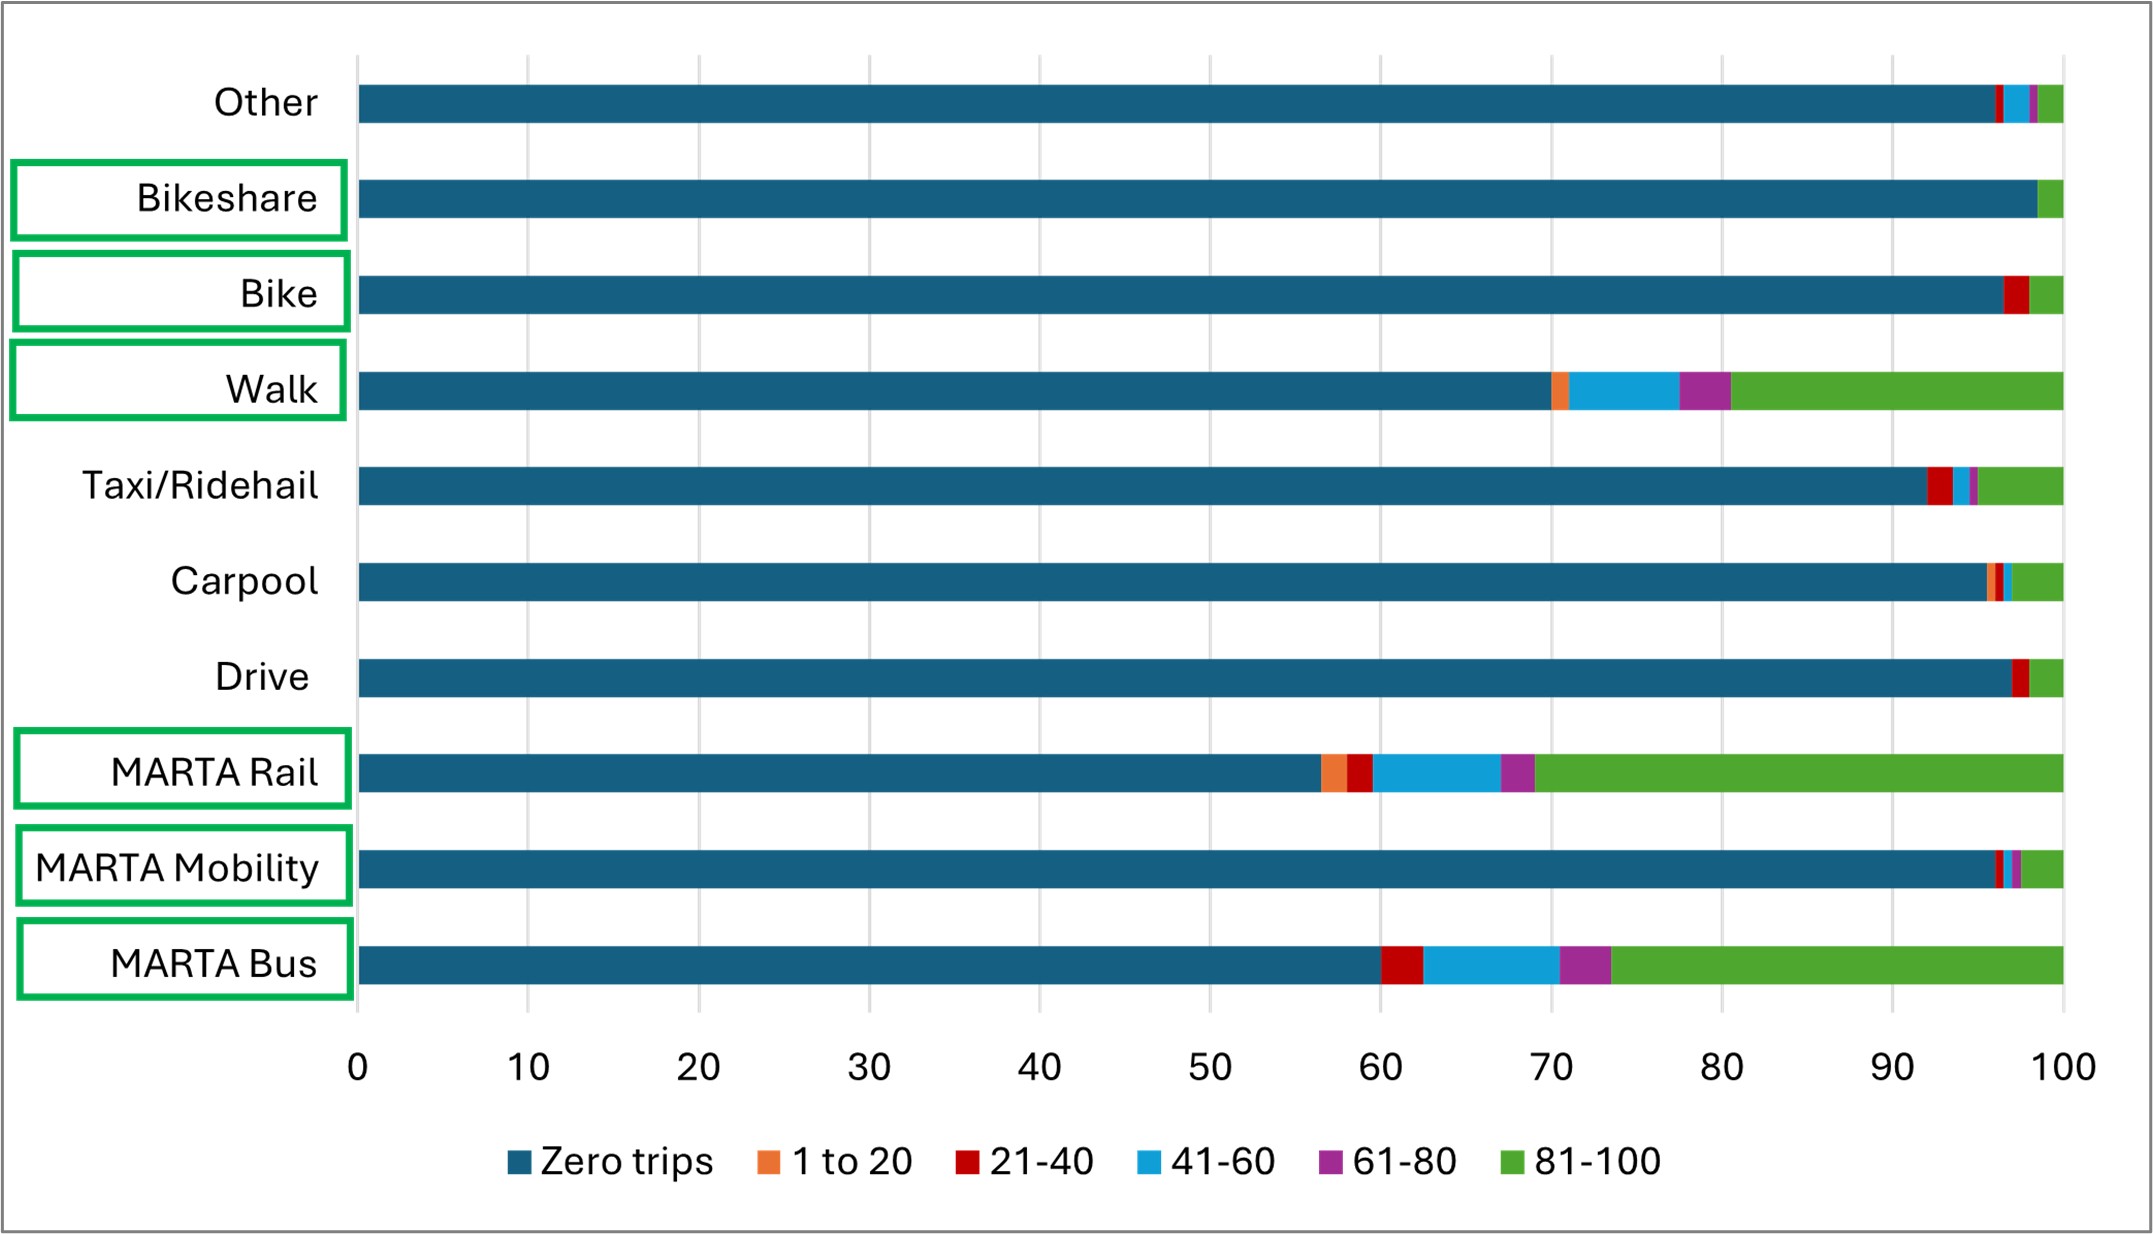
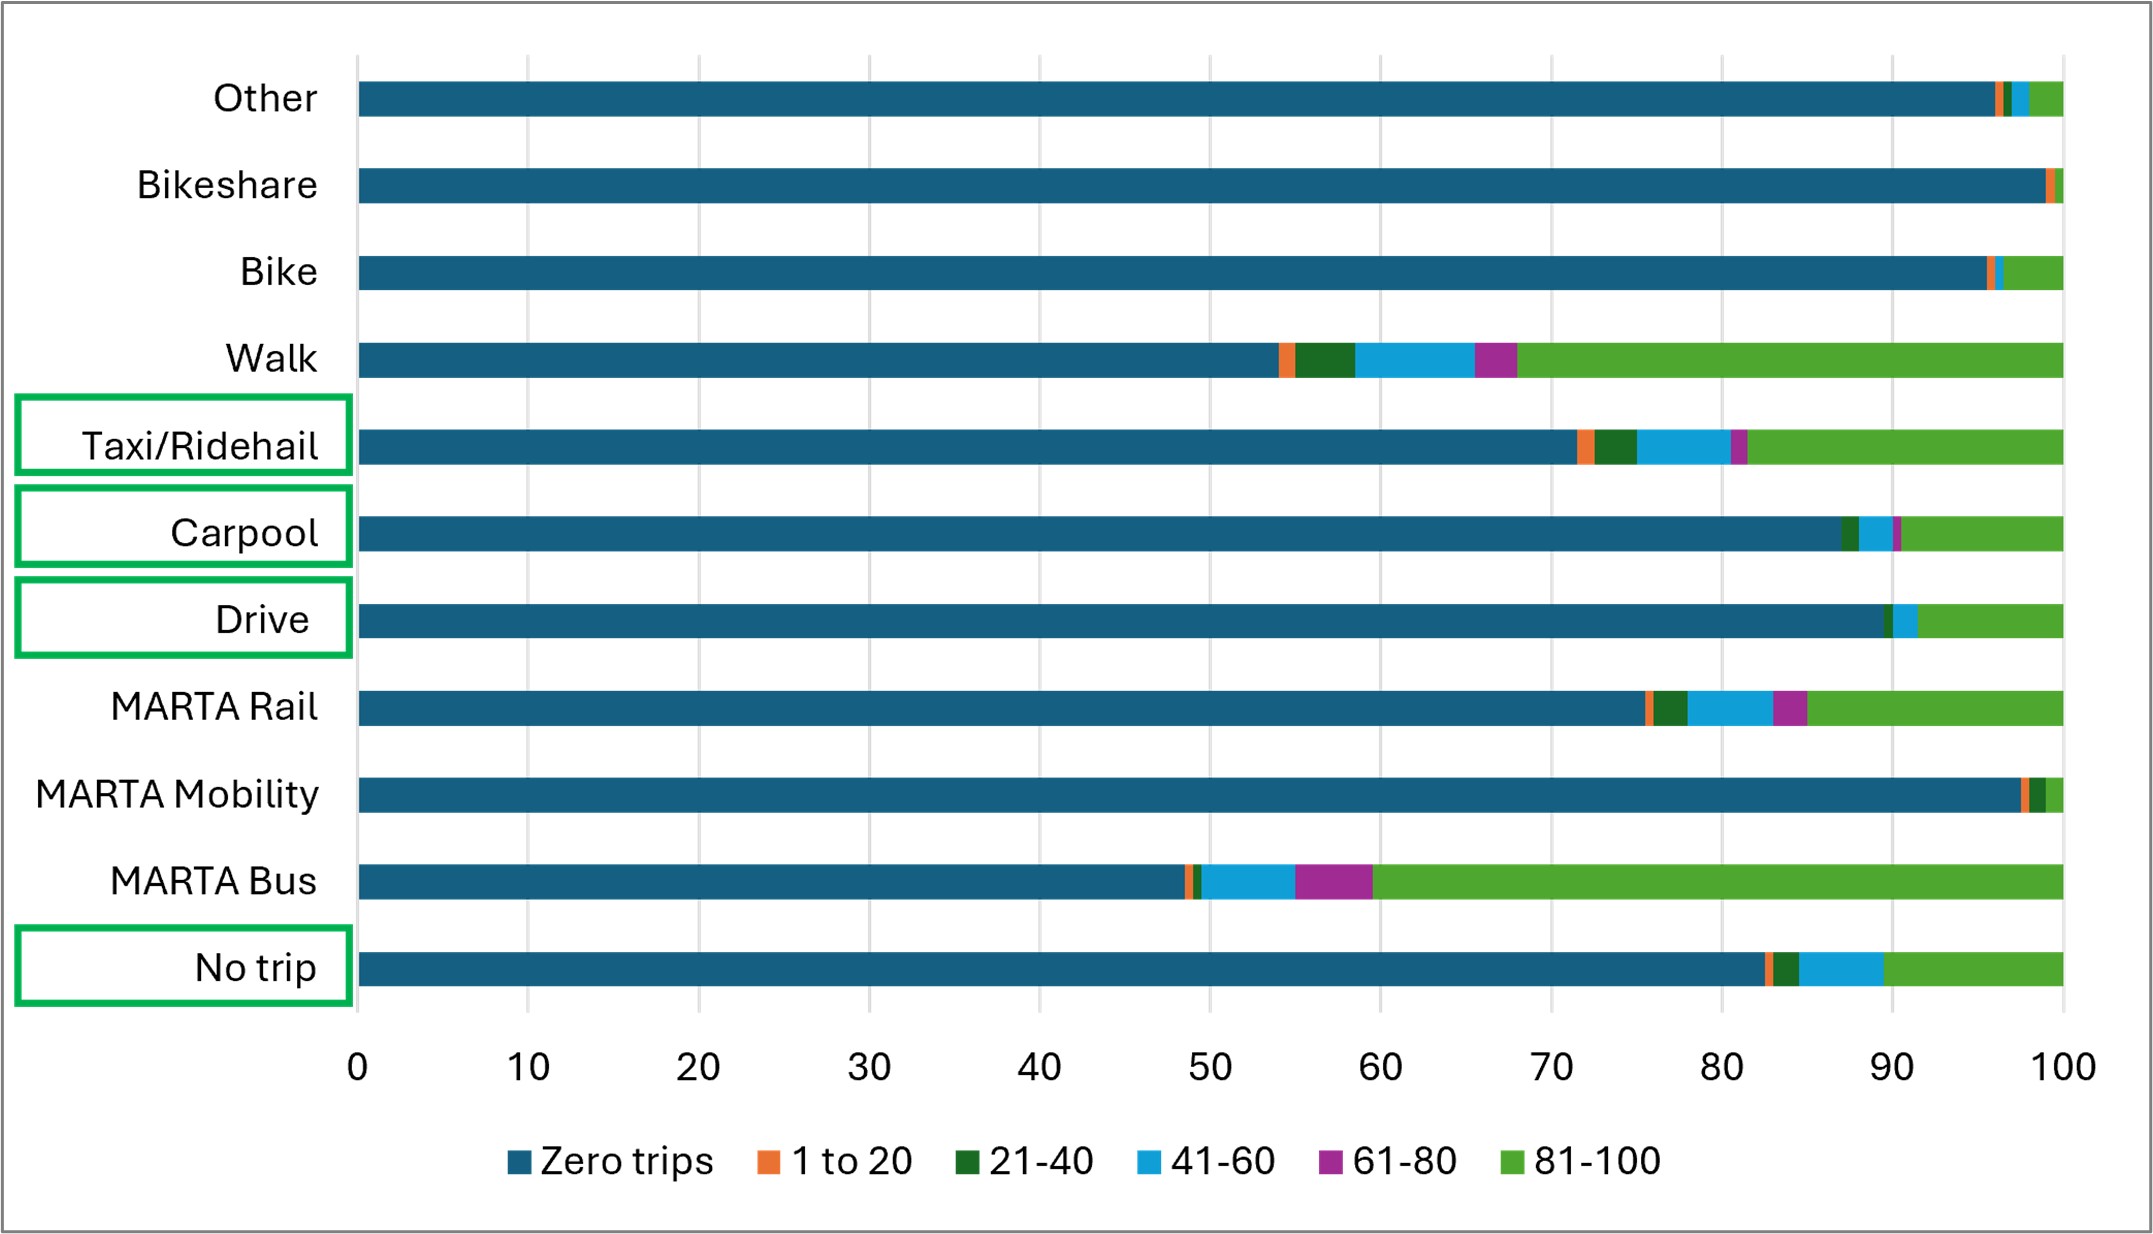
Table 1 shows the percentage of respondents reporting modes used in combination with Reach (top half) and that would be used if Reach were unavailable (bottom half). For example, 26.5% of respondents used MARTA bus on 81-100% of their Reach trips, showing high complementarity. Were Reach not available, 8.5% of respondents said they would have driven on 81-100% of their trips, and 10.5% of respondents would not have made 81-100% of their trips. The information in Table 1 is shown in Figure 2 and Figure 3 for readability.

Table 1.Percentage of respondents reporting use of other modes alongside MARTA Reach on a single trip (Modes used in combination with MARTA Reach) and modes used to substitute MARTA Reach in case of unavailability (Substitution modes). N=200.
Modes used in combination with MARTA Reach (n=200)
% of trips Zero trips 1-20 21-40 41-60 61-80 81-100 Total
Count of respondents (% of respondents)
MARTA Bus 120 (60%) 0 (0%) 5 (2.5%) 16 (8%) 6 (3%) 53 (26.5%) 200
MARTA Mobility 192 (96%) 0 (0%) 1 (0.5%) 1 (0.5%) 1 (0.5%) 5 (2.5%) 200
MARTA Rail 113 (56.5%) 3 (1.5%) 3 (1.5%) 15 (7.5%) 4 (2%) 62 (31%) 200
Drive 194 (97%) 0 (0%) 2 (1%) 0 (0%) 0 (0%) 4 (2%) 200
Carpool 191 (95.5%) 1 (0.5%) 1 (0.5%) 1 (0.5%) 0 (0%) 6 (3%) 200
Taxi/Ridehail 184 (92%) 0 (0%) 3 (1.5%) 2 (1%) 1 (0.5%) 10 (5%) 200
Walk 140 (70%) 2 (1%) 0 (0%) 13 (6.5%) 6 (3%) 39 (19.5%) 200
Bike 193 (96.5%) 0 (0%) 3 (1.5%) 0 (0%) 0 (0%) 4 (2%) 200
Bikeshare 197 (98.5%) 0 (0%) 0 (0%) 0 (0%) 0 (0%) 3 (1.5%) 200
Other 192 (96%) 0 (0%) 1 (0.5%) 3 (1.5%) 1 (0.5%) 3 (1.5%) 200
Substitution Modes (n=200)
% of trips Zero trips 1-20 21-40 41-60 61-80 81-100 Total
Count of respondents (% of respondents)
No trip 165 (82.5%) 1 (0.5%) 3 (1.5%) 10 (5%) (0%) 21 (10.5%) 200
MARTA Bus 97 (48.5%) 1 (0.5%) 1 (0.5%) 11 (5.5%) 9 (4.5%) 81 (40.5%) 200
MARTA Mobility 195 (97.5%) 1 (0.5%) 2 (1%) (0%) (0%) 2 (1%) 200
MARTA Rail 151 (75.5%) 1 (0.5%) 4 (2%) 10 (5%) 4 (2%) 30 (15%) 200
Drive 179 (89.5%) 0 (0%) 1 (0.5%) 3 (1.5%) (0%) 17 (8.5%) 200
Carpool 174 (87%) 0 (0%) 2 (1%) 4 (2%) 1 (0.5%) 19 (9.5%) 200
Taxi/Ridehail 143 (71.5%) 2 (1%) 5 (2.5%) 11 (5.5%) 2 (1%) 37 (18.5%) 200
lk 108 (54%) 2 (1%) 7 (3.5%) 14 (7%) 5 (2.5%) 64 (32%) 200
Bike 191 (95.5%) 1 (0.5%) (0%) 1 (0.5%) (0%) 7 (3.5%) 200
Bikeshare 198 (99%) 1 (0.5%) (0%) (0%) (0%) 1 (0.5%) 200
Other 192 (96%) 1 (0.5%) 1 (0.5%) 2 (1%) (0%) 4 (2%) Total
Figure 2
Figure 2.Percentage of respondents reporting use of other modes alongside MARTA Reach on a single trip (Modes used in combination with MARTA Reach). Sustainable modes are shown in green boxes. N=200.

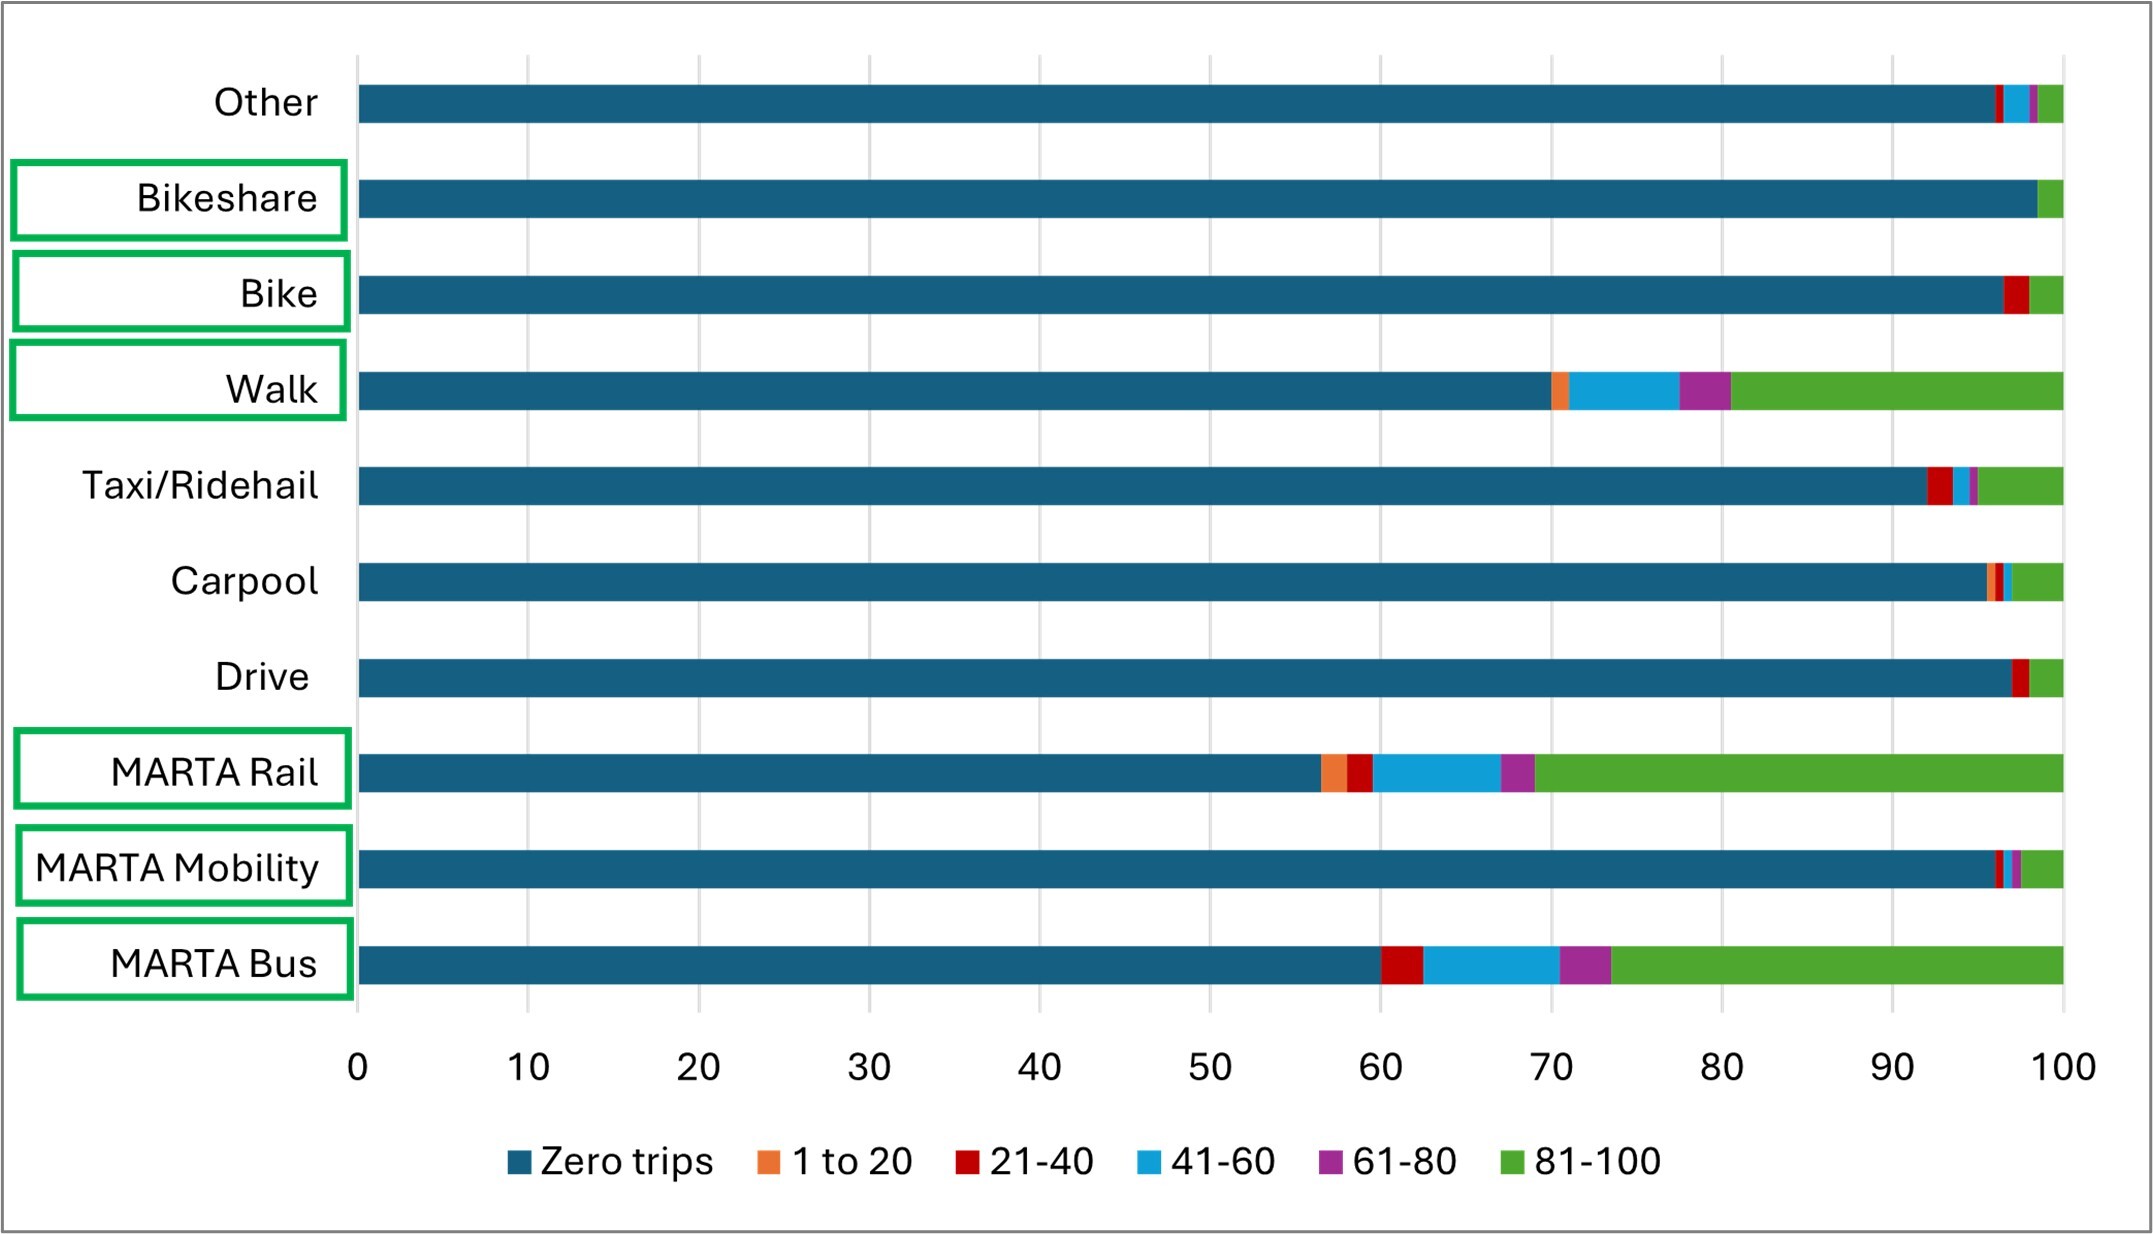
Some sustainable modes (walk, MARTA Rail and MARTA Bus) were used frequently alongside MARTA Reach on a single trip, whereas other sustainable modes such as biking, bikeshare and MARTA Mobility were not frequently used to complement MARTA Reach on a single trip. At the same time, 5% of respondents reported using taxi/ridehail on 81-100% of their Reach trips, showing low complementarity.

Figure 3
Figure 3.Percentage of respondents reporting use of substitution of modes in case of unavailability of MARTA Reach. Green boxes indicate which unsustainable modes were substituted and the trips that were enabled due to MARTA Reach. N=200

While many respondents would have used other MARTA transit modes if Reach were not available, Reach enabled some new trips and displaced unsustainable modes including taxi/ridehail and driving. Unsustainable modes such as taxi/ridehail, carpool, and drive were more strongly associated with substitution for microtransit than with complementarity. MARTA Bus and walk were among the most displaced modes. However, MARTA Bus also had a strong complementary relationship for some users (Figure 2).

Next, we examine reported changes in the use frequency of transit, taxi/ridehail, drive alone, bike/scoot, walk and paratransit for commute and non-commute trips. The frequency reported in the evaluation (after) survey is compared qualitatively to the frequency reported in the registration (before) survey. Three use levels for MARTA Reach (high, medium and never) were defined based on self-reported data from the surveys (see notes to Table 2). Fisher’s Exact Test p-values (two-sided) were calculated using the fisher.test package in R. Table 2 shows the change in the frequency of use of modes for which significant p-values were found. For commute trips, 22.58% of high Reach users and 33.33% of medium Reach users increased their use of transit, implying some degree of complementarity between microtransit and transit. The questions about frequency of use were the same for all modes except transit. The registration survey asked about transit use overall. The evaluation survey asked about three transit modes: MARTA Reach, MARTA bus/rail and other public transit (Georgia Regional Transportation Authority, CobbLinc, etc.). We considered the maximum frequency reported in the three categories in the evaluation survey as a proxy for overall transit use. This may underestimate transit use in the evaluation survey, and thereby change in usage, but we considered this the most conservative approach. We find a statistically significant association between MARTA Reach usage and changes in taxi/ride-hail and transit use for commute trips. In some cases, there are mixed shifts, i.e. increase and decrease within the same Reach usage group. For example, 53.33% of medium Reach users who use taxi/ridehail reported the same levels of taxi/ridehail usage whereas 33.33% of the same group reported a decrease. These patterns may occur due to user heterogeneity or differences in how microtransit interacts with other modes and constraints. Some riders may substitute Reach for ridehailing on certain trips, while others use it for new trips, leading to more overall travel (and perhaps more ridehailing). There may also be differences by trip purpose, time-of-day, and access or parking constraints.

For non-commute trips, transit is the only mode with a statistically significant association with MARTA Reach usage. High Reach users predominantly have the same transit use overall, while the medium user group decreased transit use, possibly due to substitution. Interestingly, the group that never used Reach predominantly increased transit use.

Table 2.Mode shift in commute trips to work and school and non-commute (shopping/social) trips by MARTA Reach usage. Data reported as frequencies with column-wise percentages in parentheses. High, medium and never definitions are given below the table. Modes with significant p-values at 5% are shown in red font with asterisk. N= 63.
Reach Usage Categories (commute)
High (n=31) Medium (n=17) Never (n=15)
Transit Decreased 1 (3.23%) 4 (26.67%) 4 (26.67%)
Same 23 (74.19%) 6 (40.00%) 9 (60.00%)
Increased 7 (22.58%) 5 (33.33%) 2 (13.33%)
Total 31 15 15
Fisher’s exact test p-value = 0.0409 (significant at 5%)
Taxi/Ridehail Decreased 4 (14.29%) 5 (33.33%) 3 (20.00%)
Same 11 (39.29%) 8 (53.33%) 12 (80.00%)
Increased 13 (46.43%) 2 (13.33%) 0 (0%)
Total 28 15 15
Fisher’s exact test p-value = 0.0043 (significant at 5%)
Reach Usage Categories (non-commute)
High (n=31) Medium (n=17) Never (n=15)
Transit Decreased 8 (28.57%) 9 (64.29%) 2 (13.33%)
Same 17 (60.71%) 2 (14.29%) 5 (33.33%)
Increased 3 (10.71%) 3 (21.43%) 8 (53.33%)
Total 28 14 15
Fisher’s exact test p-value = 0.0013 (significant at 5%)

Note: the ‘high’ Reach use category refers to those who used Reach at least three days a week. The ‘medium’ category is the group that used Reach between less than once a month and 2 days a week. The ‘never’ category refers to people who had signed up for the service (and thus took the first survey) and who never used Reach for work/school trips but may have used it for non-commute trips.

The limitations of this study include reliance on self-reported data, small cell sizes and the lack of a comparison group. The survey did not ask about primary mode, and due to the small sample size, we could not assign respondents to mode choice clusters. It is also possible that the difference between levels of Reach use reflect who the users are, or unobserved changes in external factors over the study period, such as seasonal changes, rather than the effect of Reach itself.


  1. https://sam.isye.gatech.edu/projects/marta-reach-piloting-demand-multimodal-transit-atlanta

  2. These surveys were administered using Qualtrics, to MARTA Reach users who provided their email addresses upon signing up.

Submitted: December 02, 2025 AEST

Accepted: March 14, 2026 AEST

References

Drake, J., and K. Watkins. 2024. “An Evaluation of On-Demand Transit User and Interested-Non-User Characteristics and the Factors That Attract the Transit-Curious to Using on-Demand Transit.” Travel Behaviour and Society 37: 100868. https:/​/​doi.org/​10.1016/​j.tbs.2024.100868.
Google Scholar

Attachments

Powered by Scholastica, the modern academic journal management system