1. Questions
Transportation poverty is understood as a lack of transportation-related resources that impact or limit a person’s ability to access essential services (Luz and Portugal 2022). It is often interrelated with income poverty, as low-income populations may lack access to or cannot afford alternate transportation options (Lucas et al. 2016). Allen and Farber (2019) find that while low-income residents are often more likely to live in areas of Canada with higher relative accessibility, many still reside in low-accessibility areas. Furthermore, large cities like Toronto and Vancouver have fewer high-access low-income neighbourhoods, likely because housing costs and gentrification push poor residents to the suburbs. Walkable, transit-rich neighbourhoods are undersupplied, and high demand drives up housing costs, excluding lower-income households (Makarewicz et al. 2020). Construction of transit-oriented development (TOD) offers opportunities to provide affordable housing in high-accessibility areas. However, the potential impact on lowering transport poverty remains unstudied. We investigate:
-
What is the potential effect of TODs on transportation poverty for low-income people living in medium-sized cities?
-
How large an effect can one TOD site have on transportation poverty measures at the municipal scale?
2. Methods
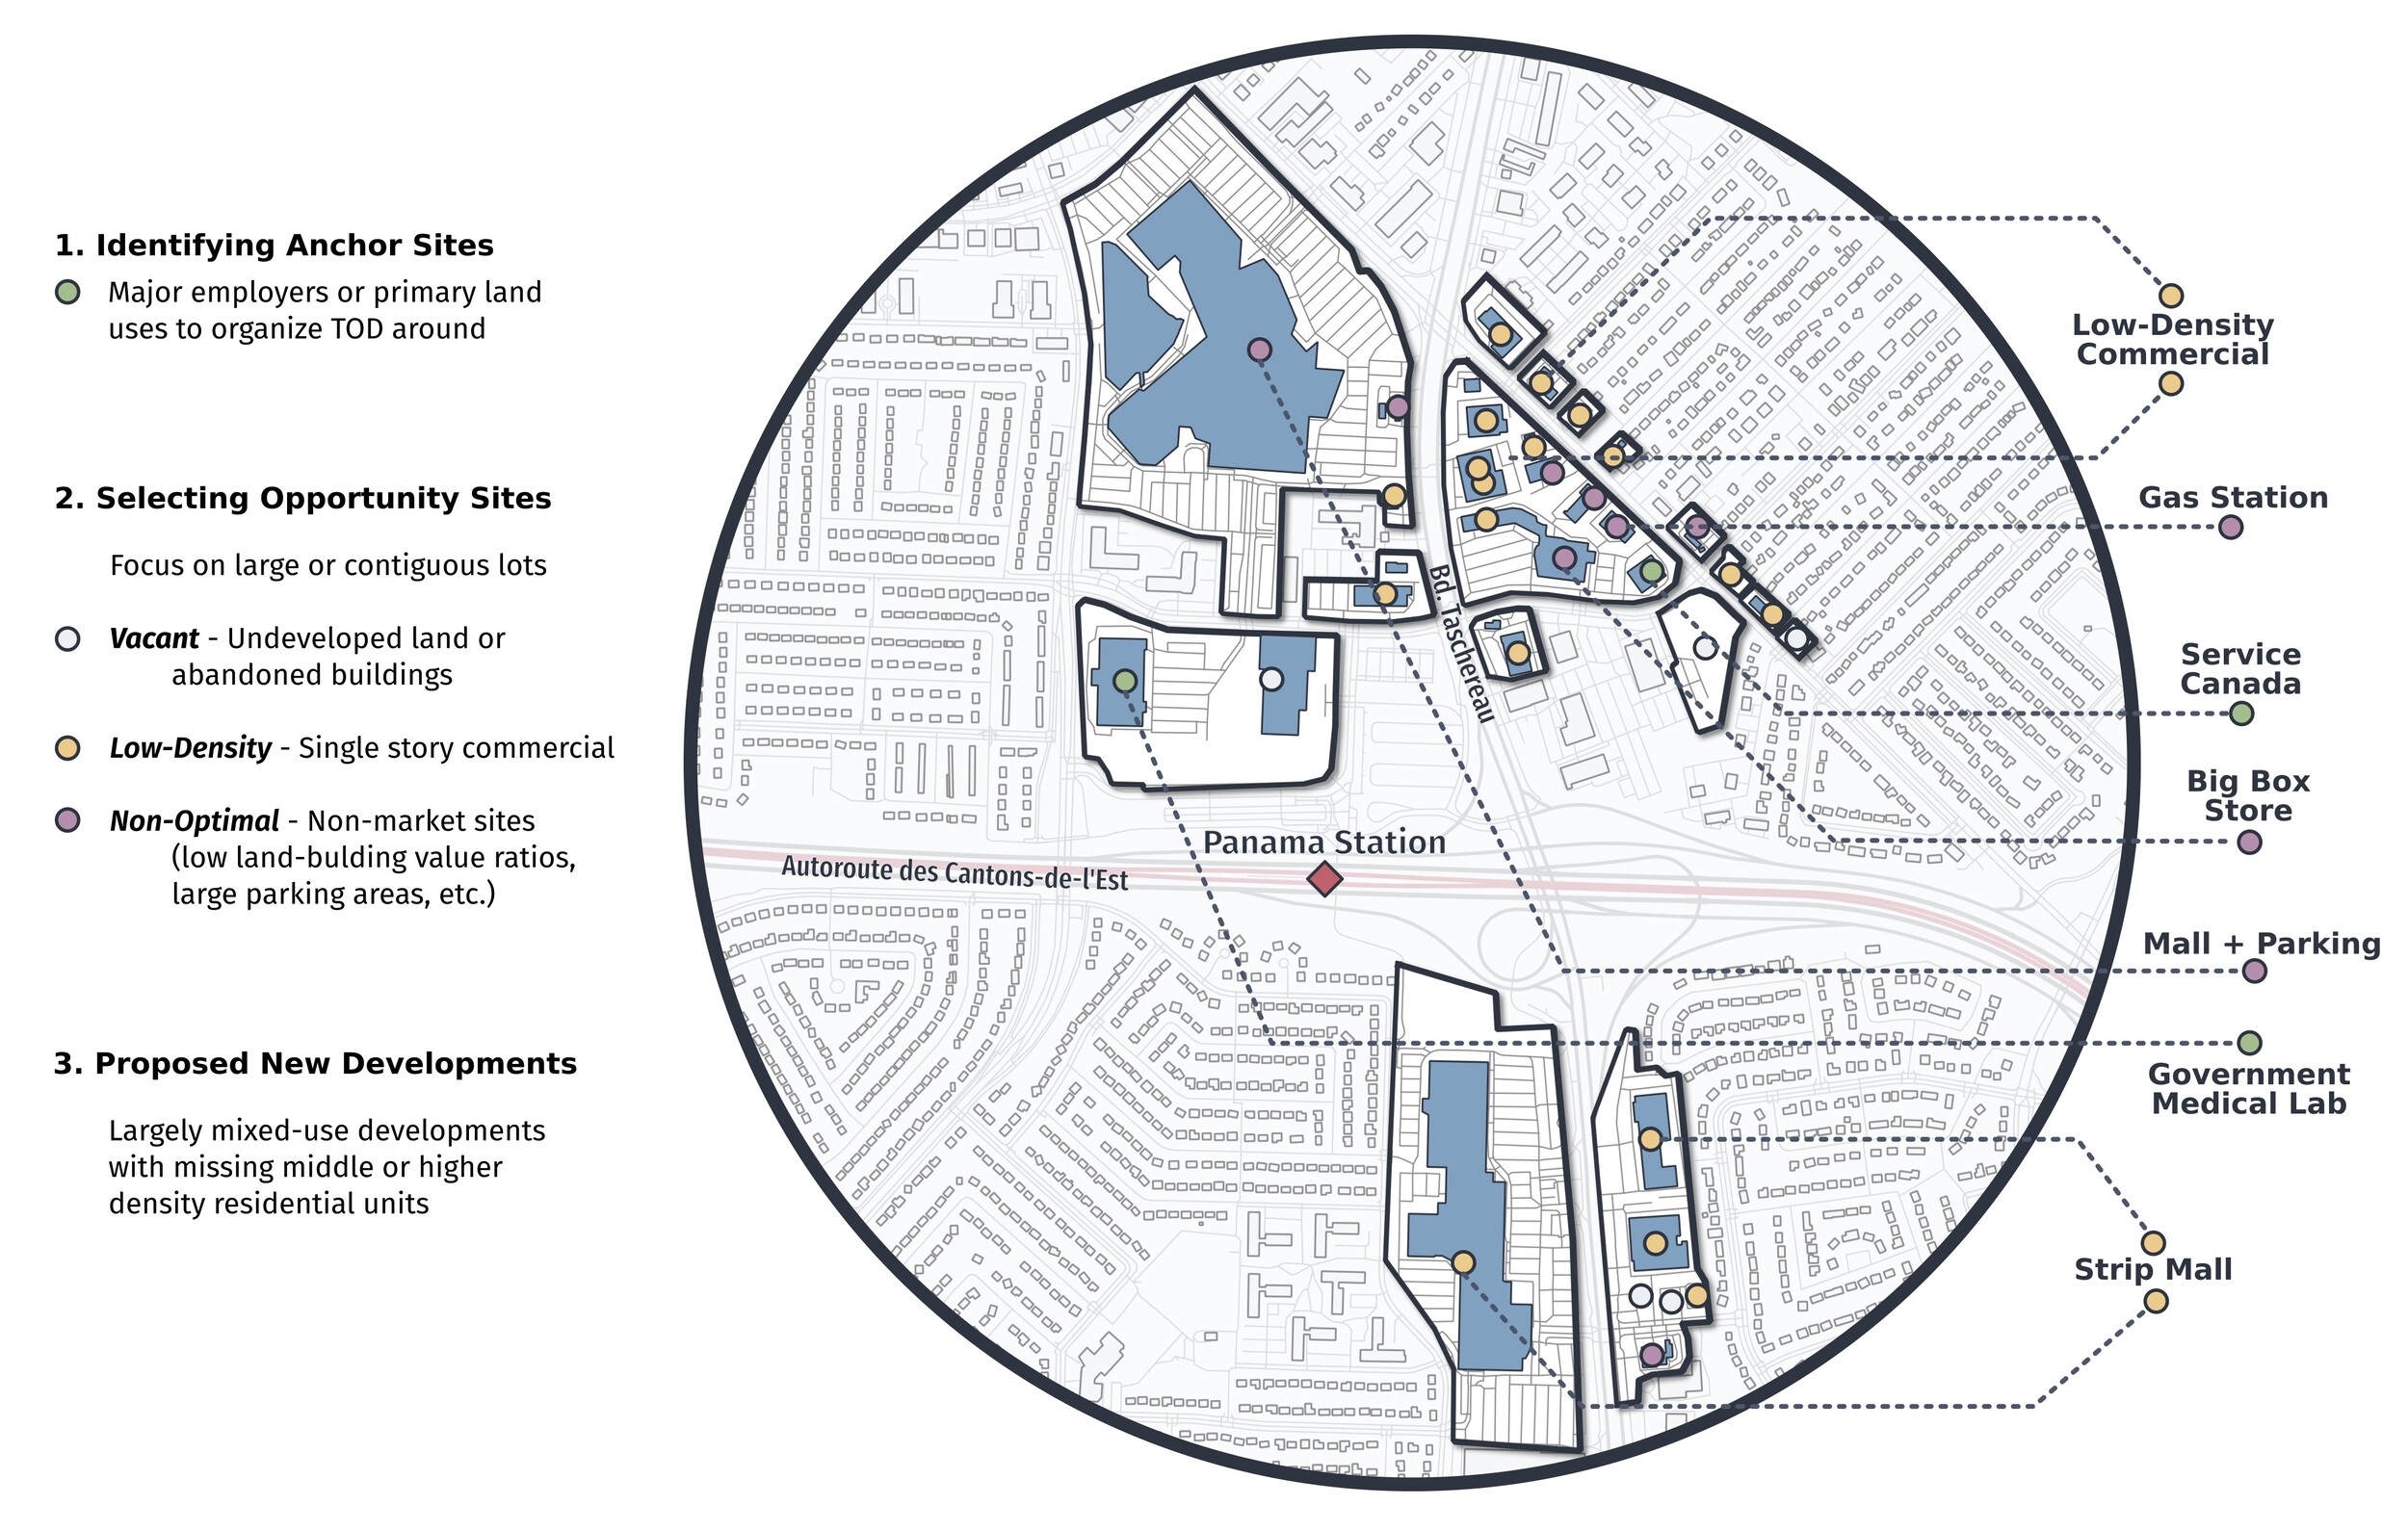
We examine under-developed land near transit stations in five mid-sized Canadian cities: Panama Station (Brossard, QC); Cooksville Station (Mississauga, ON); Northfield Station (Waterloo, ON); McKernan-Belgravia Station (Edmonton, AB); and Arbutus Station (Vancouver, BC). This work is part of a partnership between the University of Toronto, Canadian Urban Institute, and Government of Canada. For each case study, the design team generated development proposals for two scenarios that underwent rigorous design and financial feasibility assessment. Both focus on infill on vacant parcels, with some redevelopment of underutilized parcels. The “trajectory” scenario extends existing development patterns, typically through fewer higher-density developments. The “optimized” scenario addresses regional housing needs and site-specific advantages with more developments and gentle density. Figure 1 shows opportunity site selection around Panama Station, and Table 1 provides key scenario attributes (Supplementary Information A). Though Arbutus Station is under construction, we created a modified GTFS feed including the future subway service for the following accessibility analyses (Supplementary Information B).

We apply Foster-Greer-Thorbecke (FGT) indices (Foster et al. 1984), an established poverty measurement method adapted for transport poverty research (Martens 2017; Karner et al. 2025). We focus on low-income residents’ (Statistics Canada’s low-income cut-off - LICO) access to employment opportunities under each scenario using (FGT-0), which measures the proportion of low-income families below a given access threshold, or the headcount ratio (Supplementary Information C.1.). We calculate scores at the Census Subdivision (CSD) level, equivalent to municipal boundaries (Statistics Canada 2023). To account for varying auto-dependence and regional employment, we calculated FGT-0 scores at multiple thresholds: 1%, 10%, 20%, 30%, 40%, and 50% of median city vehicle employment accessibility (Singer et al. 2024), corresponding with the thresholds shown in Figure 2. Smart and Klein (2020) find, in the similarly auto-oriented US context, that at the 95th percentile of transit accessibility, families without vehicles achieve similar employment outcomes to those with at least one vehicle. Our thresholds span approximately the 95th percentile of transit accessibility in each case study, summarized in Table 2 with additional population and employment accessibility metrics.
We evaluate four scenarios: existing conditions, general growth, and the trajectory and optimized scenarios. For general growth, projected population and employment increases (from the trajectory scenario) are distributed across all CSD dissemination areas proportionally to their current values. We first compute baseline scores using census data to identify populations below the low-income threshold (Statistics Canada 2021) and business register data to measure employment accessibility at the dissemination area (DA) level (Statistics Canada (Business Register Division) (2022); Supplementary Information C.2.). We then geocode the proposed developments and adjust population and employment counts in affected dissemination areas for each scenario. In all cases, new affordable units are assumed to be occupied by low-income households.
3. Findings
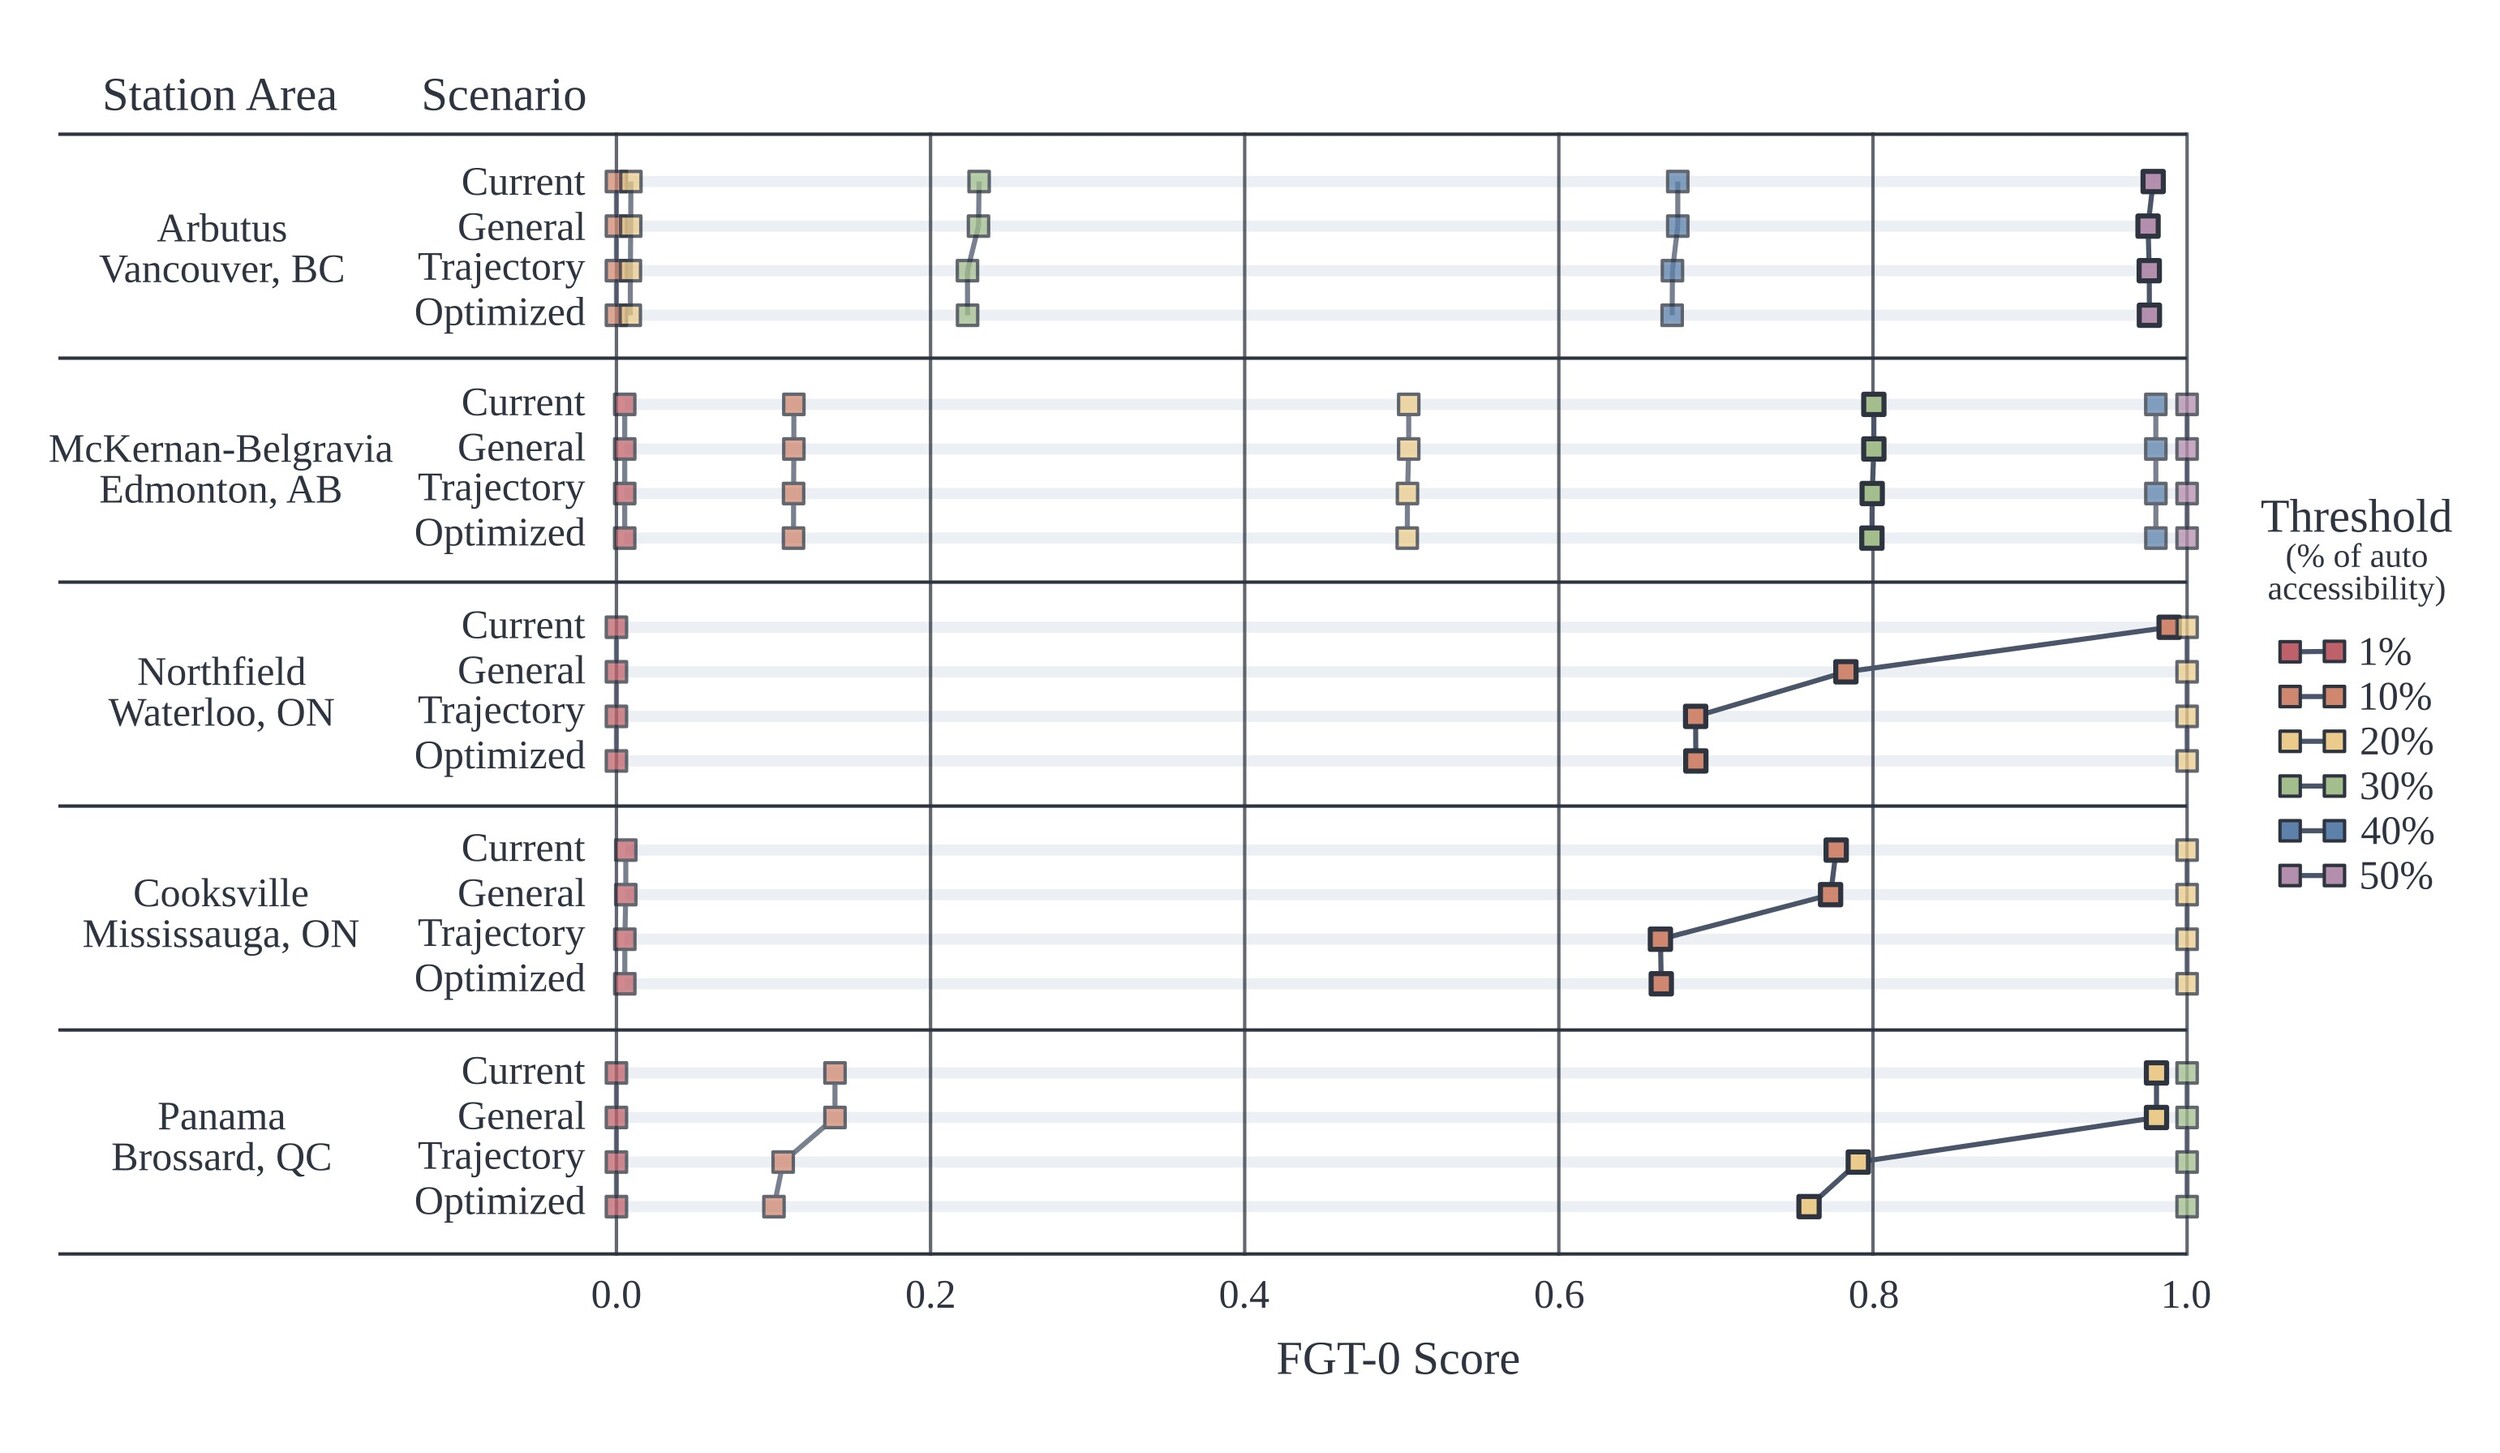
_using_varying_thresholds_relative_to_median_vehicle_accessi.jpg)
Of the five station areas studied, Arbutus and McKernan-Belgravia stations are the only two without significant FGT-0 score decreases (Figure 2). These TODs illustrate potential obstacles in active cores. McKernan-Belgravia has relatively high accessibility but shows little change in FGT-0. The surrounding context is primarily low-density, single-family housing (SFH) with few infill opportunities. As a result, the development proposals concentrate on SFH-to-multiplex conversions. These conversions, providing a 50-75% overall housing increase in the station area, are dispersed across significantly more developments, making it more challenging to create affordable housing minimums. Consequently, LICO units are reduced, covering less than 1% of the existing low-income population.
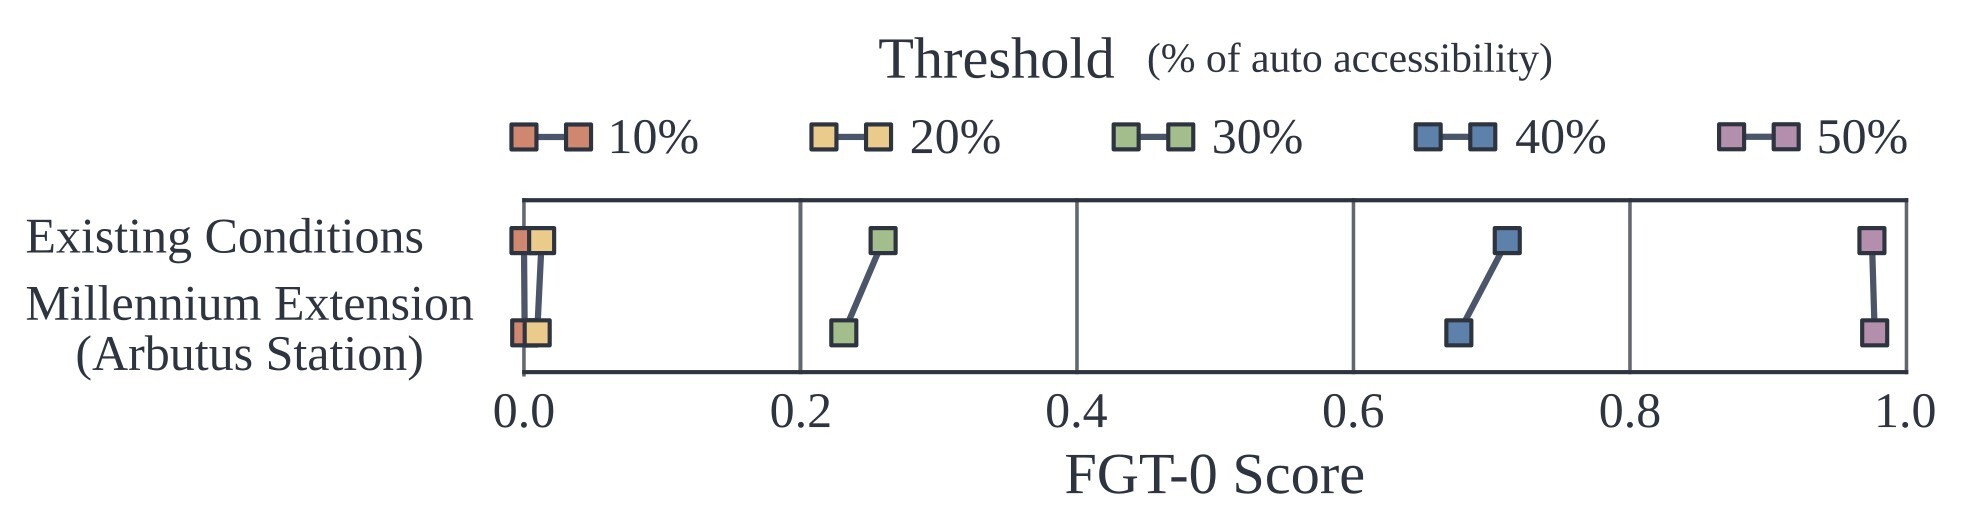
Arbutus has lower infill potential, but higher existing density allows conversions to roughly double the station area population. However, while the raw unit increases are sizeable, the amount of LICO units relative to the existing LICO population combined with the lower station area accessibility ultimately moderates the impact on FGT-0 scores. However, we found that the Millennium line extension itself leads to a sizeable FGT-0 reduction at the 30th- and 40th-percent thresholds (Figure 3).

Northfield, with similarly low access as Arbutus, benefits from its peripheral location with more opportunity sites. The scale of new development in housing and employment increases offsets lower accessibility and generates a roughly 30% reduction in FGT-0. Cooksville and Panama Stations further benefit from suburban contexts in larger metropolitan areas. These sites have both high accessibility (above the 90th-percentile) and numerous larger opportunity sites that allow for significant increases in housing and density. At the approximate 95th percentile of vehicle access, they reduce FGT-0 by about 10% in Mississauga (Cooksville) and nearly 20% in Brossard (Panama).
Within our case studies, high-access sites with many developable parcels have the greatest impact on regional transport poverty, provided they contain substantial affordable housing. Lower accessibility stations may not have the same intrinsic impact, but they can still reduce transport poverty significantly when paired with extensive development and intensification. While stations in the active core may have more obstacles to providing significant impacts, across all case studies, both TOD scenarios match or outperformed the general growth scenario, which produced little measurable change in four of five case studies. Furthermore, these regional impacts arise from a single transit-oriented development in each case study. This suggests that transit-oriented development is not only an effective strategy for addressing transport poverty but a necessary one, with affordable housing provision as a core condition for impact.
Acknowledgements
We would especially like to thank Kathryn Exon Smith for overseeing all the teams and moving components, Chris Higgins for providing the vehicle travel time matrices, and the School of Cities and Canadian Urban Institute for planning and financing the collaboration.