
1. QUESTIONS
With the recent growth in the adoption of electric bicycles and electric scooters (e-micromobility), safety concerns have emerged. As a result, speed limits, often around 25 to 30 km/h, have been imposed on these types of vehicles. This limit is 32 km/h in Quebec, Canada (SAAQ, n.d.). Our study was conducted in Montreal, Canada, where the speed limit for cars is 30 km/h on residential streets, 40 km/h on secondary arterials, and 50 km/h on primary arterials. In some locations, geofencing has been used to limit the speeds of the smaller electric vehicles due to the danger imposed on others (pedestrians principally; (Caggiani et al. 2025)), yet we are unaware of similar applications to cars. From a safe system perspective on traffic danger, it is important to assess the hazard a vehicle creates in terms of kinetic energy (Ederer et al. 2023). Kinetic energy is calculated using the following formula.
Ek=12×m×v2
Where:
Ek = Kinetic energy (J)
m = mass (kg)
v = velocity (m/s)
The calculations below are intentionally conservative, using values for mass on the higher end (e.g., 100 kg for the user and 40 kg for the e-micromobility vehicle). Using equation [1], someone on an e-micromobility vehicle at 25 km/h would create approximately 3,375 joules of kinetic energy. For an average adult (62 kg) and an average urban e-bicycle (roughly 20 kg), the energy would be 1,977 joules (Walpole et al. 2012).
Ek=12×140×(25÷3.6)2=3,375.77J
By contrast, if we consider a compact SUV, the most popular car for purchase in North America (Brazeau 2021), weighing approximately 1,500 kg (Axsen and Bhardwaj 2024) with an average of 1.2 passengers (“EOD23 - Enquête Origine-Destination,” n.d.) weighing 100 kg each (same assumption as e-micromobility), the maximum speed of the car would need to be 7.3 km/h to match the same 3,375 joules considered for the e-micromobility. For a full-size SUV (approximately 2560 kg), the maximum speed would be 5.7 km/h (Hawley 2021).
3,375J=12×((100×1.2)+1,500)×v2→v=2.04ms≈7.3kmh
Therefore, in terms of the hazard imposed on the public, cars pose a bigger threat to pedestrians than e-micromobility. However, anecdotally, the same logic is not applied to both vehicle types when considering the risk to others. This phenomenon, where people are biased toward cars, is referred to as motonormativity (Walker et al. 2023). In this research, we examine whether people apply the same restrictions and justifications to cars and e-micromobility (EM) options.
2. METHODS
This study was conducted using data collected from a survey with respondents from the greater Montreal area, a Canadian city with 4.2 million inhabitants (Government of Canada 2022). Montreal has seen significant growth in the number of cyclists, along with an expansion of cycling infrastructure that is often used by EM users (Montréal n.d.).
The survey was distributed by Leger Opinion. Three trap questions were used to eliminate inattentive respondents; the final sample had 1,532 valid responses. The sample’s representativeness in relation to the Montreal population can be found in Table 1. Given the hard-to-reach nature of people with education below high school, the sample is missing respondents from this group.
Respondents were randomly assigned to one of two treatments: (i) EM or (ii) car. Statistical analysis confirmed that the samples were not different in terms of income, age, education, and gender. A question on their support for increased bike, rail, bus, walking or car infrastructure further ensured that the general opinions on travel modes were similar between treatments. Respondents from both treatments were then asked whether the speed of (i) e-scooters/e-bikes or (ii) cars should be limited in areas where there are pedestrians. Respondents then chose from a multiple choice list the reason(s) they believe the speed of the relevant mode should or should not be limited. The two treatments’ responses were then compared using Welch Two-Sample T-tests and Chi-squared tests.
3. FINDINGS
The results, as well as their statistical significance, are shown in Table 2. First, in both groups the vast majority said that speed limits were required (82% EM, 80% car), highlighting that a super majority of the population supports limiting speeds where there are pedestrians. However, the participants were statistically more likely to support no speed limits for cars (12.4%) than for EM (6.7%). For both the “yes, limit” and the “no limit” groups in either experimental group, the majority do not believe that travel time is more important than safety. These findings suggest that this population supports limiting the hazard even if speeds would need to be limited."
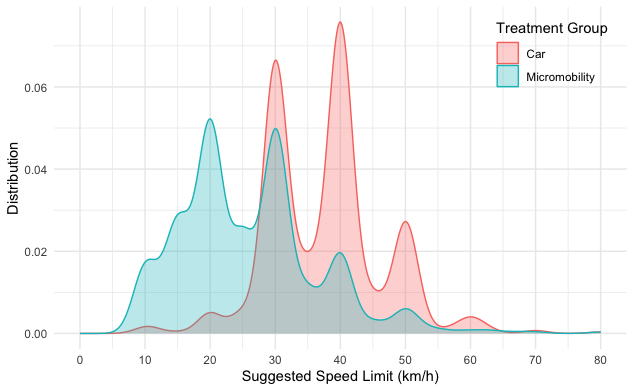
Further, the average speed limit suggested by respondents differed significantly (p<0.001) between EM (26.0 km/h) and cars (37.6 km/h). At these speeds, 3,650 J of kinetic energy is produced by EM and 88,720 J for the car, indicating that cars would produce ~24 times more kinetic energy than the EM alternative. Figure 1 shows the distribution of suggested speed limits across the two treatments, with responses in the car condition clustered around the current Montreal speed limits of 30, 40 and 50 km/h. We conclude that speeds allowed for different transportation modes are more in line with norms, rather than the hazards they impose. We also find a statistically significant difference, where more respondents are unsure whether the speed of EM (11.2%) should be limited compared to cars (8%).
Among respondents who supported speed limits, nearly all the EM sample (88.2%) indicated that danger to others was important to consider, compared to 61.4% in the car sample. Additionally, more than half (53.3%) of the EM sample indicated danger to self as being relevant, compared to a quarter (24.4%) of the sample for cars. Consequently, EM is viewed as more dangerous than cars for oneself in a collision, a legitimate perception considering the numerous safety features of cars designed to protect the people inside the cabin. From a public health point of view, limiting the speed of cars because of their impact on others would be more coherent, considering the kinetic energy, while limiting EM speed because of the danger faced by its users is reasonable.
Among respondents indicating speeds should not be limited, the vast majority in both samples (82.4% EM; 89.5% car; not statistically different) indicated that the users only need to follow the current speed limit. For personal safety-related restrictions, statistically, more people (21.6%) of the EM group, compared to the car group (8.4%), justify this by saying that it is the user’s choice, even if they are endangering themselves. For travel time being more important than safety, only 2% of the EM and 4.2% of the car sample agreed with this. The key takeaways are thus: a) these individuals are more about following the rules regardless of safety considerations; b) a minority believe that it is an individual’s choice to take personal risks; c) even for this group, convenience (e.g., not limiting speeds, saving time) was not seen as a justification.
Finally, those who answered that they do not know if the speed should be limited had no significant differences between the EM group and the car group. Nevertheless, when asked what should be considered when deciding whether to limit speeds, the majority in both groups (66.3% EM; 52.5% car; not statistically significant) indicated that the danger it creates for others should be considered.
ACKNOWLEDGMENTS
Ethics approval from Polytechnique’s ethics board CER-2526-07-D. Funding to support this research comes from NSERC project ALLRP 577172-2022, Social Sciences and Humanities Research Council (SSHRC) Canada Graduate Scholarship-Master’s (CGS M), Fonds de recherche du Québec - Nature et technologies (FRQNT, Québec, Canada; https://doi.org/10.69777/323357), Mitacs (052279), Hydro-Québec (Excellence scholarship), and Fonds de recherche du Québec – Nature et Technologie (FRQNT, Doctoral Research Scholarship, https://doi.org/10.69777/367986).