1. QUESTIONS
E-bikes have become increasingly popular and are seen as an important instrument for achieving sustainable mobility goals. At the same time, concerns have been raised that increased e-bike use may lead to a higher injury risk than that observed for conventional bicycles (DiMaggio et al. 2020). Some empirical evidence appears to support such concerns. A study from Switzerland reported a higher injury risk for e-bikes compared with conventional cycling (Hertach et al. 2018). Higher average speeds, greater vehicle mass, and the attraction of less experienced cyclists have been suggested as possible explanations (Fyhri et al. 2019).
However, under the Norwegian and European regulatory framework, motor assistance for e-bikes is limited to 25 km/h, and differences in typical speeds and weights between e-bikes and conventional bicycles are relatively modest (Flügel et al. 2019). Several studies that account for exposure have therefore found little or no difference in risk. A study based on emergency department data controlling for distance travelled found no overall risk difference (Schepers et al. 2018), while survey data from Norway indicated an increased injury risk among women but not among men (Fyhri et al. 2019).
Reliable risk estimates for cycling are difficult to obtain. Bicycle accidents are substantially underreported in police statistics, as most incidents are single-vehicle crashes (Shinar et al. 2018). Self-reported accident data are subject to recall bias and severity-dependent reporting. Hospital records therefore provide a commonly used and policy-relevant outcome measure, capturing injuries requiring medical treatment (Bjørnskau et al. 2025). While hospital data have frequently been used to compare injury severity between e-bike and conventional bicycle crashes, most studies lack exposure data and report mixed findings (DiMaggio et al. 2020; Siman-Tov et al. 2017).
The present study addresses this limitation by combining representative travel survey data with emergency ward admissions from Oslo, Norway, allowing a direct comparison of mileage-adjusted injury risk. The study asks: What is the injury risk for e-bikes relative to that of conventional bicycles?
2. METHODS
We use injury data collected in the year 2023 in Oslo, Norway. Data derives from a short, structured form that nurses at the ward fill in when patients arrive, just prior to receiving treatment. In addition to information about bike type, gender, age and place of accident, injury severity (AIS) is recorded. In the database there were 2241 cases involving cyclists. We removed any accidents that had taken place outside of the Oslo city borders (N=214) and accidents happening with children under the age of 13 (N=412), and accidents were type of bike was not recorded (N=30) resulting in a final sample of 1585 cases.
Travel behaviour data were obtained from the Norwegian National Travel Behaviour Survey (NTBS), a continuous survey in which respondents report all trips made on the previous day, along with background information on travel resources and sociodemographic characteristics. The survey is primarily web-based (90%), with the remainder conducted by telephone, and includes approximately 40,000 respondents annually, supplemented by local or regional booster samples. Data are anonymised, quality assured, and weighted by age, gender, and county prior to dissemination. Exposure is measured as distance travelled, the most commonly used metric in bicycle safety research (Vanparijs et al. 2015).
Although the overall sample size is large, the number of cycling trips is relatively small when disaggregated by mode and period. We therefore pooled data from 2022 and 2023 for the Oslo municipal area to obtain sufficiently stable exposure estimates.
The pooled sample comprised 8,411 respondents who reported 1,696 cycling trips, of which 618 were made by e-bike and 1,078 by conventional bicycle. Mean trip length was 5.55 km for e-bikes and 5.31 km for conventional bicycles. These estimates were used to calculate total monthly kilometres travelled by e-bike and conventional bicycle for the Oslo population aged 13 years and older (N ≈ 630,000).
3. FINDINGS
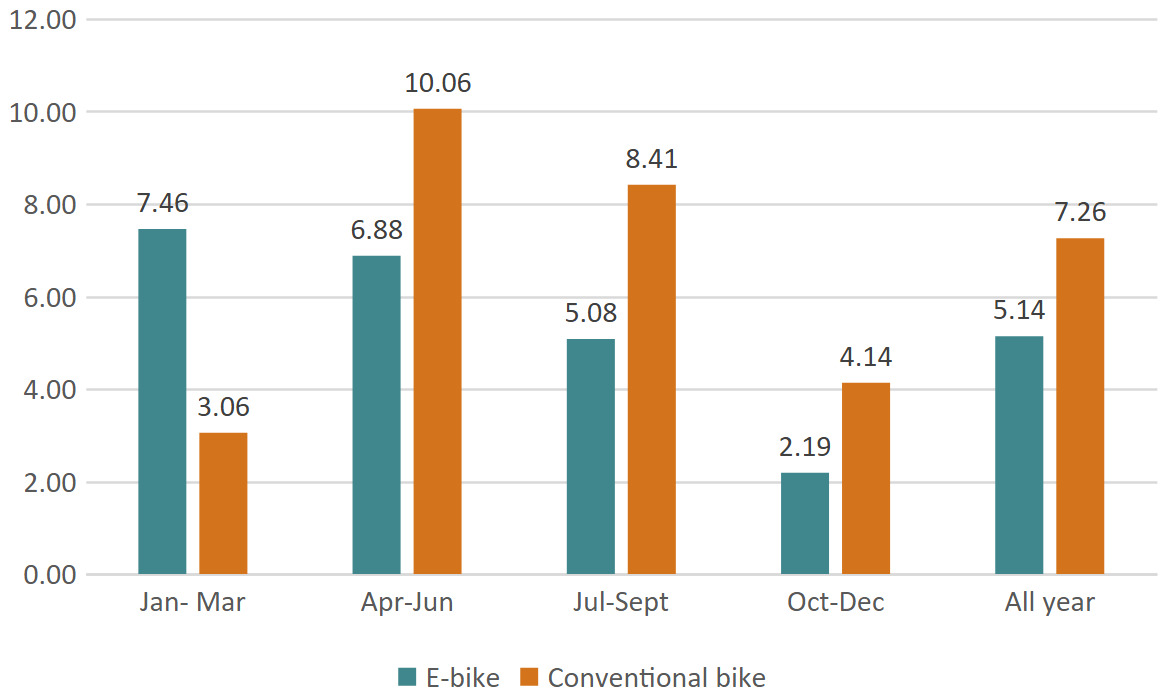
Table 1 shows the number of reported injuries and population-estimated kilometres travelled by quarter and bicycle type. Conventional bicycles account for more than twice as many injuries as e-bikes, despite less than twice the distance travelled, indicating a higher exposure-adjusted injury risk. This pattern is observed in three of the four quarters, with the exception of the winter months (January–March), when injury risk is higher for e-bikes.
Figure 1 illustrates the seasonal pattern of injury risk by quarter. Overall injury risk is lower for e-bikes (5.14) than for conventional bicycles (7.26). The elevated risk for conventional bicycles is present in spring, summer and autumn, whereas e-bikes show a higher risk during the winter period.

As exposure was estimated using pooled travel survey data from two years and given that e-bike ownership is increasing, a sensitivity analysis was conducted by increasing estimated e-bike kilometres by 10%. This adjustment had negligible effects on the incidence rate ratios, indicating robustness to moderate exposure uncertainty.
Overall, the data indicate that injury risk for e-bikes is lower than that of conventional bicycles, except for in the winter months. To our knowledge, no previous study has demonstrated a lower mileage-adjusted injury risk for e-bikes than for conventional bicycles. Future research should examine whether the observed seasonal variation—particularly the higher winter risk for e-bikes—is driven by low exposure levels, winter riding conditions, or differences in trip purpose between e-bikes and conventional bicycles.
ACKNOWLEDGMENTS
Language editing was assisted by ChatGPT (version 5.2).