This website uses cookies

We use cookies to enhance your experience and support COUNTER Metrics for transparent reporting of readership statistics. Cookie data is not sold to third parties or used for marketing purposes.

Skip to main content
null
Findings
  • Menu
  • Articles
    • Energy Findings
    • Resilience Findings
    • Safety Findings
    • Transport Findings
    • Urban Findings
    • All
  • For Authors
  • Editorial Board
  • About
  • Blog
  • search
  • X (formerly Twitter) (opens in a new tab)
  • LinkedIn (opens in a new tab)
  • RSS feed (opens a modal with a link to feed)

RSS Feed

Enter the URL below into your favorite RSS reader.

http://localhost:11252/feed
ISSN 2652-8800
Safety Findings
February 05, 2026 AEST

Pedestrian Interactions at Signalized Intersections: Comparison between two Traffic Signal Phasing Types in Montreal and Quebec City, Canada

Philippe Brodeur-Ouimet, M.D., Marie-Soleil Cloutier, Ph.D, Hugo Quintin, M.D., Ugo Lachapelle, Ph.D,
road safetypedestrianstraffic conflictsintersectionstraffic signal phasing
Copyright Logoccby-sa-4.0 • https://doi.org/10.32866/001c.155978
Findings
Brodeur-Ouimet, Philippe, Marie-Soleil Cloutier, Hugo Quintin, and Ugo Lachapelle. 2026. “Pedestrian Interactions at Signalized Intersections: Comparison between Two Traffic Signal Phasing Types in Montreal and Quebec City, Canada.” Findings, ahead of print, February 4. https:/​/​doi.org/​10.32866/​001c.155978.
Download all (2)
  • Figure 1. Non-participatory Observations of Pedestrian Crossing (movement along the blue line) while road users were moving along the red line.
    Download
  • Figure 2. Percent of traffic interactions crossing for each intersection and by phasing type
    Download

Sorry, something went wrong. Please try again.

If this problem reoccurs, please contact Scholastica Support

Error message:

undefined

View more stats

Abstract

Studies have established that collisions and traffic conflicts are influenced by the built environment and individual characteristics. However, few studies have examined the influence of traffic signal phasing types on these outcomes, especially for pedestrians. This article aims to evaluate pedestrian-drivers interactions considering intersection designs and traffic signal in two cities with different phasing. A mixed effect logistic regression model based on pedestrian crossings observation (n = 1998) at 18 intersections in Montreal and Quebec City (Canada) reveals that traffic signal phasing configuration, vehicle volume, speed limits and the use of mobility assistance are key factors influencing the occurrence of traffic conflicts.

1. Questions

Many past studies have revealed built and road environment factors leading to pedestrian collisions. These include motor vehicles and pedestrians volume, posted speed and street width (Dumbaugh and Rae 2009; Dumbaugh and Zhang 2013; Merlin et al. 2019; Miranda-Moreno et al. 2011; Osama and Sayed 2017). As for individual characteristics, young adults, children, elderly, people with physical limitations and intoxicated people are overrepresented in collisions (Dumbaugh and Rae 2009; Dumbaugh and Zhang 2013; Dai 2012; Ukkusuri 2012). Pedestrian collisions are also more frequent at intersections (Dumbaugh and Rae 2009; Ukkusuri 2012). Traffic signal configuration is thus considered as playing a major role in the prevention of pedestrian collisions. Recent research looking at traffic signal phasing configurations found that lead pedestrian intervals and fully protected phasing seem effective at reducing pedestrian collisions (Fayish and Gross 2010; Houten 2000; Saneinejad and Lo 2015; Stipancic 2020; Zhang 2015).

From a methodological standpoint, collision data are scarce and require many years to collect to offer a representative outlook of collision circumstances (Langbroek 2012; Miranda-Moreno et al. 2007; Theofilatos 2016; Zheng et al. 2014). As such, observed traffic conflict data are useful data for a proactive consideration of road safety issues (Cloutier and Lachapelle 2017; Hydén 1987). The objective of this article is thus to compare two types of traffic signal phasing configuration in two cities with different approaches, controlling for other factors typically associated with traffic interactions with pedestrians at intersections. We expect fully protected phasing to be more effective.

2. Methods

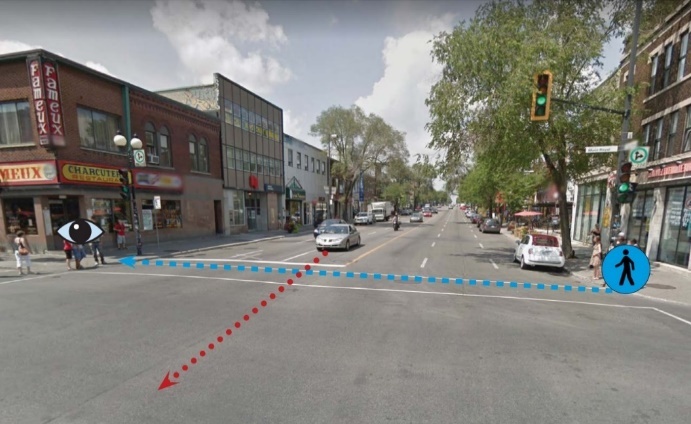
To collect traffic interactions between pedestrians and motor vehicles at intersections, we used a validated non-participatory observation protocol (Cloutier and Lachapelle 2017; Tom and Granié 2011). Figure 1 illustrates the role of the observer (on the left side of the crossing) in determining if the pedestrian (in blue), walking towards the observer, was involved in at least one traffic interaction during his/her crossing. A traffic interaction was recorded when the trajectory of the pedestrian intersected with the perpendicular trajectory of a moving motor vehicle road user (red line in Figure 1), and the distance between the two was estimated by observers to be 2 meters or less.

Figure 1
Figure 1.Non-participatory Observations of Pedestrian Crossing (movement along the blue line) while road users were moving along the red line.

During data collection, the observer also recorded sociodemographic information on the pedestrian (estimated age group, gender, physical limitation/mobility aid). For each intersection, some characteristics were recorded (one-way, posted speed limit) and volume data from the city open-access dataset were also included in the final dataset. At each intersection, 10 observations were made by two observers to validate interrater reliability with Kappa tests.

The data collection took place during the summer of 2019 on weekdays during three time slots (8-11 AM, 11:30-2:30 PM and 3-6 PM), simultaneously at intersections in Montreal and Quebec City, two cities that use different traffic signal phasing configurations. The City of Montreal mostly uses lead pedestrian intervals, where pedestrians have a head start of a few seconds over vehicles making a turn. Quebec City mostly uses exclusive pedestrian traffic signal phasing, where vehicles are immobilized except for right turn on red light that is permitted at some intersections in Quebec City and forbidden everywhere in Montreal (Quintin et al. 2021). Eighteen intersections (10 in Montreal and 8 in Quebec City) were randomly selected from all intersections with traffic signals in both cities. Selected intersections come from four clusters resulting from a k-means classification computed with 5 variables: presence of a street with a speed limit of 40 km/h or less, number of collisions in a 50 m buffer, presence of a transit stop and population density in a 500 m buffer.

We estimated the relationship between the occurrence of an interaction in a crossing and both individual and intersection-level variables, with our key variable being the type of traffic signal phasing embedded in each city. Table 1 presents the variables included in the model. Using Stata 17, a mixed effect logistic regression was conducted to account for random effects of intersection-level variables (presence of a one-way street, speed limit, pedestrian volume, and motor vehicle volume), fixed effects at the individual level (gender, age group and mobility aid) and our key traffic signal phasing type variable. This variable mostly captures phasing type but could also represent other unobserved differences between cities.

Table 1.Variables description
Variables Description
Traffic signal phasing Partially protected pedestrian phase (Montreal)
Fully protected pedestrian phase (Quebec)
One-way street 1 if at least one street at the intersection is one-way; 0 if all streets are two-ways.
Speed limit Average of the posted speed limits on streets at the intersection.
Pedestrian volume Number of pedestrians counted during peak hours (7–10 AM and 3–6 PM) at the intersection, divided by 100.
Motor vehicle volume Number of motor vehicles counted during peak hours (7–10 AM and
3–6 PM) at the intersection, divided by 1000.
Gender Based on the observer’s: men; women or others/don’t know
Age group Based on the observer’s: young (including children, teenagers and young adults); adults; elderly
Mobility aid A person with canes, crutches, walkers, etc.

3. Findings

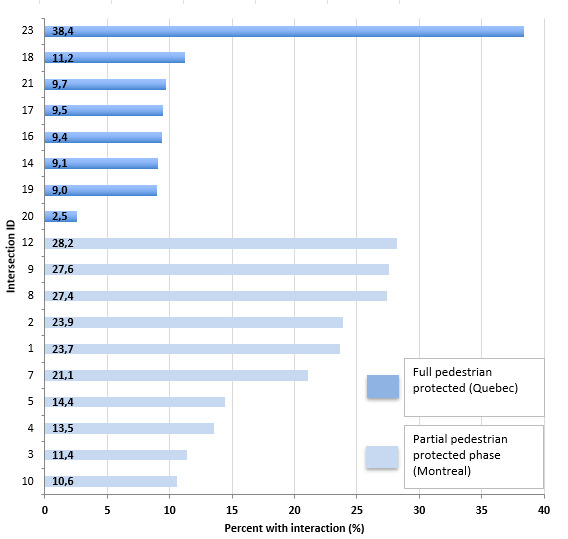
In our sample, 17% of observed crossings involved a traffic interaction between a pedestrian and a motor vehicle (Table 2). The sample is evenly distributed across genders (51% of women) and the adults were the most represented age group (65%), followed by youth (24%) and the elderly (11%). Only 2% of observed pedestrians were using mobility aids. Fully protected pedestrian phasing in Quebec accounts for 38% of observed crossings. Figure 2 shows that we observed far more traffic interactions in Montreal compared to Quebec City and that traffic interaction shares per intersections are more similar within Quebec City (around 9%) than within Montreal (between 10.5% and 28.2%). There are, however, two exceptions in Quebec City where much higher (38%) and much lower (3%) traffic interaction rates are found. The first intersection links an eco-neighborhood, a development that seeks to minimize environmental impact and improve living environment, to a shopping center via a boulevard with bus stops nearby, and the second connects two multilane roads in a low-density neighborhood. We have no strong explanation for these discrepancies based on the available data.

Table 2.Descriptive statistics
Variable Proportion or mean Std. dev. Min Max
Traffic interaction (y) 0.17 0.38 0 1
Individual level
Women 0.51 0.50 0 1
Age group
Youth 0.24 0.43 0 1
Adults 0.65
Elderly 0.11 0.31 0 1
Mobility aid 0.02 0.14 0 1
Key policy variable
Fully protected pedestrian phasing (Quebec City) 0.38 0.49 0 1
Intersection Level
Pedestrian volume (/100) (μ) 25.54 25.47 1.6 83.54
Vehicle volume (/1000) (μ) 10.37 5.59 0.33 23.96
One way street 0.68 0.47 0 1
Speed limit (μ) 43.15 6.63 30 50
Figure 2
Figure 2.Percent of traffic interactions crossing for each intersection and by phasing type

The mixed effect logistic regression model (Table 3) shows a significant inter-class correlation (ICC) of 0.3, meaning that a multilevel model is pertinent and that 30% of the variance in the occurrence of a traffic interaction is explained by the intersection-level variables and the intersection-level random effect. The key policy variable, represented by the fully protected crossing in Quebec, decreased the odds ratio of a traffic interaction by 66.1% compared to the partially protected phasing (OR: 0.339; p=0.002). At the intersection level, an increase of 1000 vehicles per day surprisingly decreased the odds of a traffic interaction by 6.6% (OR: 0.934; p< 0.001). We explain this counter-intuitive result by hypothesizing that intersections with higher vehicle volumes are generally larger, which decreases the perceived safety and leads to more cautious behavior among both drivers and pedestrians. On the other hand, an increase of 1 km/h in the average posted speed limit at the intersection increases the odds of a traffic interaction by 5.3% (OR: 1.053; p=0.036). At the individual level, gender and age group aren’t statistically significant, but the use of mobility aid increases by 2.2 times the odds of being involved in a traffic interaction (OR: 2.205; p=0.036).

Table 3.Mixed effect logistic regression of traffic interactions between pedestrians and vehicles at intersections
Odds ratio Std. err. P>z [95% conf. interval]
Individual level
Women 1.104 0.134 0.417 0.869 1.401
Age group
Youth 0.915 0.140 0.561 0.679 1.234
Adults [Ref.]
Elderly 1.037 0.212 0.860 0.694 1.549
Mobility aid 2.205 0.832 0.036 1.053 4.621
Key policy variable
Fully protected pedestrian phasing (Quebec City) 0.339 0.118 0.002 0.171 0.672
Intersection Level
Pedestrian volume (/100) 1.009 0.005 0.090 0.999 1.019
Vehicle volume (/1000) 0.934 0.019 0.001 0.897 0.973
One way 0.752 0.170 0.208 0.483 1.172
Speed limit 1.053 0.026 0.036 1.003 1.104
Constant 0.058 0.050 0.001 0.011 0.314
var(_cons) 0.101 0.056 0.034 0.299
 
Observations 1998
Number of groups 18
Obs. per groups
min 64
avg 111
max 163
Log likelihood 880.47675
Wald chi2(9) 33.06 Prob>chi2 0.0001
Intra class correlation 0.3

Fully protected pedestrian phase in Quebec City are associated with reduced traffic interactions by more than half when considering all other intersections and individual-level variables. Once considering traffic signal phasing, other built environment characteristics at the intersection level are more important predictors of traffic interactions involving a pedestrian than individual level characteristics, but variance between intersections is quite important. This suggests that who crosses and other features of the environment drive part of the observed outcome. Pedestrians using mobility aid seem at greater risk of interactions and would need to be analyzed in further detail. Other factors could lead to a better understanding of the occurrence of traffic interactions at intersections, including, for example, waiting time for pedestrians and dangerous behaviors by drivers. Differences in interactions based on phasing type warrant an exploration of actual collision risks based on these phasing types.


Acknowledgements

We thank the students involved in collecting the data over the summer of 2019, the NGO Accès Transports Viables with whom we received funding from Mitacs (Project IT12315), and the INRS Summer Internship program that provided additional funding for this project.

Submitted: November 11, 2025 AEST

Accepted: January 29, 2026 AEST

References

Cloutier, M. S., and U. Lachapelle. 2017. “‘Outta My Way!’ Individual and Environmental Correlates of Interactions between Pedestrians and Vehicles during Street Crossings.” Accid Anal Prev 104: 36–45. https:/​/​doi.org/​10.1016/​j.aap.2017.04.015.
Google Scholar
Dai, D. 2012. “Identifying Clusters and Risk Factors of Injuries in Pedestrian–Vehicle Crashes in a GIS Environment.” J Transp Geogr 24: 206–14. https:/​/​doi.org/​10.1016/​j.jtrangeo.2012.02.005.
Google Scholar
Dumbaugh, E., and R. Rae. 2009. “Safe Urban Form: Revisiting the Relationship Between Community Design and Traffic Safety.” J Am Plann Assoc 75 (3): 309–29. https:/​/​doi.org/​10.1080/​01944360902950349.
Google Scholar
Dumbaugh, E., and Y. Zhang. 2013. “The Relationship between Community Design and Crashes Involving Older Drivers and Pedestrians.” J Plan Educ Res 33 (1): 83–95. https:/​/​doi.org/​10.1177/​0739456X12468771.
Google Scholar
Fayish, A. C., and F. Gross. 2010. “Safety Effectiveness of Leading Pedestrian Intervals Evaluated by a Before-after Study with Comparison Groups.” Transp Res Rec 2010: 15–22.
Google Scholar
Houten, R. 2000. “Field Evaluation of a Leading Pedestrian Interval Signal Phase at Three Urban Intersections.” Transp Res Rec J Transp Res Board 1734 (1): 86–92. https:/​/​doi.org/​10.3141/​1734-13.
Google Scholar
Hydén, C. 1987. “The Development of a Method for Traffic Safety Evaluation: The Swedish Traffic Conflicts Technique.” Bull Lund Inst Technol Dep, no. 70.
Google Scholar
Langbroek, J. 2012. “Analyzing Interactions between Pedestrians and Motor Vehicles at Two-Phase Signalized Intersections–an Explorative Study Combining Traffic Behaviour and Traffic Conflict Observations in a Cross-National Context.” In Proceedings of 25th ICTC.
Google Scholar
Merlin, L. A., E. Guerra, and E. Dumbaugh. 2019. “Crash Risk, Crash Exposure, and the Built Environment: A Conceptual Review.” Accident, 105244. https:/​/​doi.org/​10.1016/​j.aap.2019.07.020.
Google Scholar
Miranda-Moreno, L. F., A. Labbe, and L. Fu. 2007. “Bayesian Multiple Testing Procedures for Hotspot Identification.” Accid Anal Prev 39 (6): 1192–201. https:/​/​doi.org/​10.1016/​j.aap.2007.03.008.
Google Scholar
Miranda-Moreno, L. F., P. Morency, and A. M. El-Geneidy. 2011. “The Link between Built Environment, Pedestrian Activity and Pedestrian–Vehicle Collision Occurrence at Signalized Intersections.” Accid Anal Prev 43 (5): 1624–34. https:/​/​doi.org/​10.1016/​j.aap.2011.02.005.
Google Scholar
Osama, A., and T. Sayed. 2017. “Macro-Spatial Approach for Evaluating the Impact of Socio-Economics, Land Use, Built Environment, and Road Facility on Pedestrian Safety.” Can J Civ Eng 44 (12): 1036–44. https:/​/​doi.org/​10.1139/​cjce-2017-0145.
Google Scholar
Quintin, H., M. S. Cloutier, and O. Waygood. 2021. “Sécurité vécue et perçue par les piétons aux intersections signalées : comparaison entre l’environnement bâti, routier et le phasage des feux à Montréal et Québec, Canada.” RTS Rech Transp Sécurité 2021 (October): 13.
Google Scholar
Saneinejad, S., and J. Lo. 2015. “Leading Pedestrian Interval: Assessment and Implementation Guidelines.” Transp Res Rec 2519 (1): 85–94. https:/​/​doi.org/​10.3141/​2519-10.
Google Scholar
Stipancic, J. 2020. “Pedestrian Safety at Signalized Intersections: Modelling Spatial Effects of Exposure, Geometry and Signalization on a Large Urban Network.” Accid Anal Prev 134. https:/​/​doi.org/​10.1016/​j.aap.2019.105265.
Google Scholar
Theofilatos, A. 2016. “Predicting Road Accidents: A Rare-Events Modeling Approach.” Transp Res Procedia 14: 3399–405. https:/​/​doi.org/​10.1016/​j.trpro.2016.05.293.
Google Scholar
Tom, A., and M. A. Granié. 2011. “Gender Differences in Pedestrian Rule Compliance and Visual Search at Signalized and Unsignalized Crossroads.” Accid Anal Prev 43 (5): 1794–801. https:/​/​doi.org/​10.1016/​j.aap.2011.04.012.
Google Scholar
Ukkusuri, S. 2012. “The Role of Built Environment on Pedestrian Crash Frequency.” Saf Sci 50 (4): 1141–51. https:/​/​doi.org/​10.1016/​j.ssci.2011.09.012.
Google Scholar
Zhang, Y. 2015. “Safety Effects of Exclusive and Concurrent Signal Phasing for Pedestrian Crossing.” Accid Anal Prev 83: 26–36. https:/​/​doi.org/​10.1016/​j.aap.2015.06.010.
Google Scholar
Zheng, L., K. Ismail, and X. Meng. 2014. “Traffic Conflict Techniques for Road Safety Analysis: Open Questions and Some Insights.” Can J Civ Eng 41 (7): 633–41. https:/​/​doi.org/​10.1139/​cjce-2013-0558.
Google Scholar

Powered by Scholastica, the modern academic journal management system