1. QUESTIONS
Traffic deaths increased in the US during the 2010s while continuing to decrease in most other high-income countries (International Transport Forum 2022; Badger and Parlapiano 2022). US traffic fatality rates increased the most in large cities (defined here as the 100 most populous US cities in 2020), hindering progress toward a vision of zero deaths in the US transportation system (USDOT 2022; Shahum 2016). Comparing 2008-2012 with 2018-2022, the annual traffic fatality rate per 100,000 people increased by more than 33% across the 100 largest US cities (from 6.97 to 9.28) but less than 5% in all other parts of the country (from 12.03 to 12.59) (NHTSA 2025). Fatality Analysis and Reporting System (FARS) data show similar results when 2020 is excluded. The trend started prior to the COVID-19 pandemic and continued into the 2020s.
We ask the following questions: How did large-city fatality rates change by neighborhood income level, transportation mode, hour of week, and roadway classification between 2008-2012 and 2018-2022? What city-level characteristics were associated with large city fatality rates in 2008-2012 and 2018-2022?
2. METHODS
We downloaded all 544,908 US traffic fatalities reported during 2008-2022 from the FARS database and identified fatalities in each of the 100 largest cities from FARS city codes (NHTSA 2025). FARS included information about time of crash, roadway classification, and travel mode of persons killed. We calculated five-year fatality averages to compare 2008-2012 with 2018-2022, and we normalized city fatality counts by US Census population in 2010 and 2020 to represent the exposure of the entire community to traffic fatalities during each study period (Appendix A).
We gathered 2008-2012 and 2018-2022 median household income, household vehicle ownership, and median age of housing from the American Community Survey (ACS) for states, the 100 largest cities, and all census tracts within the 100 largest cities (Manson et al. 2023). We calculated population densities in 2010 and 2020 using 2020 city boundaries. We calculated city and census tract median incomes as a proportion of their state’s median household income to control regional differences in income by state. We defined low-income areas as having less than 50% and high-income areas as having more than 150% of their state’s median household income. Like several previous studies, we tested ACS workers commuting by automobile, public transit, and walking as proxy measures of exposure at the city level (Merlin et al. 2020).
To broadly represent city safety policy, we noted cities that made Vision Zero commitments. Ferenchak (2023) previously identified 18 cities that established Vision Zero commitments between 2012 and 2016. Of these, 17 were among the 100 largest cities, and we coded them as “early adoption” Vision Zero cities.
Finally, we estimated a multilevel linear model to identify significant associations (p < 0.05) between city-level variables and traffic fatality rates in 2008-2012 and 2018-2022.
3. FINDINGS
The 100 largest US cities had a wide range of fatality rates, with the top 10 cities having fewer than 4.5 and bottom 10 cities having more than 16 fatalities per 100,000 people during 2018-2022 (Table 1). Traffic safety gaps widened during the 2010s as most of the safest cities experienced decreasing traffic fatality rates while the most dangerous cities experienced increasing fatality rates.
Table 1.Top 10 and Bottom 10 Large Cities by Traffic Fatalities per 100,000 People, 2018-2022
| Rank |
Top 100 US City |
Population
2010 |
Population
2020 |
5-Year Fatalities
2008-2012 |
5-Year Fatalities
2018-2022 |
Annual Fatalities per 100K
2008-2012 |
Annual Fatalities per 100K
2018-2022 |
% change in fatalities per 100K
08-12 to 18-22 |
Established Vision Zero 2012-2016 |
| 1 |
Henderson, NV |
257729 |
317610 |
55 |
40 |
4.27 |
2.52 |
-41.0% |
No |
| 2 |
New York, NY |
8175133 |
8804190 |
1377 |
1134 |
3.37 |
2.58 |
-23.5% |
Yes |
| 3 |
Santa Clarita, CA |
176320 |
228673 |
42 |
34 |
4.76 |
2.97 |
-37.6% |
No |
| 4 |
Boston, MA |
617594 |
675647 |
107 |
106 |
3.47 |
3.14 |
-9.4% |
Yes |
| 5 |
Jersey City, NJ |
247597 |
292449 |
48 |
48 |
3.88 |
3.28 |
-15.3% |
No |
| 6 |
Irvine, CA |
212375 |
307670 |
38 |
54 |
3.58 |
3.51 |
-1.9% |
No |
| 7 |
Boise, ID |
205671 |
235684 |
34 |
42 |
3.31 |
3.56 |
7.8% |
No |
| 8 |
San Francisco, CA |
805235 |
873965 |
165 |
174 |
4.10 |
3.98 |
-2.8% |
Yes |
| 9 |
Gilbert, AZ |
208453 |
267918 |
35 |
54 |
3.36 |
4.03 |
20.0% |
No |
| 10 |
Seattle, WA |
608660 |
737015 |
126 |
158 |
4.14 |
4.29 |
3.6% |
Yes |
| 91 |
Kansas City, MO |
459787 |
508090 |
322 |
418 |
14.01 |
16.45 |
17.5% |
No |
| 92 |
Jacksonville, FL |
821784 |
949611 |
526 |
792 |
12.80 |
16.68 |
30.3% |
No |
| 93 |
Tampa, FL |
335709 |
384959 |
204 |
322 |
12.15 |
16.73 |
37.6% |
No |
| 94 |
Atlanta, GA |
420003 |
498715 |
235 |
431 |
11.19 |
17.28 |
54.5% |
No |
| 95 |
Albuquerque, NM |
545852 |
564559 |
221 |
525 |
8.10 |
18.60 |
129.7% |
No |
| 96 |
Tucson, AZ |
520116 |
542629 |
270 |
544 |
10.38 |
20.05 |
93.1% |
No |
| 97 |
Detroit, MI |
713777 |
639111 |
482 |
684 |
13.51 |
21.40 |
58.5% |
No |
| 98 |
St. Louis, MO |
319294 |
301578 |
211 |
342 |
13.22 |
22.68 |
71.6% |
No |
| 99 |
Baton Rouge, LA |
229493 |
227470 |
155 |
287 |
13.51 |
25.23 |
86.8% |
No |
| 100 |
Memphis, TN |
646889 |
633104 |
422 |
937 |
13.05 |
29.60 |
126.9% |
No |
|
All Top 100 US Cities |
59787162 |
65003996 |
20842 |
30164 |
6.97 |
9.28 |
33.1% |
17 of 100 cities |
|
Outside Top 100 Cities |
248958376 |
266445285 |
149724 |
167777 |
12.03 |
12.59 |
4.7% |
|
|
US Total |
308745538 |
331449281 |
170566 |
197941 |
11.05 |
11.94 |
8.1% |
|
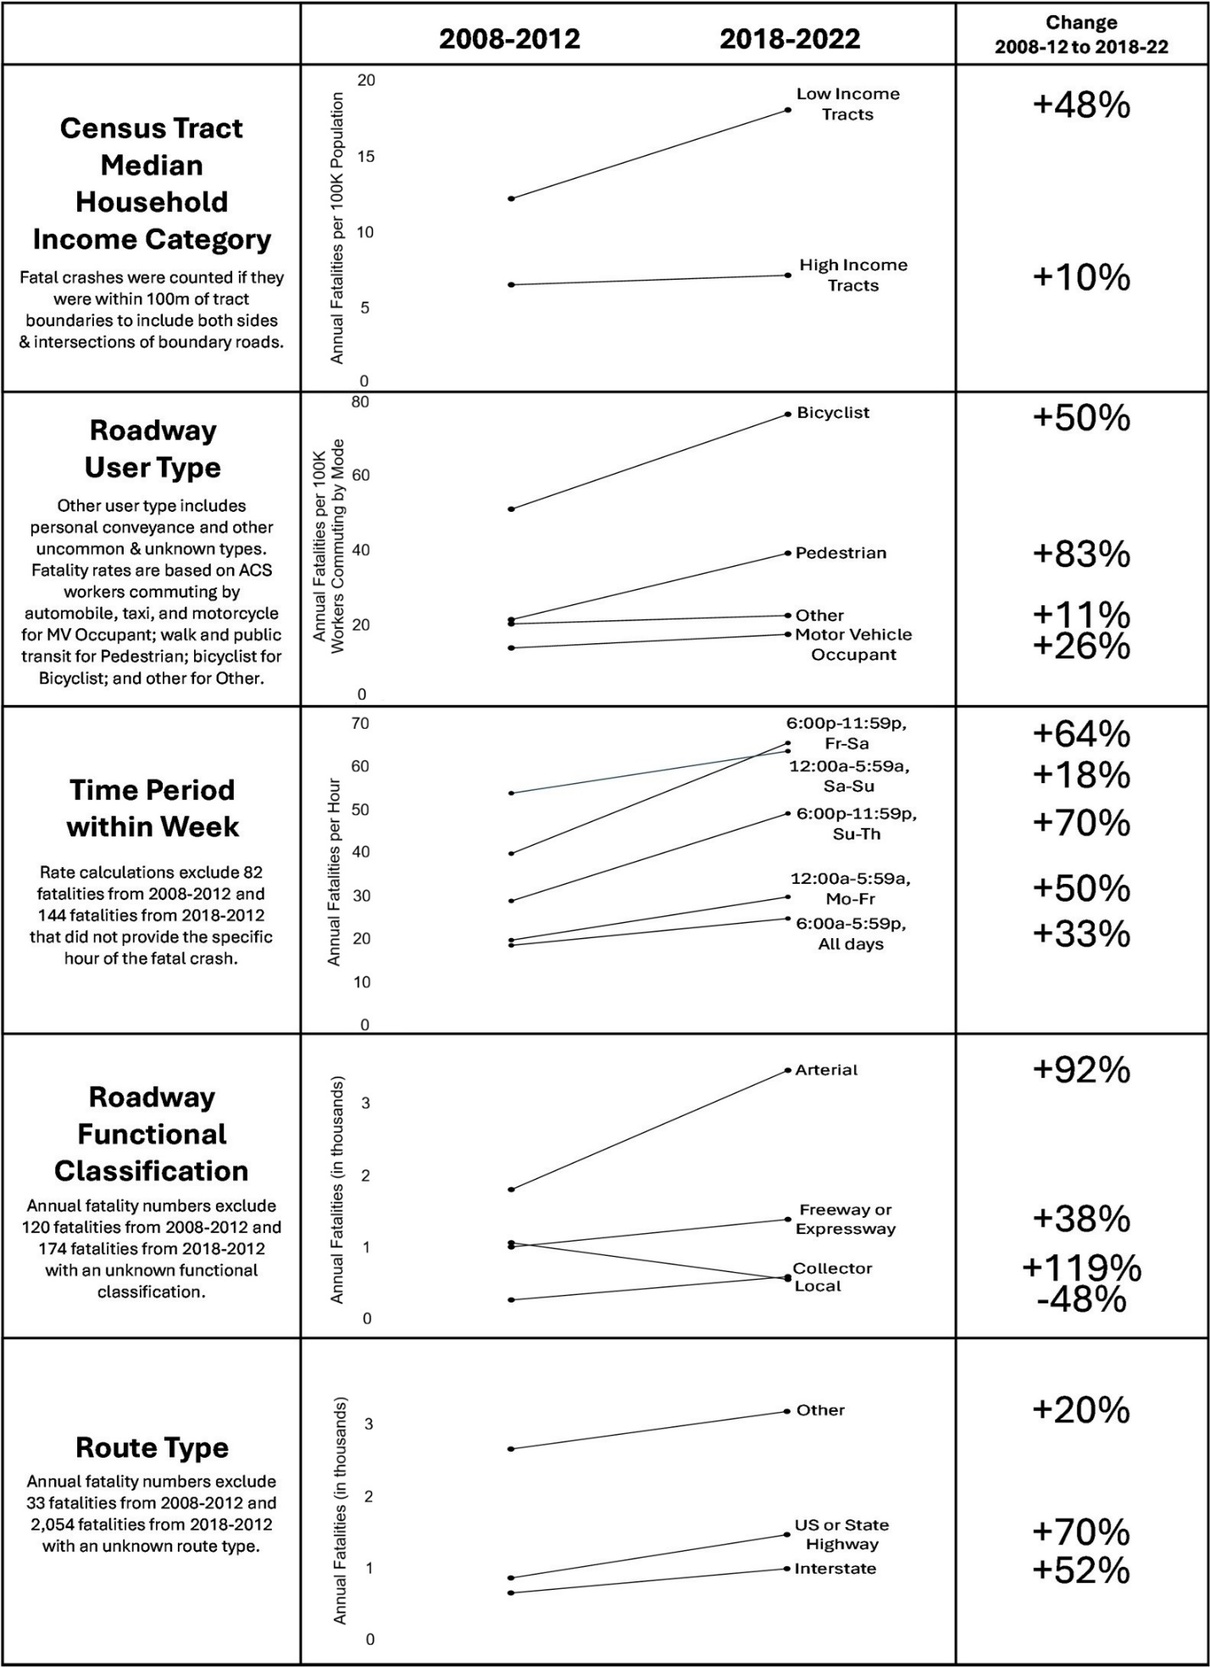
Within the 100 largest cities, several characteristics shifted between 2008-2012 and 2018-2022 (Figure 1). Low-income tracts in the 100 largest cities had higher fatality rates than high-income tracts, and this gap grew between 2008-2012 and 2018-2022. Low-income-tract fatality rates increased by 48% (from 12.2 to 18.1 fatalities per 100,000 people), while high-income-tract fatality rates increased by 10% (from 6.5 to 7.1 fatalities per 100,000 people).

Figure 1.Change in Traffic Fatality Characteristics within 100 Largest Cities, 2008-2012 to 2018-2022
Automobile occupants made up the largest share of people killed in traffic crashes in the 100 largest cities (68% in 2008-2012 and 63% in 2018-2022), followed by pedestrians (27% in 2008-2012 and 32% in 2018-2022). However, fatality rates increased more steeply for pedestrians (+83% fatalities per walk or transit commuter) and bicyclists (+50% fatalities per bicycle commuter) than for other roadway users.
More fatalities in the 100 largest cities occurred between 6:00 pm and 5:59 am than between 6:00 am and 5:59 pm. Comparing 2008-2012 with 2018-2022, the largest increases in fatalities per hour occurred between 6:00 pm and 11:59 pm on Sundays through Thursdays (+70%) and between 6:00 pm and 11:59 pm on Fridays and Saturdays (+64%).
More large city fatalities occurred on arterial roadways than any other roadway type, and the largest fatality increases between 2008-2012 and 2018-2022 were on arterial roadways (+92%) and collector roadways (+119%). Interstates and other US- and state-numbered highways experienced above-average increases in fatalities between the study periods.
Fatality rates in the 100 largest US cities were positively associated with the later study period and total automobile commuters but negatively associated with population density and income (Table 2, Model 1). Cities with higher population densities tend to have shorter trip lengths that are more convenient at slower speeds. They also tend to have higher public transit, walking, and bicycling mode shares, which result in less automobile traffic per person and support safer systems (Ewing and Dumbaugh 2009; Ferenchak 2023; Karaye et al. 2023; Chitturi and Dulce 2023).
Table 2.Multilevel Linear Models of Traffic Fatality Rates in the 100 Largest US Cities1
|
Model 1 |
Model 2 |
|
Estimate |
Sig. |
95% Conf. Interval |
Estimate |
Sig. |
95% Conf. Interval |
| Fixed Effects |
|
|
|
|
|
|
| Intercept |
14.952 |
** |
(12.092 to 17.812) |
14.204 |
** |
(11.237 to 17.171) |
| Millions of automobile commuters |
3.270 |
^ |
(-0.067 to 6.608) |
3.622 |
* |
(0.288 to 6.956) |
| Thousands of people per square km |
-1.125 |
** |
(-1.545 to -0.706) |
-1.061 |
** |
(-1.483 to -0.638) |
| Ratio of City/State median household income |
-6.804 |
** |
(-9.530 to -4.079) |
-6.203 |
** |
(-8.996 to -3.411) |
Period = 2018-2022
(1 = yes; 0 = no) |
3.030 |
** |
(2.472 to 3.588) |
na |
na |
na |
Period = 2018-2022,
early VZ adoption
(1 = yes, 0 = no) |
na |
na |
Na |
1.989 |
** |
(0.664 to 3.314) |
Period = 2018-2022,
no early VZ adoption
(1 = yes, 0 = no) |
na |
na |
Na |
3.209 |
** |
(2.617 to 3.801) |
| Covariance |
|
|
|
|
|
|
| Residual |
3.838 |
** |
(2.909 to 5.064) |
3.790 |
** |
(2.873 to 5.001) |
| Variance of city-level intercept |
8.603 |
** |
(6.096 to 12.143) |
8.455 |
** |
(5.988 to 11.938) |
| Model |
|
|
| -2 Log Likelihood |
1007 |
1004 |
| Akaike's Information Criterion (AIC) |
1021 |
1020 |
| Schwarz's Bayesian Criterion (BIC) |
1044 |
1046 |
1) Dependent variable is annual traffic fatalities per 100,000 people.
2) Statistical significance: ** indicates significant with p < 0.01; * indicates significant with p < 0.05; ^ indicates non-significant with p < 0.10.
A preliminary analysis of Vision Zero policies showed that the 17 early adopter cities experienced a smaller increase in fatalities per 100,000 population (+15%) than the other 83 cities (+40%) (Figure 2). A two-sample t-test showed that this difference was statistically significant (p < 0.01). Still, only three Vision Zero cities actually experienced fatality rate decreases.
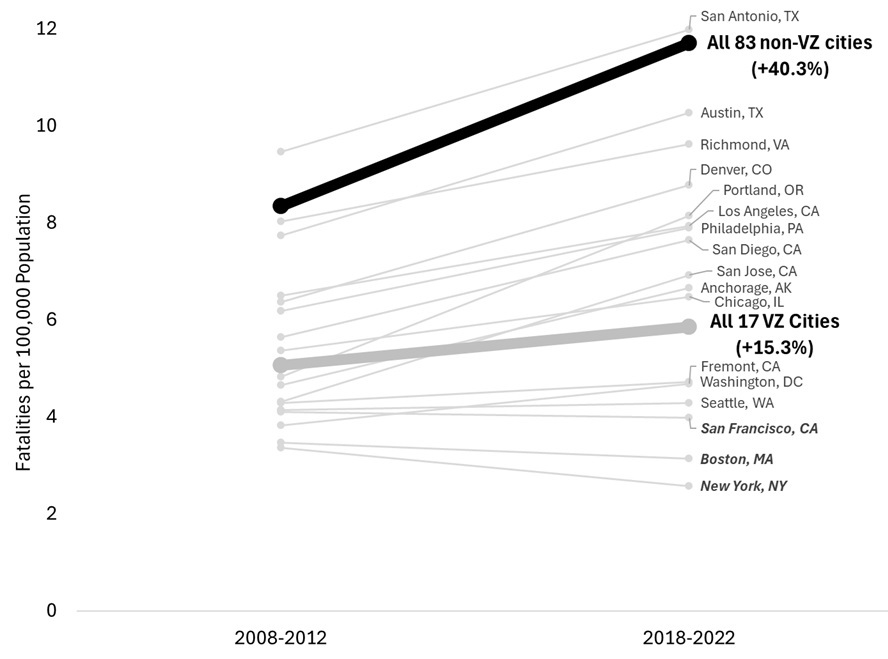
Figure 2.Change in Traffic Fatalities per 100,000 People, 2008-2012 to 2018-2022, by Vision Zero Adoption
The thin gray lines show fatality rate changes for the 17 individual Vision Zero early adopter cities. The three cities that experienced fatality rate decreases are identified with bold, italic text. The thick gray line shows the fatality rate change for all 17 Vision Zero early adopter cities combined. The thick black line shows the fatality rate change for all 83 other cities combined.
Many Vision Zero cities had the baseline advantage of being denser or having higher incomes than other cities. We partitioned our indicator variable for the 2018-2022 period into two different indicator variables (Table 2, Model 2). The 2018-2022 parameter estimate for the 17 early adopter cities (1.99) was lower than for the non-Vision Zero cities (3.21), but a t-test for the difference between these parameter estimates was not significant (p = 0.11). In addition to traditional built environment and behavioral approaches to safety, US cities should address low-density development patterns and sources of neighborhood poverty to prevent traffic deaths.
ACKNOWLEDGEMENT
This study was funded by the US Department of Transportation’s University Transportation Centers Program through the Center for Pedestrian and Bicyclist Safety (CPBS) University Transportation Center (UTC). The contents of this paper reflect the views of the authors, who are responsible for the facts and accuracy of the information presented. This paper does not necessarily reflect the official views or policies of the US government who assume no liability for the contents or use thereof. This paper does not constitute a standard specification, design standard, or regulation. The authors would like to thank Dr. Kelcie Ralph for providing helpful advice on an earlier draft of this paper.
AUTHOR CONTRIBUTION STATEMENT
The authors confirm contribution to the paper as follows: study conception and design: Schneider; data collection: Barbee, Schneider, Nelson, Gu; literature review: Schneider, Barbee; analysis and interpretation of results: Schneider, Barbee, Nelson, Gu; draft manuscript preparation: Schneider. All authors reviewed the results and approved the final version of the manuscript.
Submitted: December 17, 2025 AEST
Accepted: January 29, 2026 AEST
Appendix A. Fatality Data from 100 Largest Cities
This appendix includes a table of traffic fatality data for all 100 large cities analyzed in this study, as well as summary statistics for the 17 Vision Zero cities, 83 other large cities, entire US, other parts of the US besides the 100 largest cities (Table A1). The table provides the number of traffic fatalities and fatality rates per 100,000 people for 2008-2012 and 2018-2022 and is sorted by traffic fatalities per 100,000 people for 2018-2022. It also includes percent change in fatality rates between the two periods and notes which changes are statistically significant. The fatality data are from the Fatality Analysis Reporting System (NHTSA 2025).
Table A1.Traffic Fatality Data from 100 Largest US Cities
| |
Top 100 US City |
Population,
2010 |
Population,
2020 |
Fatalities,
2008-2012 |
Fatalities,
2018-2022 |
Fatalities per 100K,
2008-2012 |
Fatalities per 100K,
2018-2022 |
% change in fatalities per 100K,
08-12 to 18-22 |
Statistical Significance1 |
Established Vision Zero, 2012-2016 |
| 1 |
Henderson, NV |
257729 |
317610 |
55 |
40 |
4.27 |
2.52 |
-41.0% |
- |
No |
| 2 |
New York, NY |
8175133 |
8804190 |
1377 |
1134 |
3.37 |
2.58 |
-23.5% |
- - - |
Yes |
| 3 |
Santa Clarita, CA |
176320 |
228673 |
42 |
34 |
4.76 |
2.97 |
-37.6% |
- |
No |
| 4 |
Boston, MA |
617594 |
675647 |
107 |
106 |
3.47 |
3.14 |
-9.4% |
NS |
Yes |
| 5 |
Jersey City, NJ |
247597 |
292449 |
48 |
48 |
3.88 |
3.28 |
-15.3% |
NS |
No |
| 6 |
Irvine, CA |
212375 |
307670 |
38 |
54 |
3.58 |
3.51 |
-1.9% |
NS |
No |
| 7 |
Boise, ID |
205671 |
235684 |
34 |
42 |
3.31 |
3.56 |
7.8% |
NS |
No |
| 8 |
San Francisco, CA |
805235 |
873965 |
165 |
174 |
4.10 |
3.98 |
-2.8% |
NS |
Yes |
| 9 |
Gilbert, AZ |
208453 |
267918 |
35 |
54 |
3.36 |
4.03 |
20.0% |
NS |
No |
| 10 |
Seattle, WA |
608660 |
737015 |
126 |
158 |
4.14 |
4.29 |
3.6% |
NS |
Yes |
| 11 |
Plano, TX |
259841 |
285494 |
52 |
62 |
4.00 |
4.34 |
8.5% |
NS |
No |
| 12 |
Madison, WI |
233209 |
269840 |
55 |
59 |
4.72 |
4.37 |
-7.3% |
NS |
No |
| 13 |
Fremont, CA |
214089 |
230504 |
41 |
54 |
3.83 |
4.69 |
22.3% |
NS |
Yes |
| 14 |
Washington, DC |
601723 |
689545 |
129 |
163 |
4.29 |
4.73 |
10.3% |
NS |
Yes |
| 15 |
Minneapolis, MN |
382578 |
429954 |
91 |
102 |
4.76 |
4.74 |
-0.3% |
NS |
No |
| 16 |
St. Paul, MN |
285068 |
311527 |
38 |
74 |
2.67 |
4.75 |
78.2% |
++ |
No |
| 17 |
Chula Vista, CA |
243916 |
275487 |
56 |
66 |
4.59 |
4.79 |
4.4% |
NS |
No |
| 18 |
Honolulu, HI |
337256 |
350964 |
95 |
85 |
5.63 |
4.84 |
-14.0% |
NS |
No |
| 19 |
Lincoln, NE |
258379 |
291082 |
32 |
79 |
2.48 |
5.43 |
119.1% |
+++ |
No |
| 20 |
Buffalo, NY |
261310 |
278349 |
62 |
88 |
4.75 |
6.32 |
33.2% |
NS |
No |
| 21 |
North Las Vegas, NV |
216961 |
262527 |
47 |
84 |
4.33 |
6.40 |
47.7% |
+ |
No |
| 22 |
Chicago, IL |
2695598 |
2746388 |
723 |
890 |
5.36 |
6.48 |
20.8% |
+++ |
Yes |
| 23 |
VA Beach, VA |
437994 |
459470 |
117 |
149 |
5.34 |
6.49 |
21.4% |
NS |
No |
| 24 |
Las Vegas, NV |
583756 |
641903 |
187 |
209 |
6.41 |
6.51 |
1.6% |
NS |
No |
| 25 |
Reno, NV |
225221 |
264165 |
59 |
87 |
5.24 |
6.59 |
25.7% |
NS |
No |
| 26 |
Anchorage, AK |
291826 |
291247 |
68 |
97 |
4.66 |
6.66 |
42.9% |
+ |
Yes |
| 27 |
Spokane, WA |
208916 |
228989 |
50 |
77 |
4.79 |
6.73 |
40.5% |
NS |
No |
| 28 |
Chandler, AZ |
236123 |
275987 |
53 |
93 |
4.49 |
6.74 |
50.1% |
+ |
No |
| 29 |
Chesapeake, VA |
222209 |
249422 |
80 |
86 |
7.20 |
6.90 |
-4.2% |
NS |
No |
| 30 |
San Jose, CA |
945942 |
1013240 |
204 |
351 |
4.31 |
6.93 |
60.6% |
+++ |
Yes |
| 31 |
Santa Ana, CA |
324528 |
310227 |
68 |
109 |
4.19 |
7.03 |
67.7% |
+++ |
No |
| 32 |
Pittsburgh, PA |
305704 |
302971 |
83 |
107 |
5.43 |
7.06 |
30.1% |
NS |
No |
| 33 |
Omaha, NE |
408958 |
486051 |
104 |
173 |
5.09 |
7.12 |
40.0% |
++ |
No |
| 34 |
Garland, TX |
226876 |
246018 |
61 |
88 |
5.38 |
7.15 |
33.0% |
NS |
No |
| 35 |
Baltimore, MD |
620961 |
585708 |
179 |
212 |
5.77 |
7.24 |
25.6% |
+ |
No |
| 36 |
Irving, TX |
216290 |
256684 |
73 |
93 |
6.75 |
7.25 |
7.3% |
NS |
No |
| 37 |
Raleigh, NC |
403892 |
467665 |
155 |
172 |
7.68 |
7.36 |
-4.2% |
NS |
No |
| 38 |
Laredo, TX |
236091 |
255205 |
78 |
94 |
6.61 |
7.37 |
11.5% |
NS |
No |
| 39 |
San Diego, CA |
1307402 |
1386932 |
369 |
530 |
5.64 |
7.64 |
35.4% |
+++ |
Yes |
| 40 |
Oakland, CA |
390724 |
440646 |
136 |
169 |
6.96 |
7.67 |
10.2% |
NS |
No |
| 41 |
Durham, NC |
228330 |
283506 |
61 |
111 |
5.34 |
7.83 |
46.6% |
+ |
No |
| 42 |
Philadelphia, PA |
1526006 |
1603797 |
472 |
633 |
6.19 |
7.89 |
27.6% |
+++ |
Yes |
| 43 |
Los Angeles, CA |
3792621 |
3898747 |
1233 |
1548 |
6.50 |
7.94 |
22.1% |
+++ |
Yes |
| 44 |
Anaheim, CA |
336265 |
346824 |
99 |
138 |
5.89 |
7.96 |
35.2% |
+ |
No |
| 45 |
Portland, OR |
583776 |
652503 |
141 |
266 |
4.83 |
8.15 |
68.8% |
+++ |
Yes |
| 46 |
Arlington, TX |
365438 |
394266 |
138 |
168 |
7.55 |
8.52 |
12.8% |
NS |
No |
| 47 |
Long Beach, CA |
462257 |
466742 |
153 |
202 |
6.62 |
8.66 |
30.8% |
+ |
No |
| 48 |
Denver, CO |
600158 |
715522 |
191 |
314 |
6.36 |
8.78 |
37.9% |
+++ |
Yes |
| 49 |
Newark, NJ |
277140 |
311549 |
117 |
140 |
8.44 |
8.99 |
6.4% |
NS |
No |
| 50 |
Columbus, OH |
787033 |
905748 |
285 |
411 |
7.24 |
9.08 |
25.3% |
++ |
No |
| 51 |
Fort Wayne, IN |
253691 |
263886 |
92 |
120 |
7.25 |
9.09 |
25.4% |
NS |
No |
| 52 |
Scottsdale, AZ |
217385 |
241361 |
70 |
111 |
6.44 |
9.20 |
42.8% |
+ |
No |
| 53 |
Richmond, VA |
204214 |
226610 |
82 |
109 |
8.03 |
9.62 |
19.8% |
NS |
Yes |
| 54 |
Aurora, CO |
325078 |
386261 |
85 |
188 |
5.23 |
9.73 |
86.1% |
+++ |
No |
| 55 |
Norfolk, VA |
242803 |
238005 |
86 |
116 |
7.08 |
9.75 |
37.6% |
+ |
No |
| 56 |
Mesa, AZ |
439041 |
504258 |
152 |
252 |
6.92 |
9.99 |
44.3% |
+++ |
No |
| 57 |
Colorado Springs, CO |
416427 |
478961 |
113 |
240 |
5.43 |
10.02 |
84.7% |
+++ |
No |
| 58 |
Winston Salem, NC |
229617 |
249545 |
96 |
127 |
8.36 |
10.18 |
21.7% |
NS |
No |
| 59 |
Austin, TX |
790390 |
961855 |
306 |
494 |
7.74 |
10.27 |
32.7% |
+++ |
Yes |
| 60 |
El Paso, TX |
649121 |
678815 |
281 |
356 |
8.66 |
10.49 |
21.1% |
+ |
No |
| 61 |
Lexington-Fayette, KY |
295803 |
322570 |
135 |
171 |
9.13 |
10.60 |
16.2% |
NS |
No |
| 62 |
Corpus Christi, TX |
305215 |
317863 |
120 |
169 |
7.86 |
10.63 |
35.2% |
+ |
No |
| 63 |
Stockton, CA |
291707 |
320804 |
125 |
175 |
8.57 |
10.91 |
27.3% |
+ |
No |
| 64 |
Fresno, CA |
494665 |
542107 |
168 |
297 |
6.79 |
10.96 |
61.3% |
+++ |
No |
| 65 |
Charlotte, NC |
731424 |
874579 |
280 |
490 |
7.66 |
11.21 |
46.4% |
+++ |
No |
| 66 |
Sacramento, CA |
466488 |
524943 |
175 |
295 |
7.50 |
11.24 |
49.8% |
+++ |
No |
| 67 |
Cincinnati, OH |
296943 |
309317 |
101 |
176 |
6.80 |
11.38 |
67.3% |
+++ |
No |
| 68 |
Wichita, KS |
382368 |
397532 |
141 |
229 |
7.38 |
11.52 |
56.2% |
+++ |
No |
| 69 |
Toledo, OH |
287208 |
270871 |
110 |
159 |
7.66 |
11.74 |
53.3% |
+++ |
No |
| 70 |
Bakersfield, CA |
347483 |
403455 |
138 |
239 |
7.94 |
11.85 |
49.2% |
+++ |
No |
| 71 |
San Antonio, TX |
1327407 |
1434625 |
628 |
860 |
9.46 |
11.99 |
26.7% |
+++ |
Yes |
| 72 |
Houston, TX |
2099451 |
2304580 |
1047 |
1393 |
9.97 |
12.09 |
21.2% |
+++ |
No |
| 73 |
Greensboro, NC |
269666 |
299035 |
115 |
182 |
8.53 |
12.17 |
42.7% |
++ |
No |
| 74 |
Fort Worth, TX |
741206 |
918915 |
313 |
560 |
8.45 |
12.19 |
44.3% |
+++ |
No |
| 75 |
Milwaukee, WI |
594833 |
577222 |
197 |
359 |
6.62 |
12.44 |
87.8% |
+++ |
No |
| 76 |
Oklahoma City, OK |
579999 |
681054 |
374 |
425 |
12.90 |
12.48 |
-3.2% |
NS |
No |
| 77 |
Riverside, CA |
303871 |
314998 |
117 |
198 |
7.70 |
12.57 |
63.3% |
+++ |
No |
| 78 |
Lubbock, TX |
229573 |
257141 |
125 |
172 |
10.89 |
13.38 |
22.8% |
NS |
No |
| 79 |
Indianapolis, IN |
820445 |
887642 |
374 |
618 |
9.12 |
13.92 |
52.7% |
+++ |
No |
| 80 |
Tulsa, OK |
391906 |
413066 |
247 |
295 |
12.61 |
14.28 |
13.3% |
NS |
No |
| 81 |
Orlando, FL |
238300 |
307573 |
155 |
220 |
13.01 |
14.31 |
10.0% |
NS |
No |
| 82 |
New Orleans, LA |
343829 |
383997 |
172 |
278 |
10.00 |
14.48 |
44.7% |
+++ |
No |
| 83 |
Nashville, TN |
601222 |
689447 |
317 |
501 |
10.55 |
14.53 |
37.8% |
+++ |
No |
| 84 |
Miami, FL |
399457 |
442241 |
213 |
323 |
10.66 |
14.61 |
37.0% |
+++ |
No |
| 85 |
Saint Petersburg, FL |
244769 |
258308 |
152 |
191 |
12.42 |
14.79 |
19.1% |
NS |
No |
| 86 |
Cleveland, OH |
396815 |
372624 |
163 |
285 |
8.22 |
15.30 |
86.2% |
+++ |
No |
| 87 |
Louisville, KY |
597337 |
633045 |
314 |
498 |
10.51 |
15.73 |
49.7% |
+++ |
No |
| 88 |
Phoenix, AZ |
1445632 |
1608139 |
730 |
1277 |
10.10 |
15.88 |
57.3% |
+++ |
No |
| 89 |
Glendale, AZ |
226721 |
248325 |
94 |
198 |
8.29 |
15.95 |
92.3% |
+++ |
No |
| 90 |
Dallas, TX |
1197816 |
1304379 |
629 |
1059 |
10.50 |
16.24 |
54.6% |
+++ |
No |
| 91 |
Kansas City, MO |
459787 |
508090 |
322 |
418 |
14.01 |
16.45 |
17.5% |
+ |
No |
| 92 |
Jacksonville, FL |
821784 |
949611 |
526 |
792 |
12.80 |
16.68 |
30.3% |
+++ |
No |
| 93 |
Tampa, FL |
335709 |
384959 |
204 |
322 |
12.15 |
16.73 |
37.6% |
+++ |
No |
| 94 |
Atlanta, GA |
420003 |
498715 |
235 |
431 |
11.19 |
17.28 |
54.5% |
+++ |
No |
| 95 |
Albuquerque, NM |
545852 |
564559 |
221 |
525 |
8.10 |
18.60 |
129.7% |
+++ |
No |
| 96 |
Tucson, AZ |
520116 |
542629 |
270 |
544 |
10.38 |
20.05 |
93.1% |
+++ |
No |
| 97 |
Detroit, MI |
713777 |
639111 |
482 |
684 |
13.51 |
21.40 |
58.5% |
+++ |
No |
| 98 |
St. Louis, MO |
319294 |
301578 |
211 |
342 |
13.22 |
22.68 |
71.6% |
+++ |
No |
| 99 |
Baton Rouge, LA |
229493 |
227470 |
155 |
287 |
13.51 |
25.23 |
86.8% |
+++ |
No |
| 100 |
Memphis, TN |
646889 |
633104 |
422 |
937 |
13.05 |
29.60 |
126.9% |
+++ |
No |
| |
All Top 100 US Cities |
59787162 |
65003996 |
20842 |
30164 |
6.97 |
9.28 |
33.1% |
+++ |
17 cities |
| |
17 Vision Zero Cities |
25087774 |
26942332 |
6362 |
7881 |
5.07 |
5.85 |
15.3% |
+++ |
|
| |
83 Other Cities |
34699388 |
38061664 |
14480 |
22283 |
8.35 |
11.71 |
40.3% |
+++ |
|
| |
Outside Top 100 Cities |
248958376 |
266445285 |
149724 |
167777 |
12.03 |
12.59 |
4.7% |
+++ |
|
| |
US Total |
308745538 |
331449281 |
170566 |
197941 |
11.05 |
11.94 |
8.1% |
+++ |
|
1) Result of a Z-test of proportions: Positive signs indicate that the fatality rate during 2018-2022 was significantly higher than in 2008-2012 (+++ indicates 99.9% confidence; ++ indicates 99%; + indicates 95%). Negative signs indicate that the fatality rate during 2018-2022 was significantly lower than in 2008-2012 (- - - indicates 99.9% confidence; - - indicates 99%; - indicates 95%). NS indicates not significant.