1. Questions
Bicycling in Canada is gender-skewed, particularly related to commuting. National health survey data shows that while women represent 43% of leisure cyclists, men outnumber women 2:1 for commuting (Firth et al. 2021). Research suggests that separated bicycling infrastructure can increase both overall cycling mode share and the proportion of women bicycling (Garrard et al. 2008). To our knowledge, no prior field observation studies by route design type have been conducted in Toronto, Canada. Field observations are important as we have previously noted that studying the implementation of interventions is difficult when relying on secondary data from cities which are often inadequate and inaccurate (Rothman et al. 2024). During the COVID-19 pandemic, the City of Toronto accelerated its bicycling infrastructure under its ActiveTO program (Rothman et al. 2024). This study utilized field observations of the new and expanded infrastructure to answer:
-
What is the overall gender distribution of cyclists in Toronto and across different cycling infrastructure?
-
Does the gender distribution vary between weekday commuter hours and weekends?
2. Methods
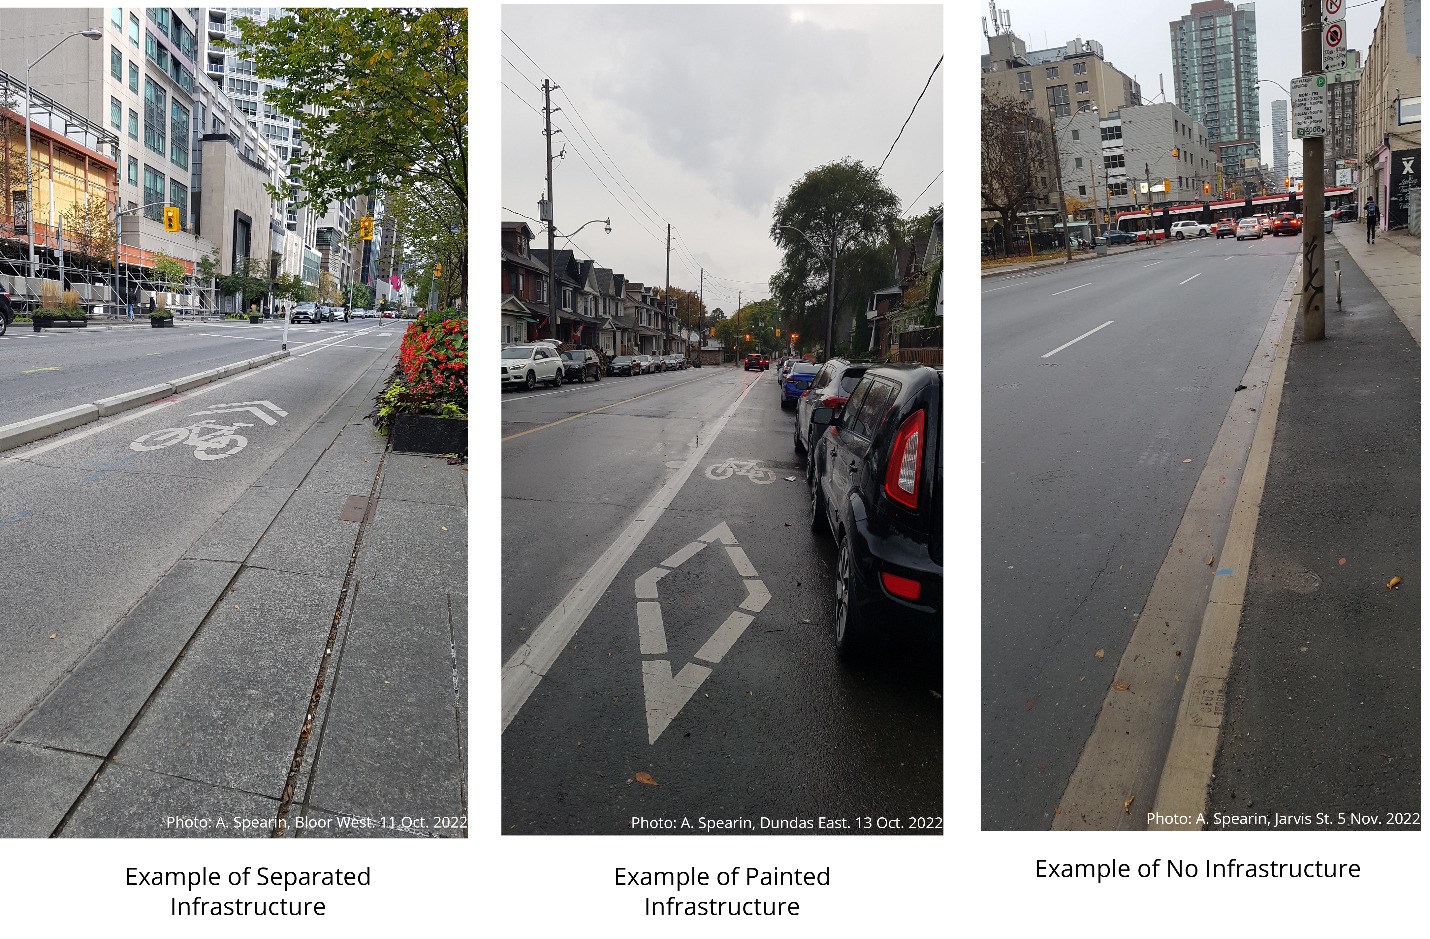
We examined three types of infrastructure: physically separated bicycle lanes (“separated”), painted bicycle lanes (“painted”), and “none” (Table 1, Figure 1), based on Can-BICS classifications emphasizing safety and user comfort (Winters et al. 2020).

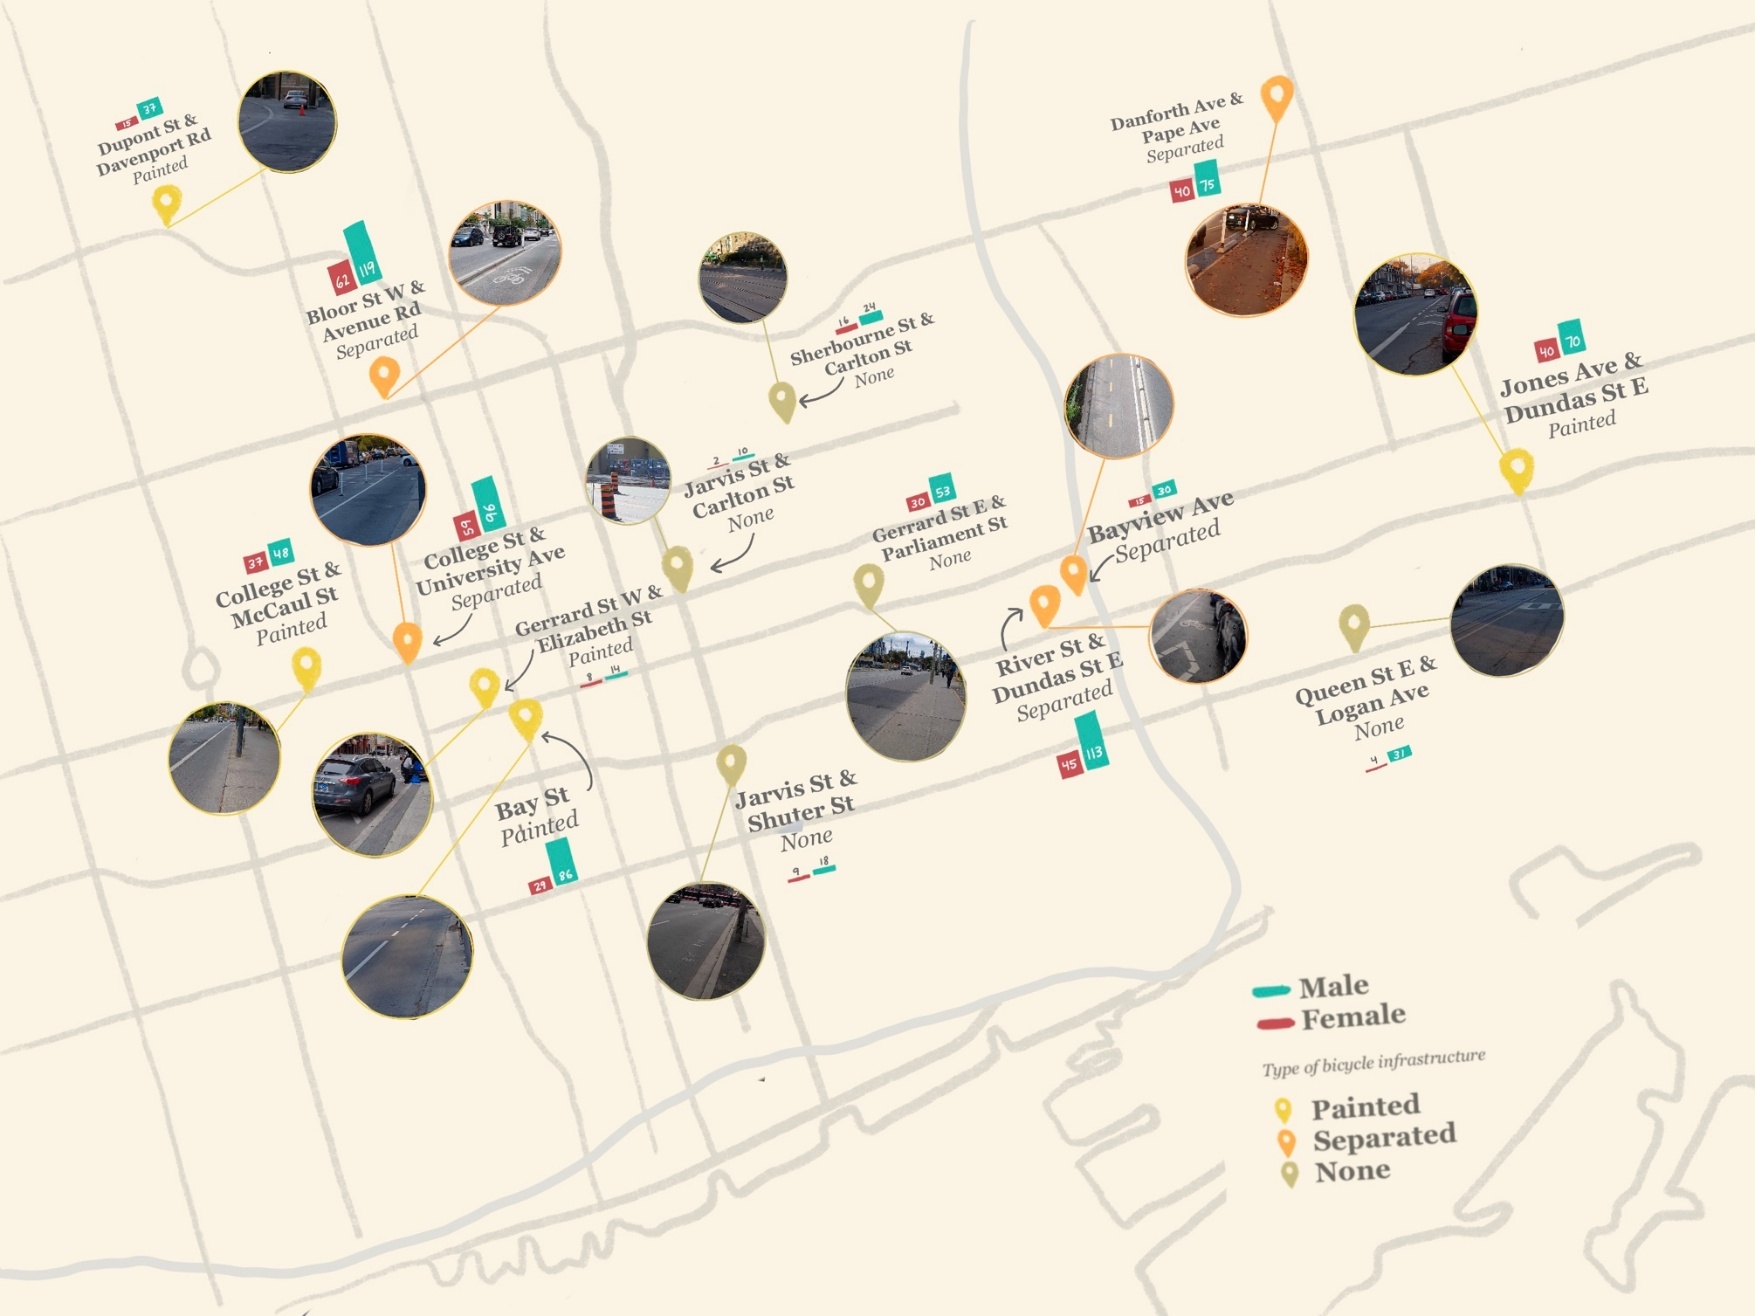
Five segments of the new ActiveTO separated infrastructure were selected for observation (Figure 2, details in Supplementary Table), with observations conducted mid-block on the inbound side to the city centre. Four segments were matched with two comparison segments travelling in a similar direction: painted unseparated and no specific bicycling infrastructure. Each comparison segment was >550 metres away from its separated infrastructure segment to avoid the ‘safety-halo effect’ up to 550 metres away from a separated cycle track in Toronto (Ling et al. 2020). The fifth segment (Bayview Ave) represents a primarily recreational route with no appropriate comparison sites, so it was observed as a stand-alone site. Data were collected in Toronto between Oct 1st and November 7th, 2022, on days when there was no heavy rain.

A single observer (AS), conducted four 15-minute observation sessions on each of the 13 segments, equalling 13 total hours of observation time. Sessions included three weekday morning rush-hour periods (7:45 AM–9:15 AM) and one weekend afternoon (11:45 AM–1:15 PM). Adult gender was assessed by visual observation; children were counted separately, whether they were riding independently, or on an adult’s bike. Chi-square tests of association were conducted and stratified by observation day (weekday and weekend), which may be indicative of commuters versus recreational riders. Generalized estimating equations (GEE) overall (Model A) and then stratified by weekday (Model B) and weekend (Model C) were used to examine associations between bicycle infrastructure and gender, controlling for road classification and accounting for location clustering. Children (n=12) and adults for whom gender could not be assigned (n=8) were excluded from these analyses.
3. Findings
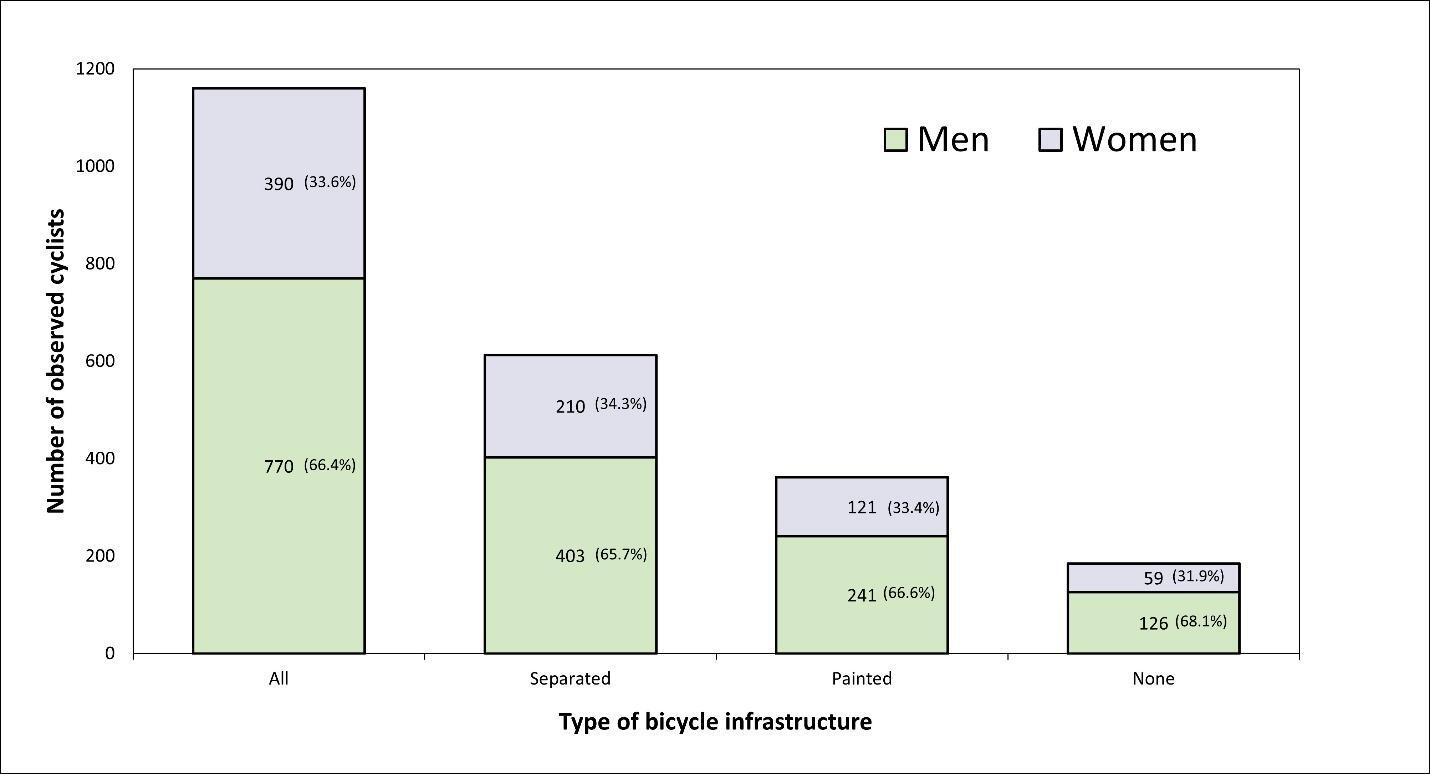
Of the 1180 bicyclists observed, 53% used separated infrastructure, 31.3% used painted lanes and 15.8% used no infrastructure (Table 2). Bicyclists were predominantly men (65.3%) versus women (33.1%); a 2:1 ratio across all infrastructure types.
This finding aligns with those reported in Canadian field observation studies and in self-reported national health survey data. (Bouris and Winters 2025; Firth et al. 2021; Ledsham et al. 2013; Meghan Winters et al. 2023). This is also on par with international findings; females are on average 50-60% less likely to cycle than males where locations with cycling mode share less than 7% - in Toronto, 4.4% of all reported trips are made by bicycle (City of Toronto 2024; Goel et al. 2022; Pearson et al. 2025). While the proportion of women increased slightly with greater separation (31.9% on “none” vs. 34.3% on “separated”, Figure 3), the association was not statistically significant in bivariate (𝜒2 = 0.37, df=2, p = 0.83) or multivariate analyses (Table 3). Women made up a larger proportion of cyclists on weekdays (p<.0001); and had higher odds of cycling on weekdays (Table 3, Model A, OR 1.16, 95% CI 1.06. 1.27). Women had greater odds of cycling on collector roads on the weekend (Table 3, Model C, OR 1.27, 95% CI 1.11, 1.44), which may be indicative of different destinations and routes on the weekends.

The lack of significant gender variation in our study was unexpected as literature commonly suggests women prefer protected infrastructure (Aldred et al. 2017; Garrard et al. 2008; Winters et al. 2010). Our findings may reflect Toronto’s relatively new poorly developed cycling network, which women may be more sensitive to in terms of mode choice. As evident in Toronto’s online cycling map, the network exhibits many gaps (City of Toronto 2025). Our non-infrastructure comparison sites could be conceptualized as gaps in the network, which may have impacts beyond the immediate locality. Additionally, physical barriers on separated infrastructure were frequently broken or missing, reflecting maintenance and discontinuity issues which impacts both mode choice (Hull and O’Holleran 2014) and safety (Li et al. 2024). Additionally, the separated infrastructure was relatively new at the time of study (Rothman et al. 2024); post-pandemic habits and gender-based usage patterns are likely still evolving(Ong et al. 2024; Sweet and Scott 2023). Recent legislative threats in Ontario to remove existing bicycling infrastructure further complicate the future of Toronto’s network (Alevato 2025).
To conclude, men outnumber women two-to-one regardless of infrastructure design in Toronto. Achieving gender parity may likely need improvements to infrastructure quality, connectivity, and maintenance.